Europe Fine Chemical Market
Pharmaceutical Companies in Europe to Gradually Brew up Interest in Fine Chemicals for Initiating Successful Production of Steroids, Alkaloids, and Peptides! Read More in FMI’s Report!
Europe Fine Chemical Market by Product Type, Manufacturing Type, End Use & Region | Forecast 2022 to 2032
Europe Fine Chemical Market Outlook (2022 to 2032)
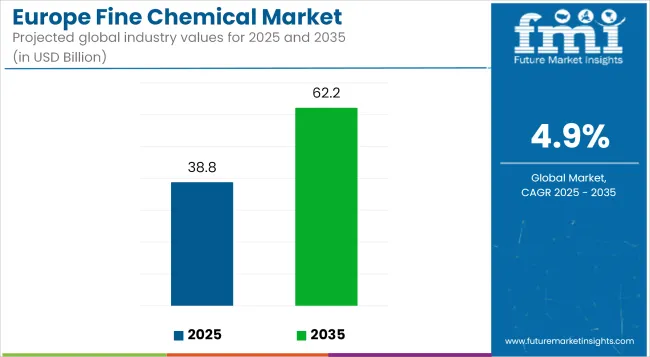
The Europe fine chemical market is projected to reach a valuation of US$ 33,612.1 million in 2022. By reaching a valuation of US$ 53,714.2 million in 2032, the market is anticipated to exhibit moderate growth at a CAGR of 4.9% from 2022 to 2032.
Fine chemicals are single, pure chemicals that are often created in small and restricted quantities by using batch or biotechnological procedures, followed by synthesis, segregation, and purification. Few of the common examples of fine chemicals utilized are polypeptides, aromatic compounds, monoclonal antibodies, erythropoietin, nucleotides, and plastic additives.
Pharmaceuticals, agrochemicals, building materials, food & beverages, electronics, and others extensively employ fine chemicals for their applications in chemical manufacturing. Increasing demand for these types of chemicals among key industries, including pharmaceuticals & nutraceuticals, agriculture, cosmetics, and personal care, are fueling sales.
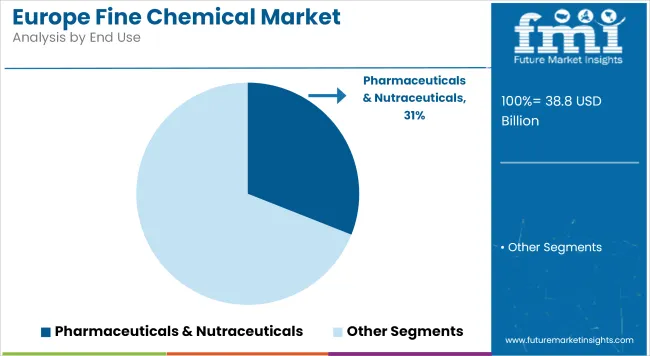
Demand for fine chemicals is primarily being driven by their increasing usage in the pharmaceutical industry. High demand for fine chemicals in pharmaceuticals as pure substances, as compared to commodity chemicals is a prominent factor driving the Europe fine chemical market.
Fine chemicals are extensively used in the manufacturing of medicines to treat heart and blood vessel diseases. These are categorized by their low volume and high value structure. Fine chemicals are further combined with bulk or specialty chemicals to produce complex chemicals, which have applications in pharmaceuticals and nutraceuticals.
Pharmaceutical fine chemicals can play a decisive role in the treatment of brain cancer, lung cancer, blood cancer, and liver cancer. Key companies have established divisions that mainly focus on developing specific drugs for certain conditions such as solid tumors and hematological oncology.
Increasing construction and development activities is bound to propel the demand for raw materials such as sealants, adhesives, and inhibitors, thereby leading to a significant surge in terms of value of the Europe fine chemical industry. As complex chemicals are manufactured through fine chemicals, demand for these raw materials are anticipated to increase in the next ten years.
Attributes |
Key Insights |
Europe Fine Chemical Market Estimated Size (2022E) |
US$ 33,612.1 million |
Projected Market Valuation (2032F) |
US$ 53,714.2 million |
Value-based CAGR (2022 to 2032) |
4.8% |
Collective Value Share: Top 3 Countries (2022E) |
55.6% |
Let us know your requirement to get
100% FREE customization
2017 to 2021 Europe Fine Chemical Market Outlook Compared to 2022 to 2032 Demand Forecast
In the historical period from 2017 to 2021, demand for fine chemicals grew by 2.9% year over year. Demand for fine chemicals has been consistently increasing due to rising demand from end-use industries. Demand for active pharmaceutical ingredients rose during the pandemic crisis in 2020, whereas other chemicals witnessed a dip down at the same time, which impacted growth in the market.
Based on current estimations, the market for fine chemicals in Europe is expected to witness a CAGR of about 4.8% over the period of 2022 to 2032. High growth prospects in the forecast period is mainly pushed by increasing demand from end-use industries and expansion of production capacities. With the trend of utilization of application-specific chemicals in Europe, the market is expected to expand in the forecast period.
Comparative Analysis of Adjacent Europe Fine Chemical Markets
Europe Fine Chemical Market:
Differentiating Aspects |
Europe Fine Chemical Market |
CAGR in 2022 to 2032 |
4.9% |
Current Valuation in 2022 |
US$ 33,612 million |
Projected Valuation in 2032 |
US$ 53,714 million |
Demand Drivers |
|
Acrolein Market:
Differentiating Aspects |
Acrolein Market |
CAGR in 2022 to 2032 |
3.2% |
Current Valuation in 2022 |
US$ 1,231.9 million |
Projected Valuation in 2032 |
US$ 1,687.9 million |
Demand Drivers |
|
Kyanite Market:
Differentiating Aspects |
Kyanite Market |
CAGR in 2022 to 2032 |
3.2% |
Current Valuation in 2022 |
US$ 147.8 million |
Projected Valuation in 2032 |
US$ 202.5 million |
Demand Drivers |
|
Find your sweet spots for generating winning opportunities in this market.
Talk to AnalystTop Trends Pushing Sales of Fine Chemicals across Europe
- Demand for Fine Chemicals to Skyrocket among Pharmaceutical Product Manufacturers
Prominent companies are focusing on consumers’ needs and formulating innovative marketing strategies, which will drive the market in the next ten years. These companies are strengthening their footprints by employing various approaches such as mergers, acquisitions, partnerships, and new product launches across Europe. Demand for fine chemicals is increasing as key suppliers launch new, innovative products.
Manufacturers are mainly focusing on the pharmaceutical industry to increase production of fine chemicals as the pharmaceutical sector remains a prominent consumer. Key manufacturers are also implementing several lucrative and cost-effective methods to produce fine chemicals, which have in turn, increased demand for such products in recent years.
Leading companies are investing in research and development activities to improve product effectiveness and efficacy. This is further expected to expand the application coverage of fine chemicals in agrochemicals, construction chemicals, and additives.
South Korea chemical industry has continuously expanded the cosmetics raw material market in recent years, which is also one of the development factors for key fine chemical manufacturers. Launch of novel and innovative products for end-use industries such as agriculture, chemicals, and electronics would help to create new opportunities for fine chemical manufacturers in Europe.
Why are Increasing Environmental and Health Concerns Hampering Demand For Fine Chemicals?
Growing public knowledge of the harmful consequences of skin allergies caused by the use of specific fine chemicals is anticipated to impede industry expansion in Europe. Overuse can irritate the eyes and result in skin irritation, edoema, and inflammation. Regular chemical peels might enhance a person's skin's sensitivity to UV rays and make their skin more susceptible to sunburn.
Global trade limitations and rigorous laws guiding society's regulatory taxes on products are limiting progress. These are also having an impact on the manufacture of fine chemicals. Stringent regulations imposed by government agencies across Europe on manufacturers regarding the upper limit of fine chemical usage in pharmaceutical formulations are also acting as a barrier to adoption. A high threat from these regulations is anticipated to restrain the fine chemical industry.

A unified Market Research Subscription Platform, built for today's disparate research needs.
Country-wise Insights
Why is the Demand for Fine Chemicals Set to Elevate in Germany?
Burgeoning Demand for Agrochemicals in Germany to Push Fine Chemical Products Sales
Demand for fine chemicals is expected to remain prominent in Germany owing to presence of key chemical and pharmaceutical companies. In 2032, Germany is expected to account for more than 31% of volume shares in Europe fine chemical market. More than 500 pharmaceutical companies are located in Germany, which would drive demand for fine chemicals.
Burgeoning demand for pharmaceutical and agrochemical products that consume a high volume of fine chemicals remain a key reason responsible for the dominance of Europe in the fine chemical sector. Substantial production of fine chemicals for pharmaceuticals, strong development in the agrochemical industry, and surging demand for fine chemicals are key factors pushing fine chemicals sales in Germany.
Why are Fine Chemical Manufacturers Showcasing High Sales in France?
Increasing Demand for Insecticides in France to Fuel Sales among Fine Chemical Industries
France is expected to surge at a CAGR of 4.9% between 2022 and 2032 with the presence of key chemical manufacturers in the country. Demand for fine chemicals is expected to be high in France, followed by Germany. In 2022, the country is expected to account for high-value shares following Germany in the Europe fine chemical industry.
Key players in agrochemical sector across France include BASF Agro, Syngenta, Monsanto, Dow Agro, and Bayer. The country exports active pharmaceutical ingredients to developing countries. For increasing crop production in France, farmers are implementing pesticides and insecticides in their farms. Agrochemicals are the first choice of farmers and hence demand & supply of fine chemicals are high in France.
Category-wise Insights
Which is the Most Preferred Type of Fine Chemical in the World?
Development of Pharmaceutical Ingredients across Europe to Spur Sales of Fine Chemicals and Solvents
Pharmaceuticals, including active pharmaceutical ingredients, excipients, peptides & proteins, steroids, and alkaloids are set to be key fine chemicals. In 2022, the pharmaceuticals product type segment accounted for 64.7% of share in the Europe market for fine chemicals. Owing to ongoing development of the pharmaceutical industry in Europe, consumption of pharmaceutical-based fine chemicals is projected to remain prominent.
Medications are often employed to identify, treat, and cure diseases. They are also utilized in illness prevention. These chemicals are used as steroids, alkaloids, peptides, and proteins in medicine and nutraceutical manufacturing. Increasing investments in pharmaceutical ingredients across Europe are expected to boost demand for fine chemicals in the next ten years.
Which Manufacturing Type Segment is Expected to Generate High Shares?
Captive Manufacturing of Organic Fine Chemicals to Gain Traction Worldwide
According to Future Market Insights, captive manufacturing is set to be the key manufacturing type segment. In 2022, the captive manufacturing type segment accounted for more than 62% of value share in the Europe fine chemical market.
Fine chemicals that are extensively used by manufacturers are considered to be under the captive segment. Few agrochemical and pharmaceutical companies tend to produce their products and then use them to manufacture their products. Research and development departments of key companies are innovating fine chemical applications in their existing products, upgrading them, and introducing new products in the market.
Competitive Landscape
Manufacturers are focusing on the enhancement of their production capacities in the presence of continued competition in Europe fine chemical market, particularly in Germany and France. Increasing demand from expanding end-use applications is expected to drive demand for fine chemicals.
For instance,
- In November 2021, Pfizer and Biohaven Pharmaceutical Holding Company Ltd. (Biohaven Pharmaceutical Ireland DAC, and BioShin Limited) entered into a collaboration and license agreement & related sublicense agreement to commercialize Nurtec ODT. It is a calcitonin gene- related peptide receptor for the preventive and acute treatment of migraine.
- In June 2021, for the construction of a new drug substance production line at its location in Geleen, Netherlands, Lonza Group Ltd announced expanded cooperation with Moderna.
- In December 2019, the third tertiary amines factory will be built by the Global Amines Company (GAC), a 50/50 joint venture between the world's largest speciality chemical company Clariant and Asia's largest agribusiness conglomerate Wilmar International.
Scope of the Report
Attribute |
Details |
Estimated Market Size (2022) |
US$ 33,612 million |
Projected Market Valuation (2032) |
US$ 33,612 million |
Value-based CAGR (2022 to 2032) |
4.9% |
Forecast Period |
2022 to 2032 |
Historical Data Available for |
2017 to 2021 |
Market Analysis |
Value (US$ million) and Volume (Tons) |
Key Countries Covered |
Germany, Italy, France, United Kingdom, Spain, BENELUX, Russia, and Rest of Europe |
Key Segments Covered |
Product Type, Manufacturing Type, End Use, and Country |
Key Companies Profiled |
|
Report Coverage |
Market Forecast, Company Share Analysis, Competition Intelligence, Driver, Restrain, Opportunity, Threat Analysis, Market Dynamics and Challenges, and Strategic Growth Initiatives |
Europe Fine Chemical Market Segmentation
By Product Type:
- Pharmaceuticals
- Agrochemicals
- Construction Chemicals
- Additives
- Specialty Polymers
- Pigments and Dyes
- Flavors and Fragrance Ingredients
- Water Treatment Chemicals
- Surfactants
- Others
By Manufacturing Type:
- Captive
- Merchant
By End Use:
- Pharmaceuticals and Nutraceuticals
- Agriculture Industry
- Cosmetics and Personal Care
- Petrochemicals and Plastic Industry
- Food and Beverages
- Electronics
- Paints and Coatings
- Building and Construction
- Lubricants and Oil
- Textiles
- Others
By Country:
- Germany
- Italy
- France
- United Kingdom
- Spain
- BENELUX
- Russia
- Rest of Europe
Frequently Asked Questions
What was the global Europe fine chemicals industry size reported by Future Market Insights for 2022?
The Europe market for fine chemicals is estimated to reach a valuation of US$ 33,612.1 million in 2022.
The Europe market for fine chemicals is projected to reach a valuation of US$ 53,714.2 million in 2032.
Europe fine chemicals industry exhibited around 2.9% CAGR over the past five years.
The Europe fine chemical industry is estimated to expand at a CAGR of 4.5% from 2022 to 2032.
The pharmaceuticals segment by end use is projected to account for a significant value share by 2022.
Captive manufacturing type is anticipated to expand significantly between 2022 and 2032.
Table of Content
1. Executive Summary | Europe Fine Chemical Market
1.1. Europe Fine Chemical Market Outlook
1.2. Demand Side Trends
1.3. Supply Side Trends
1.4. Technology Roadmap
1.5. Analysis and Recommendations
2. Fine Chemical Market Overview
2.1. Fine Chemical Market Coverage / Taxonomy
2.2. Fine Chemical Market Definition / Scope / Limitations
3. Key Fine Chemical Market Trends
3.1. Key Trends Impacting the Fine Chemical Market
3.2. Product Innovation / Development Trends
4. Key Success Factors
4.1. Product Adoption / Usage Analysis
4.2. Product USPs / Features
4.3. Strategic Promotional Strategies
5. Europe Fine Chemical Market Demand Analysis 2017 to 2021 and Forecast, 2022 to 2032
5.1. Historical Fine Chemical Market Volume (Tons) Analysis, 2017 to 2021
5.2. Current and Future Fine Chemical Market Volume (Tons) Projections, 2022 to 2032
5.3. Y-o-Y Growth Trend Analysis
6. Europe Fine Chemical Market - Pricing Analysis
6.1. Regional Pricing Analysis By Product Type
6.2. Europe Average Pricing Analysis Benchmark
7. Europe Fine Chemical Market Demand (in Value or Size in US$ million) Analysis 2017 to 2021 and Forecast, 2022 to 2032
7.1. Historical Fine Chemical Market Value (US$ million) Analysis, 2017 to 2021
7.2. Current and Future Fine Chemical Market Value (US$ million) Projections, 2022 to 2032
7.2.1. Y-o-Y Growth Trend Analysis
7.2.2. Absolute $ Opportunity Analysis
8. Fine Chemical Market Background
8.1. Macro-Economic Factors
8.1.1. Europe GDP Growth Outlook
8.1.2. Europe Chemical Industry Overview
8.1.3. Europe Pharmaceutical Industry Overview
8.1.4. Europe Agricultural Sector Outlook
8.1.5. Specialty Chemicals Industry Outlook
8.1.6. Water Treatment Industry Overview
8.1.7. Europe Construction Sector Outlook
8.1.8. Other Macro-economic Factors
8.2. Forecast Factors - Relevance and Impact
8.2.1. Growth in Trade
8.2.2. Availability Custom Manufacturing Technology
8.2.3. GDP Growth Forecast
8.2.4. Manufacturing Industry Forecast
8.2.5. Growing Demand from End Use Industry
8.2.6. Impact of Regulations
8.2.7. Presence of Alternatives
8.2.8. Other Forecast Factors
8.3. Value Chain
8.3.1. Raw Material Suppliers
8.3.2. Product Manufacturers
8.3.3. End Uses
8.4. COVID-19 Crisis – Impact Assessment
8.4.1. Current Statistics
8.4.2. Short-Mid-Long Term Outlook
8.4.3. Likely Rebound
8.5. Fine Chemical Market Dynamics
8.5.1. Drivers
8.5.2. Restraints
8.5.3. Opportunity Analysis
8.6. Europe Supply Demand Analysis
8.7. Porter’s Five Forces Analysis
8.8. Production Process Overview
8.9. Key Regulations and Certifications
8.10. Trade Scenarios
9. Europe Fine Chemical Market Analysis 2017 to 2021 and Forecast 2022 to 2032, by Product Type
9.1. Introduction / Key Findings
9.2. Historical Fine Chemical Market Size (US$ million) and Volume Analysis By Product Type, 2017 to 2021
9.3. Current and Future Fine Chemical Market Size (US$ million) and Volume Analysis and Forecast By Product Type, 2022 to 2032
9.3.1. Pharmaceuticals
9.3.2. Agrochemicals
9.3.3. Construction Chemicals
9.3.4. Additives
9.3.5. Specialty Polymers
9.3.6. Pigments and Dyes
9.3.7. Flavors and Fragrance Ingredients
9.3.8. Water Treatment Chemicals
9.3.9. Surfactants
9.3.10. Others
9.4. Fine Chemical Market Attractiveness Analysis By Product Type
10. Europe Fine Chemical Market Analysis 2017 to 2021 and Forecast 2022 to 2032, by Manufacturing Type
10.1. Introduction / Key Findings
10.2. Historical Fine Chemical Market Size (US$ million) and Volume Analysis By Manufacturing Type, 2017 to 2021
10.3. Current and Future Fine Chemical Market Size (US$ million) and Volume Analysis and Forecast By Manufacturing Type, 2022 to 2032
10.3.1. Captive
10.3.2. Merchant
10.4. Fine Chemical Market Attractiveness Analysis By Manufacturing Type
11. Europe Fine Chemical Market Analysis 2017 to 2021 and Forecast 2022 to 2032, by End Use
11.1. Introduction / Key Findings
11.2. Historical Fine Chemical Market Size (US$ million) and Volume Analysis By End Use, 2017 to 2021
11.3. Current and Future Fine Chemical Market Size (US$ million) and Volume Analysis and Forecast By End Use, 2022 to 2032
11.3.1. Pharmaceutical and Nutraceuticals
11.3.2. Agriculture Industry
11.3.3. Cosmetics and Personal Care
11.3.4. Petrochemicals and Plastic Industry
11.3.5. Food and Beverages
11.3.6. Electronics
11.3.7. Paints and Coatings
11.3.8. Building and Construction
11.3.9. Lubricants and Oil
11.3.10. Textiles
11.3.11. Others
11.4. Fine Chemical Market Attractiveness Analysis By End Use
12. Europe Fine Chemical Market Analysis 2017 to 2021 and Forecast 2022 to 2032, by Country
12.1. Introduction
12.2. Historical Fine Chemical Market Size (US$ million) and Volume Analysis By Country, 2017 to 2021
12.3. Current Fine Chemical Market Size (US$ million) and Volume Analysis and Forecast By Country, 2022 to 2032
12.3.1. Germany
12.3.2. Italy
12.3.3. France
12.3.4. United Kingdom
12.3.5. Spain
12.3.6. BENELUX
12.3.7. Russia
12.3.8. Rest of Europe
12.4. Fine Chemical Market Attractiveness Analysis by Country
13. Germany Fine Chemical Market Analysis 2017 to 2021 and Forecast 2022 to 2032
13.1. Introduction
13.2. Pricing Analysis
13.3. Historical Fine Chemical Market Size (US$ million) and Volume Trend Analysis By Fine Chemical Market Taxonomy, 2017 to 2021
13.4. Fine Chemical Market Size (US$ million) and Volume Forecast By Fine Chemical Market Taxonomy, 2022 to 2032
13.4.1. By Product Type
13.4.2. By Manufacturing Type
13.4.3. By End Use
13.5. Fine Chemical Market Attractiveness Analysis
13.5.1. By Product Type
13.5.2. By Manufacturing Type
13.5.3. By End Use
13.6. Fine Chemical Market Trends
13.7. Drivers and Restraints - Impact Analysis
14. Italy Fine Chemical Market Analysis 2017 to 2021 and Forecast 2022 to 2032
14.1. Introduction
14.2. Pricing Analysis
14.3. Historical Fine Chemical Market Size (US$ million) and Volume Trend Analysis By Fine Chemical Market Taxonomy, 2017 to 2021
14.4. Fine Chemical Market Size (US$ million) and Volume Forecast By Fine Chemical Market Taxonomy, 2022 to 2032
14.4.1. By Product Type
14.4.2. By Manufacturing Type
14.4.3. By End Use
14.5. Fine Chemical Market Attractiveness Analysis
14.5.1. By Product Type
14.5.2. By Manufacturing Type
14.5.3. By End Use
14.6. Fine Chemical Market Trends
14.7. Drivers and Restraints - Impact Analysis
15. France Fine Chemical Market Analysis 2017 to 2021 and Forecast 2022 to 2032
15.1. Introduction
15.2. Pricing Analysis
15.3. Historical Fine Chemical Market Size (US$ million) and Volume Trend Analysis By Fine Chemical Market Taxonomy, 2017 to 2021
15.4. Fine Chemical Market Size (US$ million) and Volume Forecast By Fine Chemical Market Taxonomy, 2022 to 2032
15.4.1. By Product Type
15.4.2. By Manufacturing Type
15.4.3. By End Use
15.5. Fine Chemical Market Attractiveness Analysis
15.5.1. By Product Type
15.5.2. By Manufacturing Type
15.5.3. By End Use
15.6. Fine Chemical Market Trends
15.7. Drivers and Restraints - Impact Analysis
16. United Kingdom Fine Chemical Market Analysis 2017 to 2021 and Forecast 2022 to 2032
16.1. Introduction
16.2. Pricing Analysis
16.3. Historical Fine Chemical Market Size (US$ million) and Volume Trend Analysis By Fine Chemical Market Taxonomy, 2017 to 2021
16.4. Fine Chemical Market Size (US$ million) and Volume Forecast By Fine Chemical Market Taxonomy, 2022 to 2032
16.4.1. By Product Type
16.4.2. By Manufacturing Type
16.4.3. By End Use
16.5. Fine Chemical Market Attractiveness Analysis
16.5.1. By Product Type
16.5.2. By Manufacturing Type
16.5.3. By End Use
16.6. Fine Chemical Market Trends
16.7. Drivers and Restraints - Impact Analysis
17. Spain Fine Chemical Market Analysis 2017 to 2021 and Forecast 2022 to 2032
17.1. Introduction
17.2. Pricing Analysis
17.3. Historical Fine Chemical Market Size (US$ million) and Volume Trend Analysis By Fine Chemical Market Taxonomy, 2017 to 2021
17.4. Fine Chemical Market Size (US$ million) and Volume Forecast By Fine Chemical Market Taxonomy, 2022 to 2032
17.4.1. By Product Type
17.4.2. By Manufacturing Type
17.4.3. By End Use
17.5. Fine Chemical Market Attractiveness Analysis
17.5.1. By Product Type
17.5.2. By Manufacturing Type
17.5.3. By End Use
17.6. Fine Chemical Market Trends
17.7. Drivers and Restraints - Impact Analysis
18. BENELUX Fine Chemical Market Analysis 2017 to 2021 and Forecast 2022 to 2032
18.1. Introduction
18.2. Pricing Analysis
18.3. Historical Fine Chemical Market Size (US$ million) and Volume Trend Analysis By Fine Chemical Market Taxonomy, 2017 to 2021
18.4. Fine Chemical Market Size (US$ million) and Volume Forecast By Fine Chemical Market Taxonomy, 2022 to 2032
18.4.1. By Product Type
18.4.2. By Manufacturing Type
18.4.3. By End Use
18.5. Fine Chemical Market Attractiveness Analysis
18.5.1. By Product Type
18.5.2. By Manufacturing Type
18.5.3. By End Use
18.6. Fine Chemical Market Trends
18.7. Drivers and Restraints - Impact Analysis
19. Russia Fine Chemical Market Analysis 2017 to 2021 and Forecast 2022 to 2032
19.1. Introduction
19.2. Pricing Analysis
19.3. Historical Fine Chemical Market Size (US$ million) and Volume Trend Analysis By Fine Chemical Market Taxonomy, 2017 to 2021
19.4. Fine Chemical Market Size (US$ million) and Volume Forecast By Fine Chemical Market Taxonomy, 2022 to 2032
19.4.1. By Product Type
19.4.2. By Manufacturing Type
19.4.3. By End Use
19.5. Fine Chemical Market Attractiveness Analysis
19.5.1. By Product Type
19.5.2. By Manufacturing Type
19.5.3. By End Use
19.6. Fine Chemical Market Trends
19.7. Drivers and Restraints - Impact Analysis
20. Rest of Europe Fine Chemical Market Analysis 2017 to 2021 and Forecast 2022 to 2032
20.1. Introduction
20.2. Pricing Analysis
20.3. Historical Fine Chemical Market Size (US$ million) and Volume Trend Analysis By Fine Chemical Market Taxonomy, 2017 to 2021
20.4. Fine Chemical Market Size (US$ million) and Volume Forecast By Fine Chemical Market Taxonomy, 2022 to 2032
20.4.1. By Product Type
20.4.2. By Manufacturing Type
20.4.3. By End Use
20.5. Fine Chemical Market Attractiveness Analysis
20.5.1. By Product Type
20.5.2. By Manufacturing Type
20.5.3. By End Use
20.6. Fine Chemical Market Trends
20.7. Drivers and Restraints - Impact Analysis
21. Fine Chemical Market Structure Analysis
21.1. Fine Chemical Market Analysis by Tier of Companies (Fine Chemicals)
21.2. Fine Chemical Market Share Analysis of Top Players
21.3. Fine Chemical Market Presence Analysis
21.3.1. By Regional footprint of Players
21.3.2. Product foot print of Players
22. Competition Analysis
22.1. Competition Dashboard
22.2. Competition Benchmarking
22.3. Competition Deep Dive
22.3.1. Sumitomo Chemicals
22.3.1.1. Overview
22.3.1.2. Product Portfolio
22.3.1.3. Sales Footprint
22.3.1.4. Strategy Overview
22.3.2. BASF SE
22.3.2.1. Overview
22.3.2.2. Product Portfolio
22.3.2.3. Sales Footprint
22.3.2.4. Strategy Overview
22.3.3. GlaxoSmithKline plc
22.3.3.1. Overview
22.3.3.2. Product Portfolio
22.3.3.3. Sales Footprint
22.3.3.4. Strategy Overview
22.3.4. Chemada Industries Ltd.
22.3.4.1. Overview
22.3.4.2. Product Portfolio
22.3.4.3. Sales Footprint
22.3.4.4. Strategy Overview
22.3.5. Syntor Fine Chemicals Ltd.
22.3.5.1. Overview
22.3.5.2. Product Portfolio
22.3.5.3. Sales Footprint
22.3.5.4. Strategy Overview
22.3.6. Lonza
22.3.6.1. Overview
22.3.6.2. Product Portfolio
22.3.6.3. Sales Footprint
22.3.6.4. Strategy Overview
22.3.7. Boehringer-Ingelheim International GmbH
22.3.7.1. Overview
22.3.7.2. Product Portfolio
22.3.7.3. Sales Footprint
22.3.7.4. Strategy Overview
22.3.8. Pfizer Inc
22.3.8.1. Overview
22.3.8.2. Product Portfolio
22.3.8.3. Sales Footprint
22.3.8.4. Strategy Overview
22.3.9. Johnson Matthey
22.3.9.1. Overview
22.3.9.2. Product Portfolio
22.3.9.3. Sales Footprint
22.3.9.4. Strategy Overview
22.3.10. Royal DSM N.V
22.3.10.1. Overview
22.3.10.2. Product Portfolio
22.3.10.3. Sales Footprint
22.3.10.4. Strategy Overview
22.3.11. Merck and Co.
22.3.11.1. Overview
22.3.11.2. Product Portfolio
22.3.11.3. Sales Footprint
22.3.11.4. Strategy Overview
22.3.12. Lanxess
22.3.12.1. Overview
22.3.12.2. Product Portfolio
22.3.12.3. Sales Footprint
22.3.12.4. Strategy Overview
22.3.13. Albemarle Corporation
22.3.13.1. Overview
22.3.13.2. Product Portfolio
22.3.13.3. Sales Footprint
22.3.13.4. Strategy Overview
22.3.14. Weylchem International GMBH
22.3.14.1. Overview
22.3.14.2. Product Portfolio
22.3.14.3. Sales Footprint
22.3.14.4. Strategy Overview
22.3.15. Novartis International AG
22.3.15.1. Overview
22.3.15.2. Product Portfolio
22.3.15.3. Sales Footprint
22.3.15.4. Strategy Overview
22.3.16. Borregaard AS
22.3.16.1. Overview
22.3.16.2. Product Portfolio
22.3.16.3. Sales Footprint
22.3.16.4. Strategy Overview
22.3.17. Solvay SA
22.3.17.1. Overview
22.3.17.2. Product Portfolio
22.3.17.3. Sales Footprint
22.3.17.4. Strategy Overview
22.3.18. Evonik Industries AG
22.3.18.1. Overview
22.3.18.2. Product Portfolio
22.3.18.3. Sales Footprint
22.3.18.4. Strategy Overview
22.3.19. Toray Fine Chemicals Co. Ltd
22.3.19.1. Overview
22.3.19.2. Product Portfolio
22.3.19.3. Sales Footprint
22.3.19.4. Strategy Overview
22.3.20. Nippon Fine Chemical Co. Ltd
22.3.20.1. Overview
22.3.20.2. Product Portfolio
22.3.20.3. Sales Footprint
22.3.20.4. Strategy Overview
22.3.21. NOURYON
22.3.21.1. Overview
22.3.21.2. Product Portfolio
22.3.21.3. Sales Footprint
22.3.21.4. Strategy Overview
22.3.22. HUNTSMAN INTERNATIONAL LLC
22.3.22.1. Overview
22.3.22.2. Product Portfolio
22.3.22.3. Sales Footprint
22.3.22.4. Strategy Overview
22.3.23. CLARIANT AG
22.3.23.1. Overview
22.3.23.2. Product Portfolio
22.3.23.3. Sales Footprint
22.3.23.4. Strategy Overview
22.3.24. BAYER AG
22.3.24.1. Overview
22.3.24.2. Product Portfolio
22.3.24.3. Sales Footprint
22.3.24.4. Strategy Overview
22.3.25. Ashland Global Holdings Inc.
22.3.25.1. Overview
22.3.25.2. Product Portfolio
22.3.25.3. Sales Footprint
22.3.25.4. Strategy Overview
23. Assumptions and Acronyms Used
24. Research Methodology
Let us know your requirement to get
100% FREE customization
List of Tables
Table 01: Europe Market Size (US$ Million) Analysis and Forecast By Product Type, 2017 to 2032
Table 02: Europe Market Size (US$ Million) Analysis and Forecast By Product Type, 2017 to 2032
Table 03: Europe Market Size Volume (Tons) Analysis and Forecast By Product Type, 2017 to 2032
Table 04: Europe Market Size Volume (Tons) Analysis and Forecast By Product Type, 2017 to 2032
Table 05: Europe Market Size Volume (Tons) Analysis and Forecast By Product Type, 2017 to 2032
Table 06: Europe Market Size (US$ Million) and Volume (Tons) Analysis and Forecast By Manufacturing Type, 2017 to 2032
Table 07: Europe Market Size (US$ Million) and Volume (Tons) Analysis and Forecast By End Use, 2017 to 2032
Table 08: Europe Market Size (US$ Million) and Volume (Tons) Analysis and Forecast By End Use, 2017 to 2032
Table 09: Europe Market Size (US$ Million) and Volume (Tons) Analysis and Forecast By Country, 2017 to 2032
Table 10: Germany Market Size (US$ Million) Analysis and Forecast By Product Type, 2017 to 2032
Table 11: Germany Market Size (US$ Million) Analysis and Forecast By Product Type, 2017 to 2032
Table 12: Germany Market Size Volume (Tons) Analysis and Forecast By Product Type, 2017 to 2032
Table 13: Germany Market Size Volume (Tons) Analysis and Forecast By Product Type, 2017 to 2032
Table 14: Germany Market Size Volume (Tons) Analysis and Forecast By Product Type, 2017 to 2032
Table 15: Germany Market Size (US$ Million) and Volume (Tons) Analysis and Forecast By Manufacturing Type, 2017 to 2032
Table 16: Germany Market Size (US$ Million) and Volume (Tons) Analysis and Forecast By End Use, 2017 to 2032
Table 17: Germany Market Size (US$ Million) and Volume (Tons) Analysis and Forecast By End Use, 2017 to 2032
Table 18: France Market Size (US$ Million) Analysis and Forecast By Product Type, 2017 to 2032
Table 19: France Market Size (US$ Million) Analysis and Forecast By Product Type, 2017 to 2032
Table 20: France Market Size Volume (Tons) Analysis and Forecast By Product Type, 2017 to 2032
Table 21: France Market Size Volume (Tons) Analysis and Forecast By Product Type, 2017 to 2032
Table 22: France Market Size Volume (Tons) Analysis and Forecast By Product Type, 2017 to 2032
Table 23: France Market Size (US$ Million) and Volume (Tons) Analysis and Forecast By Manufacturing Type, 2017 to 2032
Table 24: France Market Size (US$ Million) and Volume (Tons) Analysis and Forecast By End Use, 2017 to 2032
Table 25: France Market Size (US$ Million) and Volume (Tons) Analysis and Forecast By End Use, 2017 to 2032
Table 26: Italy Market Size (US$ Million) Analysis and Forecast By Product Type, 2017 to 2032
Table 27: Italy Market Size (US$ Million) Analysis and Forecast By Product Type, 2017 to 2032
Table 28: Italy Market Size Volume (Tons) Analysis and Forecast By Product Type, 2017 to 2032
Table 29: Italy Market Size Volume (Tons) Analysis and Forecast By Product Type, 2017 to 2032
Table 30: Italy Market Size Volume (Tons) Analysis and Forecast By Product Type, 2017 to 2032
Table 31: Italy Market Size (US$ Million) and Volume (Tons) Analysis and Forecast By Manufacturing Type, 2017 to 2032
Table 32: Italy Market Size (US$ Million) and Volume (Tons) Analysis and Forecast By End Use, 2017 to 2032
Table 33: Italy Market Size (US$ Million) and Volume (Tons) Analysis and Forecast By End Use, 2017 to 2032
Table 34: United Kingdom Market Size (US$ Million) Analysis and Forecast By Product Type, 2017 to 2032
Table 35: United Kingdom Market Size (US$ Million) Analysis and Forecast By Product Type, 2017 to 2032
Table 36: United Kingdom Market Size Volume (Tons) Analysis and Forecast By Product Type, 2017 to 2032
Table 37: United Kingdom Market Size Volume (Tons) Analysis and Forecast By Product Type, 2017 to 2032
Table 38: United Kingdom Market Size Volume (Tons) Analysis and Forecast By Product Type, 2017 to 2032
Table 39: United Kingdom Market Size (US$ Million) and Volume (Tons) Analysis and Forecast By Manufacturing Type, 2017 to 2032
Table 40: United Kingdom Market Size (US$ Million) and Volume (Tons) Analysis and Forecast By End Use, 2017 to 2032
Table 41: United Kingdom Market Size (US$ Million) and Volume (Tons) Analysis and Forecast By End Use, 2017 to 2032
Table 42: Spain Market Size (US$ Million) Analysis and Forecast By Product Type, 2017 to 2032
Table 43: Spain Market Size (US$ Million) Analysis and Forecast By Product Type, 2017 to 2032
Table 44: Spain Market Size Volume (Tons) Analysis and Forecast By Product Type, 2017 to 2032
Table 45: Spain Market Size Volume (Tons) Analysis and Forecast By Product Type, 2017 to 2032
Table 46: Spain Market Size Volume (Tons) Analysis and Forecast By Product Type, 2017 to 2032
Table 47: Spain Market Size (US$ Million) and Volume (Tons) Analysis and Forecast By Manufacturing Type, 2017 to 2032
Table 48: Spain Market Size (US$ Million) and Volume (Tons) Analysis and Forecast By End Use, 2017 to 2032
Table 49: Spain Market Size (US$ Million) and Volume (Tons) Analysis and Forecast By End Use, 2017 to 2032
Table 50: Europe Market Size (US$ Million) Analysis and Forecast By Product Type, 2017 to 2032
Table 51: Europe Market Size (US$ Million) Analysis and Forecast By Product Type, 2017 to 2032
Table 52: BENELUX Market Size Volume (Tons) Analysis and Forecast By Product Type, 2017 to 2032
Table 53: BENELUX Market Size Volume (Tons) Analysis and Forecast By Product Type, 2017 to 2032
Table 54: BENELUX Market Size Volume (Tons) Analysis and Forecast By Product Type, 2017 to 2032
Table 55: BENELUX Market Size (US$ Million) and Volume (Tons) Analysis and Forecast By Manufacturing Type, 2017 to 2032
Table 56: BENELUX Market Size (US$ Million) and Volume (Tons) Analysis and Forecast By End Use, 2017 to 2032
Table 57: BENELUX Market Size (US$ Million) and Volume (Tons) Analysis and Forecast By End Use, 2017 to 2032
Table 58: Russia Market Size (US$ Million) Analysis and Forecast By Product Type, 2017 to 2032
Table 59: Russia Market Size (US$ Million) Analysis and Forecast By Product Type, 2017 to 2032
Table 60: Russia Market Size Volume (Tons) Analysis and Forecast By Product Type, 2017 to 2032
Table 61: Russia Market Size Volume (Tons) Analysis and Forecast By Product Type, 2017 to 2032
Table 62: Russia Market Size Volume (Tons) Analysis and Forecast By Product Type, 2017 to 2032
Table 63: Russia Market Size (US$ Million) and Volume (Tons) Analysis and Forecast By Manufacturing Type, 2017 to 2032
Table 64: Russia Market Size (US$ Million) and Volume (Tons) Analysis and Forecast By End Use, 2017 to 2032
Table 65: Russia Market Size (US$ Million) and Volume (Tons) Analysis and Forecast By End Use, 2017 to 2032
Table 65: Rest of Europe Market Size (US$ Million) Analysis and Forecast By Product Type, 2017 to 2032
Table 66: Rest of Europe Market Size (US$ Million) Analysis and Forecast By Product Type, 2017 to 2032
Table 67: Rest of Europe Market Size Volume (Tons) Analysis and Forecast By Product Type, 2017 to 2032
Table 68: Rest of Europe Market Size Volume (Tons) Analysis and Forecast By Product Type, 2017 to 2032
Table 69: Rest of Europe Market Size Volume (Tons) Analysis and Forecast By Product Type, 2017 to 2032
Table 70: Rest of Europe Market Size (US$ Million) and Volume (Tons) Analysis and Forecast By Manufacturing Type, 2017 to 2032
Table 71: Rest of Europe Market Size (US$ Million) and Volume (Tons) Analysis and Forecast By End Use, 2017 to 2032
Table 72: Rest of Europe Market Size (US$ Million) and Volume (Tons) Analysis and Forecast By End Use, 2017 to 2032
Find your sweet spots for generating winning opportunities in this market.
Talk to AnalystList of Charts
Figure 01: Europe Market Historical Volume (Tons), 2017 to 2021
Figure 02: Europe Market Current and Forecast Volume (Tons), 2022 to 2032
Figure 03: Europe Market Historical Value (US$ Million), 2017 to 2021
Figure 04: Europe Market Current and Forecast Value (US$ Million), 2022 to 2032
Figure 05: Europe Market Incremental $ Opportunity (US$ Million), 2022 to 2032
Figure 06: Europe Market Share and BPS Analysis By Product Type, 2022 & 2032
Figure 07: Europe Market Y-o-Y Growth Projections By Product Type, 2022 to 2032
Figure 08: Europe Market Attractiveness Analysis By Product Type, 2022 to 2032
Figure 09: Europe Market Absolute $ Opportunity by Pharmaceuticals Segment, 2017 to 2032
Figure 10: Europe Market Absolute $ Opportunity by Agrochemicals Segment, 2017 to 2032
Figure 11: Europe Market Absolute $ Opportunity by Construction Chemicals Segment, 2017 to 2032
Figure 12: Europe Market Absolute $ Opportunity by Additives Segment, 2017 to 2032
Figure 13: Europe Market Absolute $ Opportunity by Specialty Polymers Segment, 2017 to 2032
Figure 14: Europe Market Absolute $ Opportunity by Pigments & Dyes Segment, 2017 to 2032
Figure 15: Europe Market Absolute $ Opportunity by Flavors & Fragrance Ingredients Segment, 2017 to 2032
Figure 16: Europe Market Absolute $ Opportunity by Water Treatment Chemicals Segment, 2017 to 2032
Figure 17: Europe Market Absolute $ Opportunity by Surfactants Segment, 2017 to 2032
Figure 18: Europe Market Absolute $ Opportunity by Others Segment, 2017 to 2032
Figure 19: Europe Market Share and BPS Analysis By Manufacturing Type, 2022 & 2032
Figure 20: Europe Market Y-o-Y Growth Projections By Manufacturing Type, 2022 to 2032
Figure 21: Europe Market Attractiveness Analysis By Manufacturing Type, 2022 to 2032
Figure 22: Europe Market Absolute $ Opportunity by Captive Segment, 2017 to 2032
Figure 23: Europe Market Absolute $ Opportunity by Merchant Segment, 2017 to 2032
Figure 24: Europe Market Share and BPS Analysis By End Use, 2022 & 2032
Figure 25: Europe Market Y-o-Y Growth Projections By End Use, 2022 to 2032
Figure 26: Europe Market Attractiveness Analysis By End Use, 2022 to 2032
Figure 27: Europe Market Absolute $ Opportunity by Pharmaceuticals & Nutraceuticals Segment, 2017 to 2032
Figure 28: Europe Market Absolute $ Opportunity by Agriculture Industry Segment, 2017 to 2032
Figure 29: Europe Market Absolute $ Opportunity by Cosmetics & Personal Care Segment, 2017 to 2032
Figure 30: Europe Market Absolute $ Opportunity by Petrochemicals & Plastic Industry Segment, 2017 to 2032
Figure 31: Europe Market Absolute $ Opportunity by Food & Beverages Segment, 2017 to 2032
Figure 32: Europe Market Absolute $ Opportunity by Electronics Segment, 2017 to 2032
Figure 33: Europe Market Absolute $ Opportunity by Paints & Coatings Segment, 2017 to 2032
Figure 34: Europe Market Absolute $ Opportunity by Building & Construction Segment, 2017 to 2032
Figure 35: Europe Market Absolute $ Opportunity by Lubricants & Oil Segment, 2017 to 2032
Figure 36: Europe Market Absolute $ Opportunity by Textiles Segment, 2017 to 2032
Figure 37: Europe Market Absolute $ Opportunity by Others Segment, 2017 to 2032
Figure 38: Europe Market Share and BPS Analysis By Country, 2022 & 2032
Figure 39: Europe Market Y-o-Y Growth Projections By Country, 2022 to 2032
Figure 40: Europe Market Attractiveness Analysis By Country, 2022 to 2032
Figure 41: Europe Market Absolute $ Opportunity by Germany Segment, 2017 to 2032
Figure 42: Europe Market Absolute $ Opportunity by Italy Segment, 2017 to 2032
Figure 43: Europe Market Absolute $ Opportunity by France Segment, 2017 to 2032
Figure 44: Europe Market Absolute $ Opportunity by United Kingdom Segment, 2017 to 2032
Figure 45: Europe Market Absolute $ Opportunity by Spain Segment, 2017 to 2032
Figure 46: Europe Market Absolute $ Opportunity by BENELUX Segment, 2017 to 2032
Figure 47: Europe Market Absolute $ Opportunity by Russia Segment, 2017 to 2032
Figure 48: Europe Market Absolute $ Opportunity by Rest of Europe Segment, 2017 to 2032
Figure 49: Germany Market Share and BPS Analysis By Product Type, 2022 & 2032
Figure 50: Germany Market Y-o-Y Growth Projections By Product Type, 2022 to 2032
Figure 51: Germany Market Attractiveness Analysis By Product Type, 2022 to 2032
Figure 52: Germany Market Share and BPS Analysis By Manufacturing Type, 2022 & 2032
Figure 53: Germany Market Y-o-Y Growth Projections By Manufacturing Type, 2022 to 2032
Figure 54: Germany Market Attractiveness Analysis By Manufacturing Type, 2022 to 2032
Figure 55: Germany Market Share and BPS Analysis By End Use, 2022 & 2032
Figure 56: Germany Market Y-o-Y Growth Projections By End Use, 2022 to 2032
Figure 57: Germany Market Attractiveness Analysis By End Use, 2022 to 2032
Figure 58: France Market Share and BPS Analysis By Product Type, 2022 & 2032
Figure 59: France Market Y-o-Y Growth Projections By Product Type, 2022 to 2032
Figure 60: France Market Attractiveness Analysis By Product Type, 2022 to 2032
Figure 61: France Market Share and BPS Analysis By Manufacturing Type, 2022 & 2032
Figure 62: France Market Y-o-Y Growth Projections By Manufacturing Type, 2022 to 2032
Figure 63: France Market Attractiveness Analysis By Manufacturing Type, 2022 to 2032
Figure 64: France Market Share and BPS Analysis By End Use, 2022 & 2032
Figure 65: France Market Y-o-Y Growth Projections By End Use, 2022 to 2032
Figure 66: France Market Attractiveness Analysis By End Use, 2022 to 2032
Figure 67: Italy Market Share and BPS Analysis By Product Type, 2022 & 2032
Figure 68: Italy Market Y-o-Y Growth Projections By Product Type, 2022 to 2032
Figure 69: Italy Market Attractiveness Analysis By Product Type, 2022 to 2032
Figure 70: Italy Market Share and BPS Analysis By Manufacturing Type, 2022 & 2032
Figure 71: Italy Market Y-o-Y Growth Projections By Manufacturing Type, 2022 to 2032
Figure 72: Italy Market Attractiveness Analysis By Manufacturing Type, 2022 to 2032
Figure 73: Italy Market Share and BPS Analysis By End Use, 2022 & 2032
Figure 74: Italy Market Y-o-Y Growth Projections By End Use, 2022 to 2032
Figure 75: Italy Market Attractiveness Analysis By End Use, 2022 to 2032
Figure 76: United Kingdom Market Share and BPS Analysis By Product Type, 2022 & 2032
Figure 77: United Kingdom Market Y-o-Y Growth Projections By Product Type, 2022 to 2032
Figure 78: United Kingdom Market Attractiveness Analysis By Product Type, 2022 to 2032
Figure 79: United Kingdom Market Share and BPS Analysis By Manufacturing Type, 2022 & 2032
Figure 80: United Kingdom Market Y-o-Y Growth Projections By Manufacturing Type, 2022 to 2032
Figure 81: United Kingdom Market Attractiveness Analysis By Manufacturing Type, 2022 to 2032
Figure 82: United Kingdom Market Share and BPS Analysis By End Use, 2022 & 2032
Figure 83: United Kingdom Market Y-o-Y Growth Projections By End Use, 2022 to 2032
Figure 84: United Kingdom Market Attractiveness Analysis By End Use, 2022 to 2032
Figure 85: Spain Market Share and BPS Analysis By Product Type, 2022 & 2032
Figure 86: Spain Market Y-o-Y Growth Projections By Product Type, 2022 to 2032
Figure 87: Spain Market Attractiveness Analysis By Product Type, 2022 to 2032
Figure 88: Spain Market Share and BPS Analysis By Manufacturing Type, 2022 & 2032
Figure 89: Spain Market Y-o-Y Growth Projections By Manufacturing Type, 2022 to 2032
Figure 90: Spain Market Attractiveness Analysis By Manufacturing Type, 2022 to 2032
Figure 91: Spain Market Share and BPS Analysis By End Use, 2022 & 2032
Figure 92: Spain Market Y-o-Y Growth Projections By End Use, 2022 to 2032
Figure 93: Spain Market Attractiveness Analysis By End Use, 2022 to 2032
Figure 94: BENELUX Market Share and BPS Analysis By Product Type, 2022 & 2032
Figure 95: BENELUX Market Y-o-Y Growth Projections By Product Type, 2022 to 2032
Figure 96: BENELUX Market Attractiveness Analysis By Product Type, 2022 to 2032
Figure 97: BENELUX Market Share and BPS Analysis By Manufacturing Type, 2022 & 2032
Figure 98: BENELUX Market Y-o-Y Growth Projections By Manufacturing Type, 2022 to 2032
Figure 99: BENELUX Market Attractiveness Analysis By Manufacturing Type, 2022 to 2032
Figure 100: BENELUX Market Share and BPS Analysis By End Use, 2022 & 2032
Figure 101: BENELUX Market Y-o-Y Growth Projections By End Use, 2022 to 2032
Figure 102: BENELUX Market Attractiveness Analysis By End Use, 2022 to 2032
Figure 103: Russia Market Share and BPS Analysis By Product Type, 2022 & 2032
Figure 104: Russia Market Y-o-Y Growth Projections By Product Type, 2022 to 2032
Figure 105: Russia Market Attractiveness Analysis By Product Type, 2022 to 2032
Figure 106: Russia Market Share and BPS Analysis By Manufacturing Type, 2022 & 2032
Figure 107: Russia Market Y-o-Y Growth Projections By Manufacturing Type, 2022 to 2032
Figure 108: Russia Market Attractiveness Analysis By Manufacturing Type, 2022 to 2032
Figure 109: Russia Market Share and BPS Analysis By End Use, 2022 & 2032
Figure 110: Russia Market Y-o-Y Growth Projections By End Use, 2022 to 2032
Figure 111: Russia Market Attractiveness Analysis By End Use, 2022 to 2032
Figure 112: Rest of Europe Market Share and BPS Analysis By Product Type, 2022 & 2032
Figure 113: Rest of Europe Market Y-o-Y Growth Projections By Product Type, 2022 to 2032
Figure 114: Rest of Europe Market Attractiveness Analysis By Product Type, 2022 to 2032
Figure 115: Rest of Europe Market Share and BPS Analysis By Manufacturing Type, 2022 & 2032
Figure 116: Rest of Europe Market Y-o-Y Growth Projections By Manufacturing Type, 2022 to 2032
Figure 117: Rest of Europe Market Attractiveness Analysis By Manufacturing Type, 2022 to 2032
Figure 118: Rest of Europe Market Share and BPS Analysis By End Use, 2022 & 2032
Figure 119: Rest of Europe Market Y-o-Y Growth Projections By End Use, 2022 to 2032
Figure 120: Rest of Europe Market Attractiveness Analysis By End Use, 2022 to 2032
Need specific information?
Request CustomizationExplore Chemicals & Materials Insights
View Reports