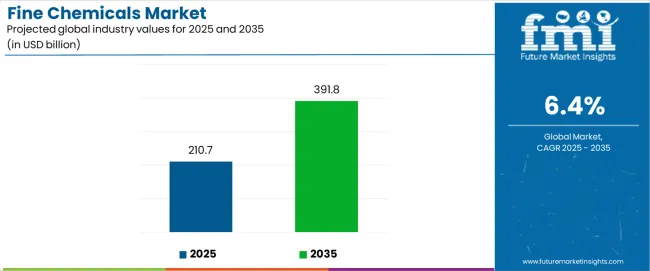
The fine chemicals market is valued at USD 210.7 billion in 2025 and is projected to reach USD 391.8 billion by 2035, advancing at a CAGR of 6.4%. Growth is driven by the rising need for high-purity intermediates across pharmaceuticals, agrochemicals, and electronics manufacturing, where precision synthesis, stringent quality control, and regulatory compliance define competitive capabilities.
Pharmaceutical fine chemicals, spanning APIs, intermediates, and specialty excipients, represent the largest share due to expanding biologics, generic drug manufacturing, and complex molecule development. Captive production leads with 60% share, reflecting drug manufacturers’ preference for in-house quality assurance and supply security, while merchant producers support specialized synthesis demand. Pharmaceuticals & nutraceuticals form the dominant application, followed by agrochemicals and electronics requiring ultra-high-purity chemicals for semiconductor fabrication.
Regionally, India, the USA, and China drive growth through strong pharmaceutical clusters, biotechnology expansion, and electronics manufacturing, while Europe maintains steady demand supported by Germany’s advanced chemical infrastructure. Competitive intensity remains moderate, with BASF SE, Lonza Group, and Evonik Industries AG focusing on GMP-grade production, continuous manufacturing, and green chemistry innovation to strengthen global positioning.
One of the strongest dynamics driving market behavior is the growing emphasis on precision chemistry. As industries move away from broad, multi-use chemical intermediates toward highly specific molecular structures, the demand for fine chemicals that meet narrow purity specifications and tight impurity control continues to intensify. This shift is particularly strong in pharmaceuticals, where drug molecules are becoming more structurally intricate, often requiring multi-step synthesis pathways that depend heavily on advanced intermediates and custom-designed molecular fragments. This complexity increases the reliance on fine chemical manufacturers capable of supporting tailored synthesis rather than catalog-based offerings.
Regulatory pressure shapes another defining dynamic. Fine chemical producers supplying pharmaceutical, food, or electronic materials must adhere to stringent international standards governing traceability, impurity profiling, solvent use, and manufacturing validation. Compliance with cGMP, REACH, and other region-specific regulations significantly influences technology adoption, facility design, and supplier qualification criteria. Companies that fail to meet these expectations find it increasingly difficult to access high-value application areas.
Competitive dynamics are increasingly defined by innovation capacity rather than production volume. Companies investing in flow chemistry, enzyme-catalyzed synthesis, organometallic reactions, and advanced purification technologies are positioning themselves at the high-value end of the market. Partnerships between fine chemical manufacturers and end-use industries are also accelerating, allowing faster scale-up of new molecules and reducing time-to-market for high-value intermediates.
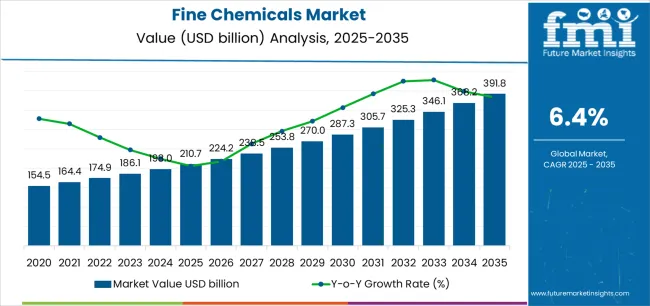
Between 2025 and 2030, the fine chemicals market is projected to expand from USD 210.7 billion to USD 288.5 billion, resulting in a value increase of USD 77.8 billion, which represents 42.9% of the total forecast growth for the decade. This phase of development will be shaped by rising demand for pharmaceutical intermediates and active pharmaceutical ingredients, product innovation in green chemistry and bio-based synthesis technologies, as well as expanding integration with biotechnology platforms and precision manufacturing systems. Companies are establishing competitive positions through investment in sustainable production processes, high-purity manufacturing capabilities, and strategic market expansion across pharmaceutical, agrochemical, and electronics applications.
From 2030 to 2035, the market is forecast to grow from USD 288.5 billion to USD 391.8 billion, adding another USD 103.4 billion, which constitutes 57.1% of the overall ten-year expansion. This period is expected to be characterized by the expansion of specialized fine chemical production for advanced pharmaceuticals, including biologics and personalized medicine intermediates, strategic collaborations between pharmaceutical companies and fine chemical manufacturers, and an enhanced focus on circular economy principles and zero-waste manufacturing processes. The growing emphasis on sustainable chemistry practices and advanced purification technologies will drive demand for high-performance fine chemical solutions across diverse industrial applications.
| Metric | Value |
|---|---|
| Market Value (2025) | USD 210.7 billion |
| Market Forecast Value (2035) | USD 391.8 billion |
| Forecast CAGR (2025 to 2035) | 6.4% |
The fine chemicals market grows by enabling pharmaceutical, agrochemical, and electronics manufacturers to access high-purity chemical intermediates essential for complex product formulations and advanced manufacturing processes. Pharmaceutical companies face mounting pressure to accelerate drug development and ensure consistent API quality, with fine chemicals providing the critical building blocks for generic drugs, biologics, and specialty therapeutics that meet stringent regulatory standards. The biotechnology sector's expansion creates demand for specialized intermediates supporting cell culture media, enzyme production, and biopharmaceutical manufacturing, while electronics manufacturers require ultra-high-purity chemicals for semiconductor fabrication and advanced materials processing.
Government initiatives promoting domestic pharmaceutical manufacturing and agrochemical self-sufficiency drive adoption across emerging markets, where local production capabilities reduce import dependencies and support supply chain resilience. Sustainability mandates and green chemistry regulations encourage adoption of bio-based fine chemicals and environmentally friendly synthesis routes, creating differentiation opportunities for manufacturers investing in sustainable production technologies. However, complex regulatory approval processes for pharmaceutical-grade chemicals and high capital requirements for achieving GMP compliance may limit market entry for smaller manufacturers and developing regions with limited technical infrastructure.
The market is segmented by product type, manufacturing type, application, and region. By product type, the market is divided into pharmaceuticals, agrochemicals, specialty polymers, pigments & dyes, flavors & fragrances, and others. Based on manufacturing type, the market is categorized into captive and merchant production. By application, the market includes pharmaceuticals & nutraceuticals, agrochemicals, electronics, cosmetics & personal care, food & beverages, and other applications. Regionally, the market is divided into Asia Pacific, North America, Europe, and other key regions.
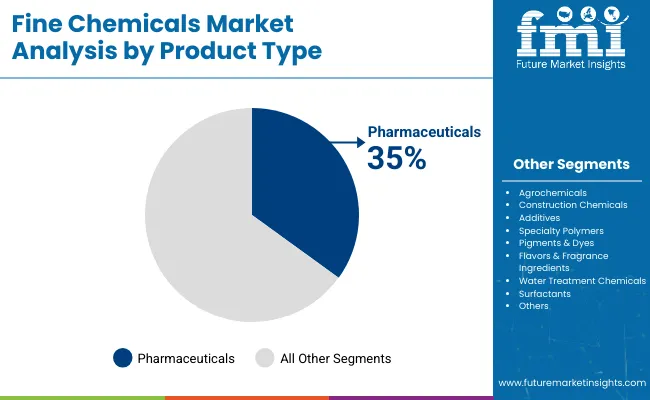
The pharmaceuticals segment represents the dominant force in the fine chemicals market, capturing approximately 35% of total market share in 2025. This advanced category encompasses active pharmaceutical ingredients, pharmaceutical intermediates, excipients, and specialty compounds essential for drug formulation and therapeutic development. The pharmaceuticals segment's market leadership stems from continuous drug innovation, generic drug expansion, and biologics manufacturing growth requiring specialized chemical intermediates with exceptional purity standards exceeding 99.5% and comprehensive regulatory documentation.
The agrochemicals segment maintains a substantial 20% market share, serving manufacturers requiring pesticides, herbicides, fungicides, and plant growth regulators that support global food security initiatives. Specialty polymers account for 12% market share through high-performance materials applications, while pigments & dyes capture 10% serving textile, coating, and printing industries.
Key factors driving the pharmaceuticals segment include:
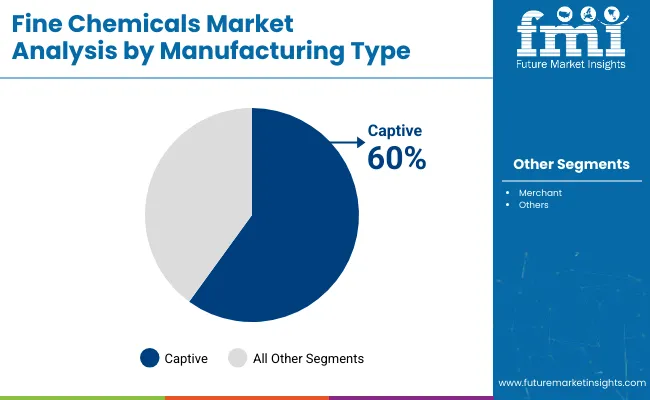
Captive manufacturing dominates the fine chemicals market with approximately 60% market share in 2025, reflecting pharmaceutical and chemical companies' strategic preference for in-house production of critical intermediates to ensure supply security, intellectual property protection, and quality control oversight. The captive segment's market leadership is reinforced by major pharmaceutical manufacturers maintaining dedicated fine chemical facilities integrated with drug development programs, enabling rapid formulation adjustments and proprietary process optimization.
The merchant manufacturing segment represents 40% market share, serving companies requiring specialized synthesis capabilities, capacity flexibility, or access to niche chemical expertise without capital-intensive facility investments. This segment benefits from contract manufacturing organizations providing comprehensive services including process development, scale-up support, and regulatory documentation assistance.
Key market dynamics supporting manufacturing type trends include:
Pharmaceuticals & nutraceuticals applications dominate the fine chemicals market with approximately 38% market share in 2025, reflecting the critical role of high-purity intermediates in drug manufacturing, dietary supplement production, and functional food ingredient synthesis. The pharmaceuticals & nutraceuticals segment's market leadership is supported by accelerating drug approvals, aging population demographics driving medication consumption, and rising health consciousness fueling nutraceutical demand.
The agrochemicals segment represents the second-largest application category, capturing 20% market share through global food production requirements and integrated pest management systems. Electronics applications account for 12% market share serving semiconductor manufacturing, display technologies, and electronic materials production requiring ultra-high-purity chemicals.
Key market dynamics supporting application growth include:
The market is driven by three concrete demand factors tied to industrial manufacturing requirements. First, pharmaceutical industry expansion and drug development acceleration create increasing demand for high-purity intermediates, with global pharmaceutical production projected to grow by 5-7% annually in major markets worldwide, requiring specialized fine chemical synthesis for generic drugs, biologics, and specialty therapeutics. Second, agrochemical sector growth driven by food security imperatives and sustainable agriculture adoption drives demand for advanced pesticide intermediates, with precision agriculture technologies requiring sophisticated chemical formulations for targeted pest control and crop enhancement. Third, electronics industry advancement, particularly semiconductor manufacturing expansion, creates demand for ultra-high-purity chemicals meeting stringent contamination specifications below 1 ppb for critical fabrication processes.
Market restraints include stringent regulatory compliance requirements that create barriers to market entry, particularly GMP certification processes requiring multi-million-dollar facility investments and extensive documentation systems for pharmaceutical-grade production. Raw material supply chain vulnerabilities pose challenges, as specialized starting materials often face limited sourcing options and price volatility affecting production economics and delivery schedules. Environmental regulations and sustainability pressures create additional complexity for manufacturers, demanding ongoing investment in waste reduction technologies, solvent recovery systems, and green chemistry process development to meet evolving ecological standards and customer expectations.
Key trends indicate accelerated adoption of continuous manufacturing technologies replacing traditional batch processes, enabling improved efficiency, quality consistency, and environmental performance through real-time process control and reduced solvent consumption. Biotechnology integration advances rapidly, with biocatalysis and fermentation-based synthesis routes offering sustainable alternatives to traditional chemical synthesis for complex molecule production. Strategic consolidation activity increases as major chemical companies acquire specialized fine chemical manufacturers to expand product portfolios and capture value chain integration benefits. However, the market thesis could face disruption if synthetic biology platforms enable pharmaceutical companies to produce complex molecules through engineered organisms, potentially reducing dependence on traditional fine chemical suppliers for certain intermediate categories.
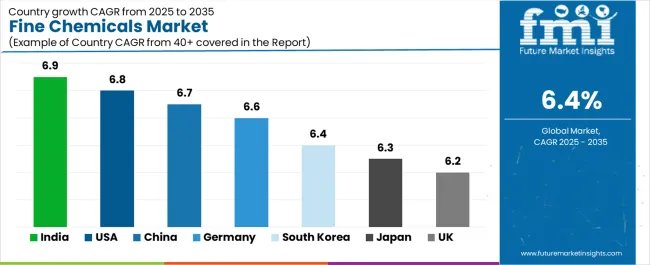
| Country | CAGR (2025-2035) |
|---|---|
| India | 6.9% |
| USA | 6.8% |
| China | 6.7% |
| Germany | 6.6% |
| South Korea | 6.4% |
| Japan | 6.3% |
| UK | 6.2% |
The fine chemicals market is gaining momentum worldwide, with India taking the lead thanks to rapidly expanding pharmaceutical generics manufacturing and government initiatives supporting domestic chemical production capabilities. Close behind, the USA benefits from its large pharmaceutical and biotechnology base, advanced R&D infrastructure, and strong demand for semiconductor-grade fine chemicals, positioning itself as a technology innovation hub. China shows robust advancement, where massive pharmaceutical intermediates exports and electronics industry growth strengthen its role in global fine chemical supply chains. Germany maintains steady progress through its established chemicals manufacturing infrastructure and leadership in green chemistry development. Meanwhile, South Korea stands out for its semiconductor industry requirements and biotech expansion, and Japan and the UK continue to record consistent progress in high-purity chemical production for advanced applications. Together, India, USA, and China anchor the global expansion story, while the rest build stability and diversity into the market's growth path.
The report covers an in-depth analysis of 40+ countries, the top-performing countries are highlighted below.
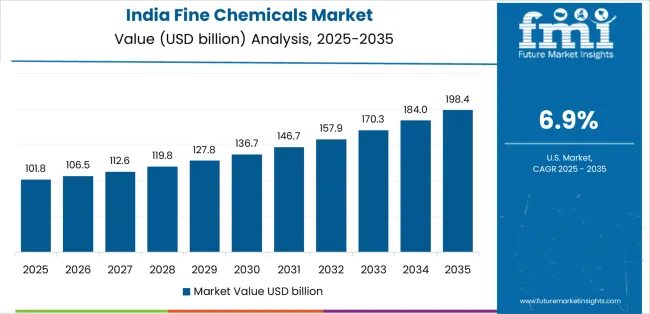
India demonstrates the strongest growth potential in the Fine Chemicals Market with a CAGR of 6.9% through 2035. The country's leadership position stems from its established pharmaceutical generics industry, government Make in India initiatives encouraging domestic manufacturing, and aggressive capacity expansion by both domestic and multinational pharmaceutical companies, driving adoption of advanced fine chemical production facilities. Growth is concentrated in major pharmaceutical clusters, including Hyderabad, Ahmedabad, Mumbai, and Vadodara, where API manufacturers and pharmaceutical companies are implementing state-of-the-art synthesis capabilities for enhanced product quality and international regulatory compliance. Distribution channels through established pharmaceutical supply chains and chemical distributors expand deployment across drug manufacturing facilities and contract manufacturing organizations. The country's National Pharmaceutical Pricing Authority and Quality Council of India provide regulatory support for pharmaceutical-grade chemical production, including GMP certification programs.
Key market factors:
The USA market leads in advanced fine chemical development based on integration with biopharmaceutical manufacturing, precision medicine applications, and semiconductor industry requirements for ultra-high-purity chemicals. The country shows solid potential with a CAGR of 6.8% through 2035, driven by pharmaceutical R&D expenditure exceeding USD 100 billion annually and advanced manufacturing initiatives across major biopharma clusters, including Boston-Cambridge, San Francisco Bay Area, Research Triangle Park, and San Diego. American manufacturers are adopting continuous manufacturing technologies, flow chemistry platforms, and advanced process analytical technologies for enhanced efficiency and regulatory compliance, particularly in facilities serving biologics production and specialty therapeutic development. Technology deployment channels through established chemical suppliers and contract development and manufacturing organizations expand coverage across pharmaceutical, biotechnology, and electronics manufacturing facilities.
Leading market segments:
In Jiangsu, Zhejiang, Shandong, and Hebei provinces, the adoption of fine chemical manufacturing is accelerating across pharmaceutical intermediate facilities, agrochemical production centers, and electronics materials plants, driven by domestic pharmaceutical industry expansion and export manufacturing growth. The market demonstrates strong growth momentum with a CAGR of 6.7% through 2035, linked to comprehensive pharmaceutical industry upgrades and increasing focus on quality standards meeting international regulatory requirements. Chinese manufacturers are implementing advanced synthesis technologies and quality control systems to enhance product specifications while serving growing demand for generic APIs, agrochemical intermediates, and electronic-grade chemicals in both domestic and export markets. The country's 14th Five-Year Plan emphasizes pharmaceutical and chemical industry modernization, creating sustained demand for advanced fine chemical production capabilities.
Germany's advanced chemical industry demonstrates sophisticated implementation of fine chemical manufacturing, with documented case studies showing successful integration of green chemistry principles and continuous processing technologies in specialty pharmaceutical intermediates production. The country's manufacturing infrastructure in major chemical clusters, including Rhine-Ruhr region, Frankfurt-Ludwigshafen corridor, and Munich-Ingolstadt area, showcases integration of advanced synthesis technologies with existing chemical industry infrastructure, leveraging expertise in process chemistry and pharmaceutical compliance. German manufacturers emphasize quality excellence and environmental sustainability, creating demand for high-performance fine chemicals that support REACH regulations and pharmaceutical ICH guidelines. The market maintains steady growth through focus on innovation and technology export, with a CAGR of 6.6% through 2035.
Key development areas:
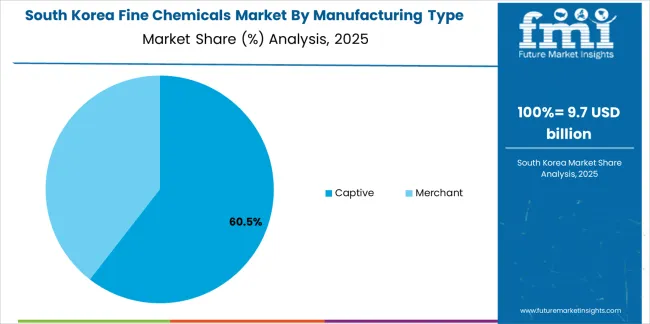
South Korea's market expansion is driven by diverse industrial demand, including semiconductor-grade chemical requirements in Samsung and SK Hynix fabrication facilities, pharmaceutical intermediate needs in Celltrion and Samsung Biologics operations, and electronics materials production supporting display and battery manufacturing. The country demonstrates promising growth potential with a CAGR of 6.4% through 2035, supported by government biotechnology development programs and semiconductor industry expansion initiatives. Korean manufacturers face implementation challenges related to high purity requirements and specialized expertise needs, requiring technology partnerships and quality system investments. However, growing biologics manufacturing and semiconductor fabrication requirements create compelling business cases for advanced fine chemical production, particularly in facilities serving global pharmaceutical and electronics companies.
Market characteristics:
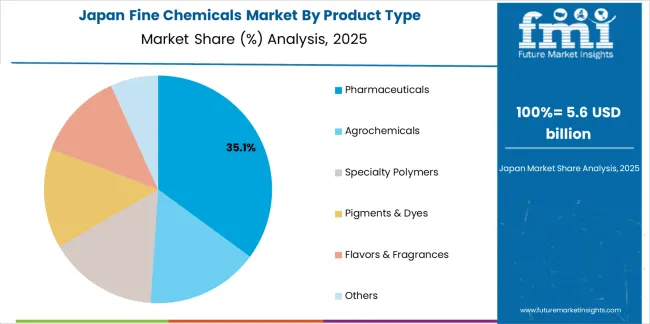
The Japan market leads in high-purity fine chemical production based on stringent quality management systems and advanced synthesis technologies serving pharmaceutical and electronics industries. The country shows moderate potential with a CAGR of 6.3% through 2035, driven by domestic pharmaceutical demand and electronics materials requirements across major manufacturing regions, including Kanto, Kansai, and Tokai industrial areas. Japanese manufacturers maintain competitive advantages through quality excellence and technical expertise, particularly in facilities serving API production for domestic pharmaceutical companies and high-purity chemical manufacturing for semiconductor fabrication. Technology deployment emphasizes continuous improvement methodologies and comprehensive quality documentation systems.
Leading market segments:
In England, Scotland, and Wales, pharmaceutical and chemical facilities are implementing advanced fine chemical synthesis capabilities to enhance drug development support and manufacturing competitiveness, with documented case studies showing successful integration of flow chemistry and biocatalysis technologies in pharmaceutical intermediates production. The market shows moderate growth potential with a CAGR of 6.2% through 2035, linked to pharmaceutical R&D activities, contract manufacturing expansion, and emerging green chemistry initiatives. British manufacturers are adopting advanced synthesis and analytical technologies to enhance capabilities while maintaining regulatory standards demanded by MHRA and EMA regulations. The country's established pharmaceutical industry creates sustained demand for specialized fine chemicals supporting drug development and clinical trial material production.
Market development factors:
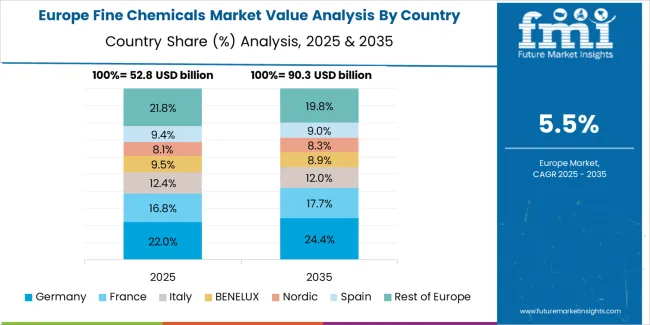
The fine chemicals market in Europe is projected to grow from USD 52.7 billion in 2025 to USD 95.8 billion by 2035, registering a CAGR of 6.2% over the forecast period. Germany is expected to maintain its leadership position with a 38.5% market share in 2025, slightly declining to 37.8% by 2035, supported by its extensive chemical manufacturing infrastructure and major industrial centers, including Ludwigshafen, Leverkusen, and Frankfurt chemical complexes.
The United Kingdom follows with a 16.2% share in 2025, projected to reach 16.8% by 2035, driven by comprehensive pharmaceutical R&D activities and contract manufacturing expansion supporting drug development programs. France holds a 14.8% share in 2025, expected to maintain 14.5% by 2035 through ongoing pharmaceutical industry investments and specialty chemical production. Italy commands a 12.5% share, while Spain accounts for 9.7% in 2025. The Rest of Europe region is anticipated to gain momentum, expanding its collective share from 8.3% to 9.1% by 2035, attributed to increasing fine chemical production in Switzerland, Belgium, and Netherlands serving pharmaceutical and agrochemical industries, and emerging Eastern European contract manufacturing facilities implementing pharmaceutical-grade production capabilities.
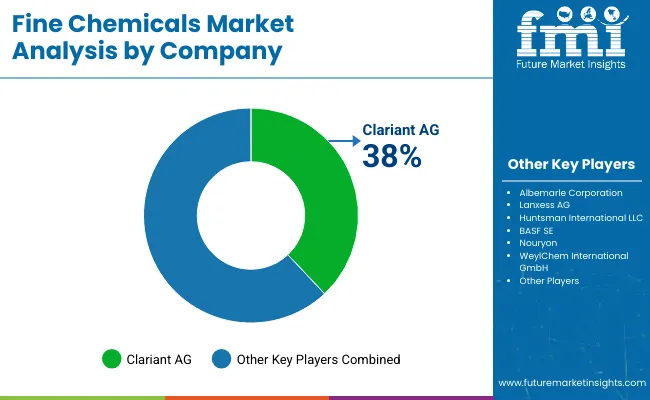
The Fine Chemicals Market features approximately 35–45 players with moderate consolidation, where the top three companies collectively hold around 22–28% of global share through specialized synthesis capabilities, multi-step reaction platforms, and long-term contracts with pharmaceutical, agrochemical, and high-performance materials manufacturers. The leading company, BASF SE, accounts for nearly 9% market share, supported by its integrated chemical value chain, strong backward integration into key intermediates, and broad fine chemical offerings across catalysts, specialties, and pharma-related building blocks. Competition is driven by reaction expertise, purity levels, regulatory compliance, and custom synthesis capabilities rather than volume-based pricing.
Market leaders including BASF SE, Lonza Group, and Evonik Industries AG maintain strong positions through advanced multi-purpose synthesis facilities, high-containment production assets, and deep expertise in complex chemistries such as asymmetric synthesis, catalytic hydrogenation, and chiral intermediates. Their advantages include global GMP and non-GMP manufacturing networks, extensive quality documentation, and strong partnerships with leading pharma and agrochemical innovators. These companies continue expanding into high-value segments including biologics-related intermediates, advanced catalysts, and precision agro-intermediates.
Challenger groups such as Albemarle Corporation, Huntsman International LLC, Clariant AG, and Lanxess AG compete through specialized reaction technologies, robust process chemistry capabilities, and strong regional supply networks. Their strengths include integrated production of fine chemical intermediates, strong R&D support, and the ability to tailor custom synthesis offerings aligned with end-user formulation requirements across pharmaceuticals, crop protection, and specialty polymers.
Additional competitive pressure arises from specialized manufacturers such as Nouryon, WeylChem International GmbH, Bayer AG, Oerlikon Balzers, Solvay SA, Johnson Matthey, and Merck KGaA, which differentiate through niche fine chemical expertise in catalysts, high-purity reagents, surface-functionalized compounds, high-performance coatings, and laboratory-to-commercial scale synthesis. Their localized regulatory knowledge, flexible production assets, and strong technical support enable them to serve fast-growing markets requiring unique molecular structures and stringent purity thresholds. Overall, competitive dynamics increasingly favor companies combining advanced reaction engineering, integrated quality systems, and strong application-specific technical capabilities across global life sciences and specialty materials value chains.
Fine chemicals represent specialized chemical compounds that enable manufacturers to achieve pharmaceutical-grade purity levels exceeding 99.5%, delivering superior quality intermediates and active ingredients essential for drug manufacturing, agrochemical production, and electronics fabrication in demanding applications. With the market projected to grow from USD 210.7 billion in 2025 to USD 391.8 billion by 2035 at a 6.4% CAGR, these specialized chemicals offer compelling advantages - exceptional purity standards, customizable synthesis capabilities, and regulatory compliance documentation - making them essential for pharmaceuticals & nutraceuticals applications (38% market share), agrochemicals (20% share), and electronics seeking alternatives to lower-grade chemicals that compromise product quality through impurity contamination. Scaling market adoption and technological advancement requires coordinated action across pharmaceutical policy, chemical manufacturing standards, specialty chemical producers, end-user industries, and research and development investment capital.
| Item | Value |
|---|---|
| Quantitative Units | USD 210.7 billion |
| Product Type | Pharmaceuticals, Agrochemicals, Specialty Polymers, Pigments & Dyes, Flavors & Fragrances, Others |
| Manufacturing Type | Captive, Merchant |
| Application | Pharmaceuticals & Nutraceuticals, Agrochemicals, Electronics, Cosmetics & Personal Care, Food & Beverages, Others |
| Regions Covered | Asia Pacific, North America, Europe, Latin America, Middle East & Africa |
| Country Covered | India, USA, China, Germany, South Korea, Japan, UK, and 40+ countries |
| Key Companies Profiled | BASF SE, Lonza Group, Evonik Industries AG, Albemarle Corporation, Huntsman International LLC, Clariant AG, Lanxess AG, Nouryon, WeylChem International GmbH, Bayer AG, Oerlikon Balzers, Solvay SA, Johnson Matthey, and Merck KGaA |
| Additional Attributes | Dollar sales by product type, manufacturing type, and application categories, regional adoption trends across Asia Pacific, North America, and Europe, competitive landscape with chemical manufacturers and contract development organizations, manufacturing facility requirements and GMP specifications, integration with pharmaceutical development and electronics manufacturing, innovations in green chemistry and continuous processing technologies, and development of specialized synthesis capabilities with high-purity and regulatory compliance characteristics. |
The global fine chemicals market is estimated to be valued at USD 210.7 billion in 2025.
The market size for the fine chemicals market is projected to reach USD 391.8 billion by 2035.
The fine chemicals market is expected to grow at a 6.4% CAGR between 2025 and 2035.
The key product types in fine chemicals market are pharmaceuticals, agrochemicals, specialty polymers, pigments & dyes, flavors & fragrances and others.
In terms of manufacturing type, captive segment to command 60.0% share in the fine chemicals market in 2025.


Our Research Products

The "Full Research Suite" delivers actionable market intel, deep dives on markets or technologies, so clients act faster, cut risk, and unlock growth.

The Leaderboard benchmarks and ranks top vendors, classifying them as Established Leaders, Leading Challengers, or Disruptors & Challengers.

Locates where complements amplify value and substitutes erode it, forecasting net impact by horizon

We deliver granular, decision-grade intel: market sizing, 5-year forecasts, pricing, adoption, usage, revenue, and operational KPIs—plus competitor tracking, regulation, and value chains—across 60 countries broadly.

Spot the shifts before they hit your P&L. We track inflection points, adoption curves, pricing moves, and ecosystem plays to show where demand is heading, why it is changing, and what to do next across high-growth markets and disruptive tech

Real-time reads of user behavior. We track shifting priorities, perceptions of today’s and next-gen services, and provider experience, then pace how fast tech moves from trial to adoption, blending buyer, consumer, and channel inputs with social signals (#WhySwitch, #UX).

Partner with our analyst team to build a custom report designed around your business priorities. From analysing market trends to assessing competitors or crafting bespoke datasets, we tailor insights to your needs.
Supplier Intelligence
Discovery & Profiling
Capacity & Footprint
Performance & Risk
Compliance & Governance
Commercial Readiness
Who Supplies Whom
Scorecards & Shortlists
Playbooks & Docs
Category Intelligence
Definition & Scope
Demand & Use Cases
Cost Drivers
Market Structure
Supply Chain Map
Trade & Policy
Operating Norms
Deliverables
Buyer Intelligence
Account Basics
Spend & Scope
Procurement Model
Vendor Requirements
Terms & Policies
Entry Strategy
Pain Points & Triggers
Outputs
Pricing Analysis
Benchmarks
Trends
Should-Cost
Indexation
Landed Cost
Commercial Terms
Deliverables
Brand Analysis
Positioning & Value Prop
Share & Presence
Customer Evidence
Go-to-Market
Digital & Reputation
Compliance & Trust
KPIs & Gaps
Outputs
Full Research Suite comprises of:
Market outlook & trends analysis
Interviews & case studies
Strategic recommendations
Vendor profiles & capabilities analysis
5-year forecasts
8 regions and 60+ country-level data splits
Market segment data splits
12 months of continuous data updates
DELIVERED AS:
PDF EXCEL ONLINE
Fine Bubble Diffuser Market Size and Share Forecast Outlook 2025 to 2035
Chemicals And Petrochemicals Electrostatic Precipitator Market Size and Share Forecast Outlook 2025 to 2035
Fine Hydrates Market Analysis & Forecast 2025 to 2035
Fine Line Striping Tape Market
Refinery Process Chemical Market Size and Share Forecast Outlook 2025 to 2035
Refinery fuel additives Market Size and Share Forecast Outlook 2025 to 2035
Refined Functional Carbohydrates Market Size and Share Forecast Outlook 2025 to 2035
Refined Lactose Market Size and Share Forecast Outlook 2025 to 2035
Refinery and Petrochemical Filtration Market Analysis by Filter Type, Application, End-User and Region 2025 to 2035
Refinery Catalyst Market Growth - Trends & Forecast 2025 to 2035
Refined Cane Sugar Market Analysis by Product Type and End Use Through 2035
Biochemicals Control Market Size and Share Forecast Outlook 2025 to 2035
Oxo Chemicals Market Size and Share Forecast Outlook 2025 to 2035
Soy Chemicals Market Size and Share Forecast Outlook 2025 to 2035
AI-defined Vehicle Market Forecast and Outlook 2025 to 2035
Demi-fine Jewelry Market Forecast and Outlook 2025 to 2035
Zinc Chemicals Market Size and Share Forecast Outlook 2025 to 2035
UK Refinery Catalyst Market Insights – Growth, Applications & Outlook 2025-2035
Microfined Graphite Powder Market Insights – Size, Trends & Forecast 2025-2035
Ultra-Fine Ath Market Size and Share Forecast Outlook 2025 to 2035

Thank you!
You will receive an email from our Business Development Manager. Please be sure to check your SPAM/JUNK folder too.
Chat With
MaRIA