The refinery process chemical market is likely to grow from USD 6 billion in 2025 to USD 9.9 billion in 2035, reflecting a CAGR of 5.2%. The growth curve exhibits a steady upward trajectory, indicating consistent expansion across the forecast period. Early-stage growth from 2025 to 2030 is expected to be driven primarily by demand in refinery operations, including catalysts, corrosion inhibitors, and process additives. Expansion in petroleum refining capacity, coupled with the need for enhanced operational efficiency and compliance with environmental standards, will support steady adoption of process chemicals.
Between 2030 and 2035, the curve is likely to maintain its upward slope, with moderate acceleration as refineries increasingly adopt advanced chemical solutions to improve yield, reduce emissions, and optimize energy consumption. Technological improvements, including specialty additives and next-generation catalysts, will further strengthen market value. The curve reflects gradual and sustained growth rather than sharp peaks or fluctuations, suggesting a mature market with predictable revenue expansion. Overall, the market growth curve indicates a reliable and steady rise, underpinned by ongoing operational demand, regulatory compliance requirements, and incremental technological innovation. This pattern highlights long-term opportunities for manufacturers and suppliers while demonstrating stability in the refinery process chemical sector.
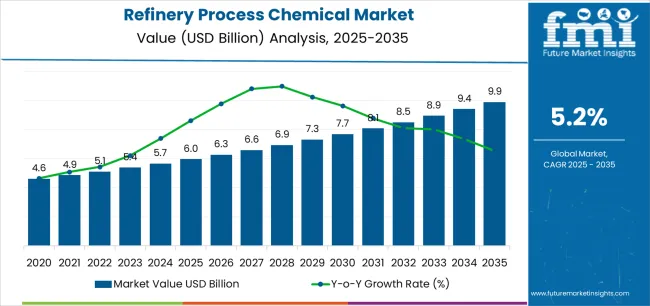
The market exhibits distinct growth phases characterized by varying market characteristics and competitive dynamics. Between 2025 and 2030, the market progresses through its environmental compliance and fuel quality optimization phase, expanding from USD 6 billion to USD 7.69 billion, with steady annual increments averaging a 5.2% growth rate. This period marks the transition from conventional refining chemical additives to advanced catalyst systems, which offer enhanced selectivity and integrated environmental protection capabilities, becoming mainstream features across global refining operations.
The 2025-2030 phase adds USD 1.73 billion to market value, representing 43% of total decade expansion. Market maturation factors include standardization of fuel quality protocols, declining unit costs for advanced hydroprocessing catalysts, and increasing refinery awareness of operational efficiency benefits reaching 95-98% conversion rates in desulfurization applications. Competitive landscape evolution during this period features established chemical manufacturers like BASF SE and Dow expanding their refinery catalyst portfolios while specialty producers like Honeywell UOP and W. R. Grace focus on advanced formulation development and enhanced performance capabilities.
From 2030 to 2035, market dynamics shift toward renewable integration and global sustainability enhancement, with growth continuing from USD 7.69 billion to USD 9.9 billion, adding USD 2.26 billion or 57% of total expansion. This phase transition centers on bio-feed co-processing catalyst systems, integration with circular economy initiatives and hydrogen economy development, and deployment across diverse refining scenarios, including crude-to-chemicals complexes, becoming standard rather than specialized applications.
| Metric | Value |
|---|---|
| Market Value (2025) | USD 6 billion |
| Market Forecast (2035) | USD 9.9 billion |
| Growth Rate | 5.2% CAGR |
| Leading Product | Catalysts Product Type |
| Primary Application | Water Treatment Segment |
The market demonstrates strong fundamentals with catalysts capturing a dominant share through advanced conversion efficiency and selectivity optimization capabilities. Water treatment applications drive primary demand, supported by increasing environmental regulations and water conservation requirements. Geographic expansion remains concentrated in developed markets with established refining infrastructure and complex processing units, while emerging economies show accelerating adoption rates driven by greenfield capacity additions and rising fuel quality standards aligned with global environmental norms.
Market expansion rests on three fundamental shifts driving adoption across the petroleum refining and chemical processing sectors. First, fuel quality regulation intensification creates compelling operational demand through refinery process chemicals that enable compliance with ultra-low sulfur diesel and gasoline specifications without complete processing unit replacement, supporting refiners' environmental compliance missions while maintaining production capacity and operational margins. Second, water scarcity management and environmental discharge standards accelerate as refining facilities worldwide seek advanced treatment systems that enable water recycling and reuse programs, reducing freshwater consumption intensity while meeting stringent effluent discharge standards and operational requirements in increasingly water-stressed regions globally.
Third, refinery complexity increases through heavier crude slate processing and margin optimization requirements, driving adoption of advanced catalysts and specialty chemicals that enhance conversion rates, improve product yields, and enable processing flexibility across diverse feedstock qualities. The growth faces headwinds from catalyst cost pressures that vary across precious metal commodity markets regarding platinum, palladium, and rhodium pricing volatility, which may limit catalyst replacement cycles and adoption rates in margin-constrained refining environments. Operational challenges also persist regarding catalyst deactivation mechanisms and fouling issues that may reduce effective cycle length in high-contaminant feedstock processing scenarios, affecting overall refinery economics and chemical consumption patterns.
The refinery process chemical market represents a critical petroleum processing opportunity driven by expanding global fuel quality mandates, operational optimization, and the need for environmental compliance in crude oil refining. As refineries worldwide seek to achieve ultra-low sulfur specifications below 10 ppm, maximize throughput, and integrate renewable feedstock co-processing for sustainable aviation fuel and renewable diesel production, process chemicals are evolving from basic additives to sophisticated optimization solutions ensuring operational efficiency and regulatory compliance.
The convergence of fuel regulation tightening, water management requirements, and refinery turnaround optimization creates sustained demand drivers across multiple segments. The market's growth trajectory from USD 6 billion in 2025 to USD 9.9 billion by 2035 at a 5.2% CAGR reflects fundamental shifts in refinery operational requirements and environmental compliance priorities. Geographic expansion opportunities are particularly pronounced in Asia-Pacific markets, where India (7.8% CAGR) and China (5.9% CAGR) lead through aggressive capacity expansions and fuel quality upgrades. The dominance of catalysts (38.0% market share) and water treatment applications (35.1% share) provides clear strategic focus areas, while emerging renewable co-processing and digital optimization open new revenue streams.
Strengthening the dominant catalyst segment (38.0% market share) through enhanced hydroprocessing formulations (12.3% share), superior selectivity, precious metal optimization, and seamless refinery integration. This pathway focuses on improving catalyst activity, extending cycle length to 3-5 years, reducing hydrogen consumption, and developing specialized formulations for renewable co-processing. Market leadership through advanced materials science and comprehensive technical service enables premium positioning. Expected revenue pool: USD 1.1-1.8 billion
Expansion within water treatment applications (35.1% market share) through cooling-water programs (14.2% share), boiler chemistry optimization, and comprehensive wastewater management for water-stressed refineries. This pathway addresses recycling mandates, zero liquid discharge targets, and advanced treatment programs for demanding environmental standards. Premium positioning reflects environmental leadership and comprehensive compliance capabilities. Expected revenue pool: USD 1.0-1.6 billion
Expansion within hydroprocessing units (28.0% market share) through diesel hydrotreating systems (12.0% share) addressing ultra-low sulfur specifications, cetane improvement, and comprehensive catalyst support. This pathway encompasses advanced corrosion inhibitors, hydrogen management, and anti-fouling chemistry supporting modern diesel production meeting Euro VI standards. Expected revenue pool: USD 0.9-1.4 billion
Development within corrosion inhibitors (21.0% share) addressing crude salt removal, overhead system protection, and metallurgy preservation across distillation units. This pathway encompasses filming amine chemistry, neutralizing amine development, and specialized formulations for high-TAN crude processing. Technology differentiation through proprietary design and integrated management programs enables extended equipment life. Expected revenue pool: USD 0.7-1.1 billion
Rapid refinery expansion across India (7.8% CAGR) and China (5.9% CAGR) creates opportunities through local supply infrastructure, technical service partnerships, and catalyst distribution networks. Growing greenfield construction and fuel specification upgrades including BS-VI drive sustained demand for advanced catalysts and water treatment programs. Localization strategies reduce costs and enable faster support. Expected revenue pool: USD 0.6-1.0 billion
Strategic expansion into FCC applications (22.0%-unit share, 14.5% product share) requires advanced zeolite technology, metals tolerance, and specialized formulations addressing heavy feedstock conversion and gasoline yield optimization. This pathway addresses octane enhancement, olefin management, and bottoms cracking with advanced rare earth engineering. Premium pricing reflects sophisticated technology and comprehensive consulting. Expected revenue pool: USD 0.5-0.8 billion
Integration chemistry supporting renewable diesel, sustainable aviation fuel, and bio-feed co-processing enabling refineries to diversify feedstocks while maintaining specifications. This pathway encompasses specialized catalysts tolerant of oxygen-containing molecules, hydrogen optimization, and comprehensive technical support for renewable integration. Premium positioning through sustainability leadership creates strategic partnership opportunities. Expected revenue pool: USD 0.4-0.7 billion
Primary Classification: The market segments by product type into Catalysts, Corrosion inhibitors, Demulsifiers, Antifoulants/dispersants, pH adjusters & oxygen scavengers, and Other specialties categories, representing the evolution from basic commodity chemical additives to advanced specialty formulations for comprehensive refinery process optimization.
Secondary Classification: Application segmentation divides the market into Water Treatment and Petroleum treatment sectors, reflecting distinct operational requirements for environmental compliance management and core hydrocarbon processing optimization.
Tertiary Classification: Process unit segmentation encompasses Hydroprocessing & Hydrotreating, Fluid Catalytic Cracking (FCC), Crude & vacuum distillation, Utilities & offsites (water, steam, cooling), and Reforming/alkylation/others, representing specific operational areas within integrated refinery complexes.
Regional Classification: Geographic distribution covers North America, Europe, Asia Pacific, Latin America, and the Middle East & Africa, with established refining centers in mature markets leading advanced chemical adoption while emerging economies show accelerating growth patterns driven by greenfield capacity expansion programs and environmental regulation convergence.
The segmentation structure reveals technology progression from conventional commodity refining chemicals toward advanced catalyst systems with enhanced activity, selectivity, and environmental compliance capabilities, while application diversity spans from core petroleum conversion and upgrading processes to comprehensive water management and environmental protection requiring sophisticated, integrated chemical solution portfolios.
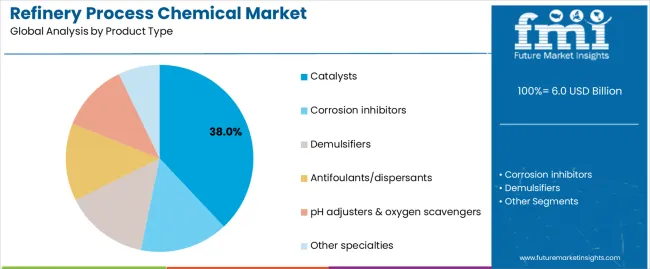
Market Position: Catalysts command the leading position in the refinery process chemical market with approximately 38.0% market share through critical conversion and upgrading features, including FCC catalysts (14.5%) for gasoline production, hydroprocessing/hydrotreating catalysts (12.3%) for ultra-low sulfur fuel production, reforming catalysts (6.4%) for octane enhancement, and isomerization/alkylation catalysts (4.8%) that enable refineries to achieve optimal product yields, meet stringent fuel quality specifications, and maximize economic value across diverse crude oil processing environments and market conditions.
Value Drivers: The segment benefits from sustained refinery preference for advanced catalyst systems that provide enhanced conversion selectivity, extended operating cycle length between regenerations or replacements, and comprehensive yield pattern optimization without requiring complete processing unit reconstruction or major capital investment.
Competitive Advantages: Catalyst systems differentiate through proven catalytic activity under commercial operating conditions, consistent performance characteristics across varying feedstock qualities and operating severities, regeneration capability extending total catalyst life, and demonstrated compatibility with renewable feedstock co-processing initiatives that enhance overall refinery economics and sustainability credentials.
Key market characteristics:
Corrosion inhibitors maintain a significant 21.0% market share in the refinery process chemical market due to their essential asset integrity and equipment protection functions across crude processing units, atmospheric and vacuum distillation overhead systems, amine treating units, and downstream product handling facilities.
Demulsifiers hold approximately 14.0% market share in the Refinery Process Chemical market, focusing on crude oil desalting optimization and oil-water separation enhancement applications. These performance-critical formulations demand precise emulsion-breaking capability in crude processing, effective water removal for salt extraction and metals reduction, compatibility with diverse crude oil characteristics, and operational efficiency enabling maximum crude throughput.
Antifoulants and dispersants account for approximately 12.0% market share through critical fouling prevention functions in heat exchanger networks, fractionation tower internals, furnace tubes, and processing equipment across refinery operations. The segment focuses on maintaining optimal heat transfer efficiency, preventing pressure drop increases, ensuring operational reliability, and extending cleaning cycle intervals requiring advanced deposit control chemistry.
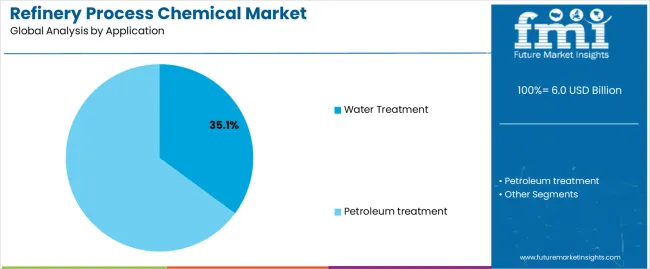
Market Context: Water treatment applications dominate the refinery process chemical market with approximately 35.1% market share due to critical environmental compliance requirements, operational efficiency imperatives, and increasing strategic focus on water conservation and reuse programs, encompassing cooling-water treatment (14.2%) for heat rejection system management, boiler/steam-cycle treatment (9.8%) for steam generation and distribution, wastewater/effluent chemicals (7.9%) for discharge compliance, and water reuse & polishing (3.2%) for closed-loop systems that collectively minimize environmental impact, reduce freshwater consumption intensity, and maintain reliable operational effectiveness across integrated refinery water management networks.
Appeal Factors: The segment benefits from substantial regulatory compliance investment mandates, corporate sustainability commitments driving water conservation programs, and operational cost reduction initiatives that emphasize the strategic deployment of advanced treatment chemistry for comprehensive environmental protection, resource conservation, and operational excellence applications across cooling towers, boiler systems, wastewater treatment facilities, and water recovery operations.
Growth Drivers: Zero liquid discharge regulatory mandates in water-scarce regions incorporate increasingly sophisticated water treatment and recovery systems as standard requirements for refinery environmental permits and operating licenses, while global water scarcity concerns and watershed protection requirements increase strategic demand for advanced recycling and reuse capabilities.
Market Challenges: Varying regional water quality characteristics, diverse discharge regulatory standards across jurisdictions, and site-specific operational constraints may limit complete chemical program standardization across different refinery locations, requiring customized treatment approaches and location-specific operational scenarios.
Application dynamics include:
Petroleum treatment captures approximately 64.9% market share through essential crude oil desalting operations, processing unit catalyst and chemical systems, conversion optimization programs, and finished product quality enhancement applications across the integrated refining value chain from crude reception through product blending and distribution. These core processing applications demand robust, high-performance chemical systems capable of reliable operation in harsh processing environments including high temperatures, elevated pressures, and corrosive conditions.
Growth Accelerators: Fuel quality regulation intensification drives primary market adoption as refinery process chemicals and advanced catalyst systems enable comprehensive compliance with ultra-low sulfur diesel specifications below 10 ppm, Tier 3 gasoline sulfur limits at 10 ppm average, and IMO 2020 bunker fuel regulations at 0.5% sulfur maximum without requiring complete processing unit replacement or major capital investment, supporting refiners' environmental compliance missions and regulatory obligations while maintaining production capacity utilization, operational margins, and refining profitability across increasingly stringent global fuel quality standards. Water scarcity management and environmental discharge compliance accelerate market expansion as refining facilities worldwide, particularly in water-stressed regions including Middle East, India, and southwestern United States, seek advanced treatment systems, closed-loop cooling programs, and comprehensive water recycling initiatives that minimize freshwater consumption intensity, reduce wastewater discharge volumes, and enable water reuse.
Growth Inhibitors: Catalyst and specialty chemical cost volatility varies significantly across precious metal commodity markets regarding platinum, palladium, rhodium, and rare earth element pricing dynamics, which may limit catalyst replacement cycle timing, constrain adoption of advanced formulations in margin-challenged refining environments, and affect overall market penetration in regions with lower refining margins or during periods of compressed crack spreads between crude oil costs and refined product values that pressure refinery operating economics. Feedstock quality deterioration challenges persist regarding increasing heavy crude oil and high-sulfur opportunity crude processing trends, elevated contaminant levels including sulfur, nitrogen, metals, and asphaltenes that accelerate catalyst deactivation rates, reduce effective operating cycle length, increase fouling tendencies across heat exchange equipment, and affect overall catalyst and chemical consumption patterns requiring more frequent regeneration, replacement, or supplemental chemical treatment programs impacting lifecycle economics.
Market Evolution Patterns: Adoption accelerates strategically in complex refineries with significant hydroprocessing capacity, FCC operations, and integrated petrochemical production where stringent environmental requirements, product quality specifications, and operational optimization imperatives justify advanced chemical and catalyst technology investments and premium pricing, with geographic concentration initially in coastal refining centers with established infrastructure transitioning progressively toward mainstream adoption in inland refineries and emerging economy facilities driven by fuel specification upgrade mandates, environmental regulation convergence, and technology transfer from established markets. Technology development focuses increasingly on renewable feedstock co-processing catalyst and chemistry support enabling sustainable aviation fuel and renewable diesel production, improved water treatment efficiency and zero liquid discharge system optimization, digital integration with refinery-wide optimization platforms and predictive maintenance systems.
The market demonstrates varied regional dynamics with Growth Leaders including India (7.8% CAGR) and China (5.9% CAGR) driving expansion through aggressive capacity additions and fuel specification upgrades. Steady Performers encompass Saudi Arabia (5.1% CAGR), United States (4.8% CAGR), and South Korea (4.2% CAGR), benefiting from established refining operations, integrated petrochemical complexes, and advanced catalyst technology adoption. Mature Markets feature Spain (3.9% CAGR) and Germany (3.6% CAGR), where efficiency optimization, environmental compliance enhancement, and bio-feed co-processing initiatives support consistent growth patterns.
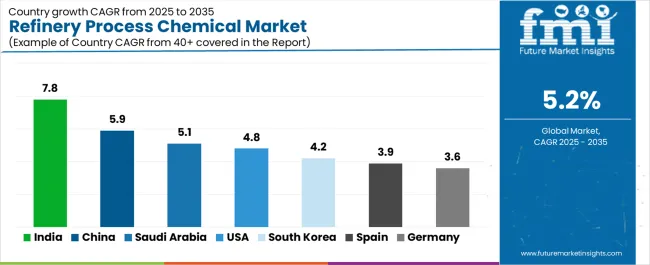
| Country | CAGR (2025-2035) |
|---|---|
| India | 7.8% |
| China | 5.9% |
| Saudi Arabia | 5.1% |
| USA | 4.8% |
| South Korea | 4.2% |
| Spain | 3.9% |
| Germany | 3.6% |
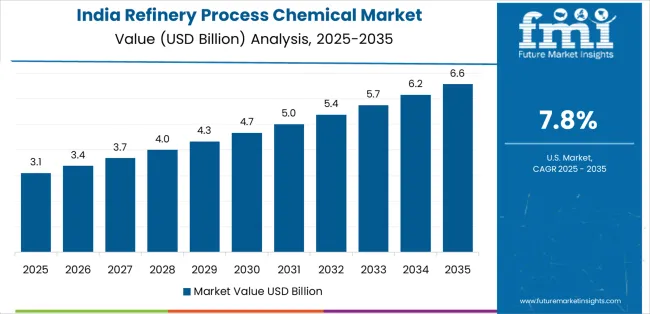
India establishes aggressive market growth leadership through large-scale refinery capacity additions including the Barmer refinery project and multiple west coast refinery expansion programs, comprehensive BS-VI fuel specification implementation requiring extensive hydroprocessing catalyst deployment, and strategic water management initiatives in water-stressed refining locations, integrating advanced process chemicals as mandatory requirements in new-build facilities and brownfield upgrade projects. The country's exceptional 7.8% CAGR reflects government Clean Fuel Vision initiatives promoting domestic refining self-sufficiency and environmental protection capabilities that mandate deployment of ultra-low sulfur fuel production technology and advanced water treatment systems in refinery construction permits and operating licenses. Growth concentrates in major refining hubs including Jamnagar (world's largest refining complex), Mumbai, Kochi, and emerging inland refining centers, where comprehensive hydroprocessing catalyst systems, advanced water treatment programs, and corrosion management solutions showcase integrated chemical technology deployment that appeals to state-owned oil companies and private refiners seeking BS-VI compliance.
In Shanghai, Guangzhou, Ningbo, and inland refining centers including Sichuan and Shaanxi provinces, Chinese integrated petrochemical complexes combining refining with downstream chemical production and independent teapot refinery consolidation and upgrade programs are implementing advanced process chemical systems as standard operational requirements for environmental compliance, product quality enhancement, and processing efficiency optimization, driven by increasing national environmental protection standards, stringent fuel quality specifications matching international norms, and strategic initiatives promoting refining industry consolidation and technology advancement that emphasize comprehensive catalyst performance, water management excellence, and emissions reduction capabilities. The market holds a robust 5.9% CAGR, supported by national Blue Sky protection programs targeting air quality improvement, comprehensive wastewater discharge standards requiring advanced treatment, and refining industry restructuring policies that promote advanced technology adoption including hydroprocessing capacity expansion, hydrogen infrastructure development supporting desulfurization operations, and renewable feedstock co-processing pilot programs for sustainable aviation fuel and biodiesel production supporting China's carbon neutrality objectives.
Saudi Arabia's strategically evolving refining market demonstrates robust process chemical adoption through pioneering crude-to-chemicals integration programs maximizing petrochemical production directly from crude oil while minimizing traditional fuel output, advanced FCC technology deployment with metals-tolerant catalyst systems enabling heavier feedstock processing, and comprehensive high-salinity cooling water management programs addressing Arabian Gulf seawater utilization challenges. The country leverages substantial domestic crude oil feedstock advantages, strategic location serving growing Asian markets, and aggressive petrochemical industry development to maintain a solid 5.1% CAGR. Refineries including the massive Jazan integrated complex, SATORP joint venture, and YASREF facility showcase cutting-edge catalyst technology integration and specialized chemistry programs optimizing product distribution toward higher-value petrochemical intermediates rather than conventional transportation fuels, reflecting strategic positioning for evolving energy transition scenarios.
USA refining market expansion benefits substantially from strategic turnaround maintenance cycles at major Gulf Coast, Midwest, and West Coast refining centers requiring comprehensive catalyst replacement, advanced corrosion protection programs, and equipment reliability enhancement chemistry, shale crude slate variability including light tight oil processing requiring operational flexibility and catalyst system adaptability, and progressive emissions reduction and effluent quality tightening at environmentally sensitive Gulf Coast refining hubs facing increasingly stringent air quality and water discharge regulations. The country maintains a healthy 4.8% CAGR driven by Infrastructure Investment and Jobs Act funding supporting refinery modernization and environmental compliance projects, renewable fuel standard requirements driving co-processing catalyst demand, and operational excellence initiatives emphasizing reliability, efficiency, and comprehensive chemical program optimization across the domestic refining industry. American refineries prioritize proven catalyst performance, comprehensive technical service support, rapid emergency response capabilities, and lifecycle cost optimization in catalyst and chemical procurement decisions, creating sustained demand for advanced hydroprocessing systems addressing tight product specifications.
Spanish refining market evolution emphasizes middle-distillate (diesel and jet fuel) production optimization reflecting European transportation fuel demand patterns favoring diesel over gasoline, strategic energy-efficiency retrofit programs reducing utility consumption and improving overall refinery carbon intensity, and advanced wastewater reuse systems at major coastal refineries including Cartagena, Tarragona, and Algeciras addressing Mediterranean water scarcity and discharge limitations. The country maintains a 3.9% CAGR driven by EU fuel quality directive compliance, corporate decarbonization commitments from integrated oil companies, and circular economy initiatives promoting water recycling and waste heat recovery that collectively drive catalyst upgrade programs, comprehensive water treatment system enhancements, and operational optimization chemistry deployment supporting refinery competitiveness and sustainability performance in mature European market conditions.
Germany's technologically advanced refining market emphasizes ultra-low sulfur fuel production exceeding EU specifications, stringent effluent nutrient discharge limits requiring advanced biological treatment and nutrient removal chemistry, and pioneering bio-feed co-processing pilot programs integrating renewable feedstocks including used cooking oil, animal fats, and advanced biofuels into conventional refining operations supporting national climate protection goals and renewable energy mandates. The country holds a 3.6% CAGR driven by industry-leading environmental performance standards, technology development collaboration between refiners and chemical suppliers, and strategic positioning for energy transition supporting Germany's Energiewende (energy transition) policy framework and ambitious greenhouse gas reduction targets.
South Korean refining industry shows consistent market development with 4.2% CAGR, distinguished by extensive petrochemical integration with refining operations at major complexes including Ulsan, Yeosu, and Daesan requiring specialized catalyst systems optimizing petrochemical feedstock production, premium transportation fuel specifications serving domestic and export markets demanding superior quality, and advanced cooling-water treatment and comprehensive corrosion control programs addressing challenging seaside plant locations with seawater cooling infrastructure and marine atmospheric corrosion exposure requiring specialized materials protection and equipment reliability programs.
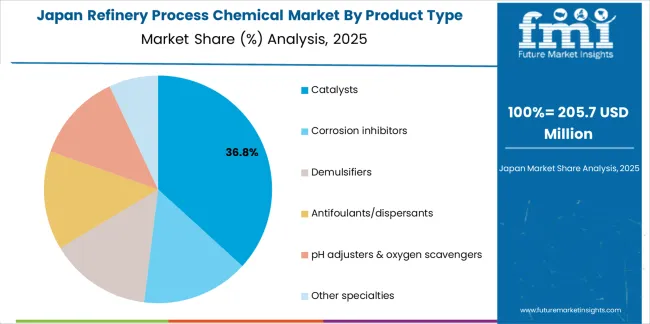
In Japan, the Refinery Process Chemical market strategically prioritizes advanced hydroprocessing and hydrotreating catalyst systems, which capture the dominant technology share of sophisticated refinery operations through proven desulfurization performance, comprehensive quality assurance meeting stringent JIS specifications, and seamless integration with existing refinery infrastructure. Japanese refineries emphasize exceptional reliability, consistent long-term performance excellence, and superior technical support, creating sustained demand for precious metal hydroprocessing catalysts that provide outstanding sulfur removal activity, extended catalyst cycle length exceeding industry averages, and adaptive performance optimization based on varying crude slate characteristics and strict environmental compliance requirements for ultra-clean fuel production serving domestic transportation and industrial markets demanding exceptional product quality and consistent performance standards.
In South Korea, the refinery process chemical market structure strategically favors established international manufacturers including BASF SE, Honeywell UOP, and W. R. Grace, which maintain dominant competitive positions through comprehensive product portfolios spanning catalysts to specialty chemicals, extensive established relationships with major refining companies including SK Energy, S-Oil, and GS Caltex, and sophisticated technical service networks supporting both refining operations and integrated petrochemical production installations. These leading global providers offer complete integrated solutions expertly combining advanced catalyst systems with professional engineering consulting, ongoing performance monitoring services, and responsive technical support capabilities that effectively appeal to Korean refineries seeking reliable world-class finishing systems, operational excellence, and sustained competitive advantages in export-oriented premium fuel and petrochemical markets.
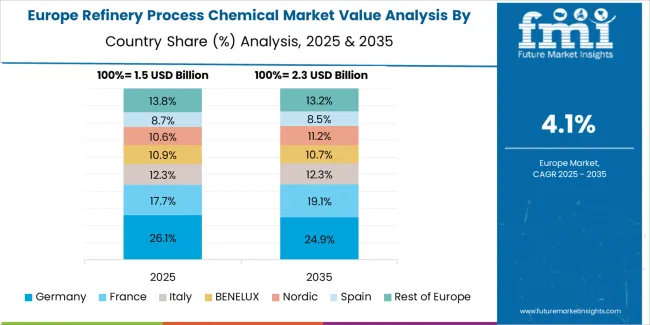
Europe accounts for an estimated 26.5% of global refinery process chemical demand in 2025 (approximately USD 1.6 billion of the USD 6 billion global total). Within Europe: Germany leads with USD 0.4 billion (22% of European market), followed by Italy USD 0.3 billion (16%), United Kingdom USD 0.2 billion (14%), France USD 0.2 billion (13%), Spain USD 0.1 billion (8%), Benelux & Nordics collectively USD 0.2 billion (12%), and Central & Eastern Europe USD 0.2 billion (15%). The regional demand structure is comprehensively supported by complex refinery operations transitioning toward low-sulfur marine fuel production following IMO 2020 implementation, extensive water-efficiency mandates and zero liquid discharge requirements in water-stressed Mediterranean regions, and major turnaround-driven adoption of advanced corrosion inhibitors, comprehensive antifoulant programs, and sophisticated catalyst systems including FCC zeolite technology and hydroprocessing catalysts supporting EU fuel quality directives and ambitious environmental protection standards across the European refining industry.
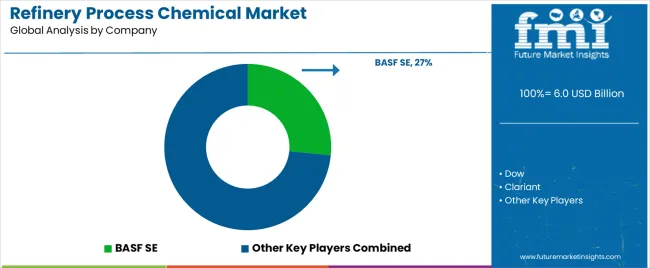
The market operates with moderate concentration characteristics, featuring approximately 15-25 meaningful participants globally, where leading companies control roughly 45-50% of the total global market share through well-established long-term relationships with major international and national oil companies, comprehensive product portfolios spanning multiple chemical categories and catalyst technologies, and extensive global manufacturing and technical service infrastructure. BASF SE maintains the leading market position with approximately 10.8% global market share through its extensive refining catalyst and process chemicals expertise, comprehensive research and development capabilities, and worldwide commercial presence.
Market Leaders encompass BASF SE, Dow, and Clariant, which maintain substantial competitive advantages through extensive decades of process chemistry expertise, established global refinery distribution and technical service networks, world-class research and development facilities, comprehensive formulation capabilities, and strong strategic relationships with major oil companies creating significant customer loyalty, technical integration, and sustained premium pricing power supporting ongoing innovation investment and market leadership maintenance.
Technology Innovators include Evonik Industries, Honeywell UOP, and W. R. Grace & Co., which compete effectively through highly specialized catalyst technology focus, innovative proprietary formulations, advanced zeolite synthesis capabilities, and differentiated application expertise that strategically appeals to refineries seeking cutting-edge catalyst performance, renewable feedstock co-processing support, digital integration capabilities, and comprehensive process optimization consulting services. These technology-focused competitors differentiate through rapid product development cycles, specialized refining application focus, proprietary intellectual property portfolios, and close collaborative relationships with leading refiners supporting technology co-development and early commercial adoption of innovative solutions.
Regional Specialists feature companies like Albemarle, Johnson Matthey, Baker Hughes, and Ecolab (Nalco Water), which focus strategically on specific geographic markets, specialized application segments including water treatment or specific catalyst types, and targeted customer segments including independent refiners or national oil companies. Market competitive dynamics strongly favor participants that effectively combine reliable, proven chemical and catalyst formulations with comprehensive advanced technical services including performance diagnostics, optimization consulting, digital monitoring integration, troubleshooting support, and application training capabilities delivering measurable value beyond product supply.
| Item | Value |
|---|---|
| Quantitative Units | USD 6 billion |
| Product Type | Catalysts, Corrosion inhibitors, Demulsifiers, Antifoulants/dispersants, pH adjusters & oxygen scavengers, Other specialties |
| Application | Water Treatment, Petroleum treatment |
| Process Unit/Area | Hydroprocessing & Hydrotreating, FCC, Crude & vacuum distillation, Utilities & offsites, Reforming/alkylation/others |
| Regions Covered | North America, Europe, Asia Pacific, Latin America, Middle East & Africa |
| Countries Covered | India, China, Saudi Arabia, United States, South Korea, Spain, Germany, and 25+ additional countries |
| Key Companies Profiled | BASF SE, Dow, Clariant, Evonik Industries, Honeywell UOP, W. R. Grace & Co. |
| Additional Attributes | Dollar sales by product type and application categories, regional adoption trends across Asia-Pacific, Middle East, and North America, competitive landscape with chemical manufacturers and catalyst suppliers, refinery preferences for catalyst performance and lifecycle economics, integration with digital optimization platforms and predictive maintenance systems, innovations in hydroprocessing catalyst formulations and water treatment chemistry, and development of renewable feedstock co-processing solutions with enhanced sustainability and operational efficiency capabilities. |
The global refinery process chemical market is estimated to be valued at USD 6.0 billion in 2025.
The market size for the refinery process chemical market is projected to reach USD 9.9 billion by 2035.
The refinery process chemical market is expected to grow at a 5.2% CAGR between 2025 and 2035.
The key product types in refinery process chemical market are catalysts, corrosion inhibitors, demulsifiers, antifoulants/dispersants, ph adjusters & oxygen scavengers and other specialties.
In terms of application, water treatment segment to command 35.1% share in the refinery process chemical market in 2025.


Full Research Suite comprises of:
Market outlook & trends analysis
Interviews & case studies
Strategic recommendations
Vendor profiles & capabilities analysis
5-year forecasts
8 regions and 60+ country-level data splits
Market segment data splits
12 months of continuous data updates
DELIVERED AS:
PDF EXCEL ONLINE
Refinery fuel additives Market Size and Share Forecast Outlook 2025 to 2035
Refinery Catalyst Market Growth - Trends & Forecast 2025 to 2035
Refinery and Petrochemical Filtration Market Analysis by Filter Type, Application, End-User and Region 2025 to 2035
UK Refinery Catalyst Market Insights – Growth, Applications & Outlook 2025-2035
USA Refinery Catalyst Market Report - Trends & Innovations 2025 to 2035
Japan Refinery Catalyst Market Report – Trends, Demand & Industry Forecast 2025-2035
ASEAN Refinery Catalyst Market Analysis
Germany Refinery Catalyst Market Analysis – Size, Share & Forecast 2025-2035
Petroleum Refinery Merchant Hydrogen Generation Market Size and Share Forecast Outlook 2025 to 2035
Petroleum Refinery Hydrogen Market Size and Share Forecast Outlook 2025 to 2035
High Performance Refinery Additives Market Trend Analysis Based on Product, Application, and Region 2025-2035
Captive Petroleum Refinery Hydrogen Generation Market Size and Share Forecast Outlook 2025 to 2035
Process Automation and Instrumentation Market Size and Share Forecast Outlook 2025 to 2035
Process Pipe Coating Market Size and Share Forecast Outlook 2025 to 2035
Process Spectroscopy Market Analysis - Size, Share, and Forecast Outlook 2025 to 2035
Processed Beef Market Size and Share Forecast Outlook 2025 to 2035
Processed Fruit and Vegetable Market Analysis - Size, Share, and Forecast Outlook 2025 to 2035
Process Plants Gas Turbine Market Analysis - Size, Share, and Forecast Outlook 2025 to 2035
Competitive Breakdown of Processed Beef Market Share
Market Share Insights for Processed Cashew Providers

Thank you!
You will receive an email from our Business Development Manager. Please be sure to check your SPAM/JUNK folder too.
Chat With
MaRIA