Process Plants Gas Turbine Market Size & Share Forecast 2025 to 2035

The global process plants gas turbine market is forecasted to grow from USD 2.43 billion in 2025 to USD 4.23 billion by 2035, registering a CAGR of 5.7% during the forecast period.
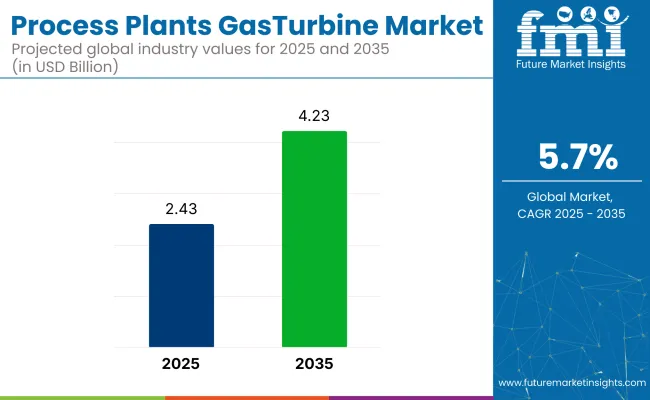
Process Plants Gas Turbine Market Quick Stats

  • Market Value (2025): USD 2.43 billion
  • Forecast Value (2035): USD 4.23 billion
  • Forecast CAGR (2025 to 2035): 5.7%
  • Leading Segment in 2035: Heavy-Duty Gas Turbines (~62% share)
  • Key Growth Region: Asia Pacific (India)
  • Key Players: Ansaldo Energia; Baker Hughes; Bharat Heavy Electricals; Capstone Green Energy; Destinus Energy; Doosan; Flex Energy Solutions

Process Plants Gas Turbine Market

Market expansion is being driven by increasing demand for efficient power generation solutions in various process industries, including oil and gas, petrochemicals, and chemical manufacturing. The growing need for reliable, high-performance gas turbines that comply with stringent environmental regulations is further accelerating market adoption. Process plants are increasingly focusing on reducing operational costs and improving energy efficiency, which is fueling the deployment of advanced gas turbine technologies.

Advanced gas turbines with improved thermal efficiency, reduced emissions, and greater fuel flexibility are being developed and deployed to optimize energy consumption in process plants. The integration of gas turbines into combined-cycle power plants and cogeneration systems is being encouraged to enhance overall plant efficiency and reduce carbon footprint.

Investments are also being directed toward modernization and retrofitting of existing infrastructure to meet evolving energy demands and environmental standards. “With increasing power generation demand driven by growing electrification needs and more renewables coming online every day, operators and municipalities, like City Utilities, need to ensure grid reliability with high efficiency, while delivering cheaper and faster power for their end users,” said Dave Ross, CEO of GE Vernova’s Gas Power Americas region.

Major players such as General Electric, Siemens Energy, Mitsubishi Power, and AnsaldoEnergia are intensifying efforts in research and development to introduce innovative gas turbine models tailored for process plant applications.

Strategic alliances and collaborations with process industry end users are being established to enhance service capabilities and customize solutions according to specific operational requirements. Product portfolios are being expanded to include advanced maintenance, repair, and overhaul (MRO) services to increase the lifespan and reliability of gas turbine assets.

Analyzing Process Plants Gas Turbine Market by Top Investment Segments

Strong investments are being made in the process plants gas turbine market, with attention centered on mid-capacity turbines, heavy-duty units, and combined cycle systems. Growth is being propelled by rising demand for industrial efficiency and decarbonization.

Turbines between 1 MW and 30 MW lead demand by capacity in 2025

Gas turbines in the 1 MW to 30 MW capacity range are expected to account for 45% of the market share in 2025. These turbines are preferred for industrial operations such as refineries, chemical plants, and fertilizer units due to their scalability and decentralized energy generation capabilities. Compact design, thermal efficiency, and hydrogen fuel compatibility drive their adoption in modular and phased infrastructure expansion.

  • Turbines in this capacity range are widely used in refineries, fertilizers, and chemical processing plants to ensure consistent, reliable onsite power.
  • Siemens Energy and Kawasaki Heavy Industries are leading the development of compact, high-efficiency systems prioritizing hydrogen fuel readiness and easy integration into modular facilities.

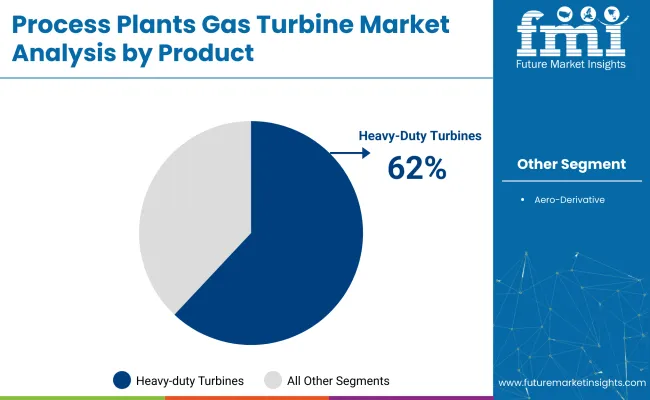
Heavy-duty turbines are likely to dominate with 62% market share in 2025

Heavy-duty turbines are projected to capture 62% of the market share in 2025, supported by their deployment in energy-intensive industries like petrochemicals and metals. Their ability to offer high output, durability, and continuous operation under demanding conditions makes them essential for large industrial setups.
  • Advanced combustion systems and smart controls enhance their efficiency and emission compliance.These turbines are favored in petrochemical, metal, and large-scale industrial plants due to their high-capacity and reliable output for uninterrupted production.
  • GE Vernova, Mitsubishi Power, and AnsaldoEnergia are integrating dry low-NOx combustion, smart controls, and superior cooling technologies to enhance fuel flexibility and lifecycle performance.

Process Plants Gas Turbine Market Analysis By Product

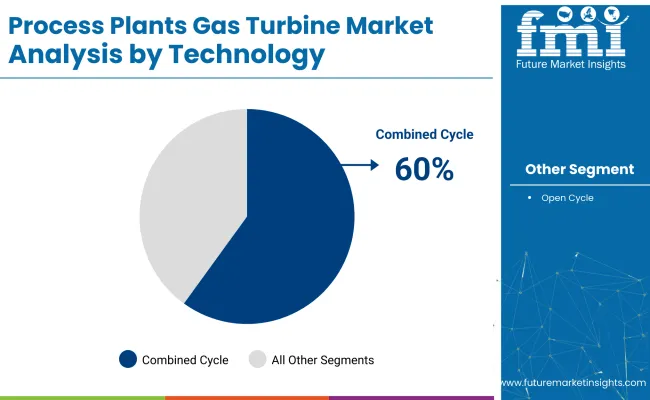
Combined Cycle Technology Is Projected to Hold 60% Market Share in 2025

Combined cycle gas turbines (CCGT) are forecast to secure 60% of the market share in 2025, owing to superior thermal efficiency and emission reduction benefits. By utilizing exhaust heat to produce additional steam-based power, these turbines offer a cost-effective solution for process plants aiming to decarbonize operations. Their integration into ammonia, methanol, and petrochemical manufacturing is accelerating adoption.
  • Combined cycle systems are highly sought after for their ability to recover exhaust heat and boost power output without added fuel costs, improving overall plant efficiency.
  • Siemens Energy, GE Vernova, and Mitsubishi Power are engineering advanced CCGT solutions tailored for heavy industrial sectors, supporting both operational efficiency and emissions reduction goals.

Process Plants Gas Turbine Market Analysis By Technology

Top Process Plants Gas Turbine Market Dynamics

The process plants gas turbine market is experiencing growth driven by increasing demand for reliable on-site power generation and advancements in turbine technology. However, challenges such as high capital costs and regulatory complexities are impacting market expansion.

Increasing demand for reliable on-site power generation is driving market growth

The demand for reliable and efficient on-site power generation within process plants is being significantly increased. Gas turbines are being preferred as dependable energy sources that reduce reliance on unstable grid power. Industries including chemicals, oil and gas, and manufacturing are integrating gas turbine systems to maintain continuous operations and optimize energy use.

Combined heat and power (CHP) configurations are being adopted to simultaneously generate electricity and thermal energy, enhancing overall efficiency. These factors collectively contribute to the expanding deployment of gas turbines, driving sustained growth in the process plants gas turbine market.

High capital costs and regulatory complexities are limiting market expansion

High initial capital costs and stringent regulatory frameworks are being recognized as key challenges limiting the growth of the process plants gas turbine market. Significant investments are required for purchasing, installing, and maintaining gas turbine equipment, which can be prohibitive for small and medium-sized enterprises.

Additionally, compliance with environmental regulations and emission control standards is being mandated, increasing operational complexities and costs. These factors are slowing down project approvals and market penetration, especially in regions with strict regulatory oversight. Overcoming these obstacles through cost optimization and streamlined compliance is critical for future market development.

Analyzing Top Countries Manufacturing, Installing, and Maintaining Process-Plants Gas Turbines

The process-plants gas turbine market is projected to grow steadily through 2035. Growth is driven by industrial expansion and energy demand in India and China. Mature markets like the US and UK focus on technological upgrades and sustainability.
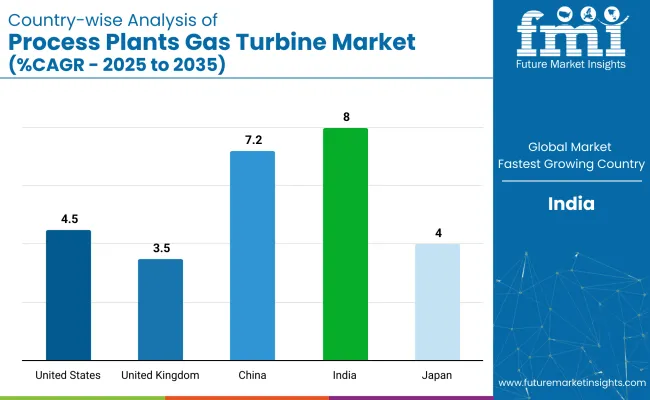
Country Wise Analysis Of Process Plants Gas Turbine Market

Countries CAGR (%)
United States 4.5%
United Kingdom 3.5%
China 7.2%
India 8.0%
Japan 4.0%

United States Process Plants Gas Turbine Market Analysis

The United States process-plants gas turbine market is forecasted to grow at a CAGR of 4.5% through 2035. Growth is fueled by technological advancements, turbine efficiency improvements, and regulatory measures favoring clean energy. Increasing retrofit and upgrade activities to boost plant performance and emission control capabilities further support market expansion.

  • General Electric and Siemens are leading investments in advanced gas turbine technologies aimed at optimizing energy efficiency and reducing operational emissions.
  • Retrofit and modernization projects in chemical, petrochemical, and power generation industries are driving demand for high-performance turbine systems integrated with sustainability features.

United Kingdom Process Plants Gas Turbine Market Sales Outlook

The United Kingdom market for process-plants gas turbines is projected to expand at a CAGR of 3.5% through 2035. Growth is sustained by plant modernization efforts, emission reduction mandates, and industrial decarbonization policies. Reliability improvements via advanced monitoring and control systems are also supporting steady market progress.

  • Rolls-Royce and Siemens are developing turbines that prioritize energy efficiency, emission reduction, and operational reliability to meet stringent UK environmental standards.
  • The market benefits from a mature industrial base, with upgrades to existing infrastructure and the adoption of digital technologies to enhance turbine performance.

China Process Plants Gas Turbine Market Growth Analysis

Process-plants gas turbine market in China is expected to achieve a CAGR of 7.2% from 2025 to 2035. Growth is driven by rapid industrial expansion, increasing energy needs, and supportive government policies encouraging clean and efficient energy technologies. Digitalization and smart turbine systems are being widely deployed to improve plant productivity.

  • Domestic leaders like Shanghai Electric, along with global firms such as Mitsubishi Heavy Industries, are boosting production capacities to cater to rising demand across petrochemical and chemical sectors.
  • The government’s emphasis on emission control, technology upgrades, and industrial infrastructure development is accelerating the adoption of advanced gas turbine solutions.

India Process Plants Gas Turbine Market Expansion

Process-plants gas turbine market in India is projected to grow at a CAGR of 8.0%, the fastest among key markets, during the forecast period. Demand is being propelled by large-scale industrial infrastructure projects and government support for energy-efficient, low-emission technologies. The trend toward digital monitoring and predictive maintenance solutions enhances plant reliability and efficiency.

  • Larsen & Toubro and GE Power are investing heavily in turbine manufacturing and service to meet increasing demand from petrochemical and energy sectors.
  • Modernization, retrofit initiatives, and a shift toward sustainability-focused industrial practices are accelerating market penetration across India’s expanding process industries.

Japan Process Plants Gas Turbine Market Technological Advancements

Process-plants gas turbine market is expected to rise at a CAGR of 4.0% through 2035. Growth is underpinned by technological advancements and stringent government regulations aimed at reducing industrial emissions. Ongoing R&D and facility upgrades are also driving market development.
  • Mitsubishi Heavy Industries and Kawasaki Heavy Industries are pioneering the development of next-generation turbines offering superior efficiency and low emission profiles.
  • Strong demand from chemical processing and power generation industries, coupled with government incentives for sustainable technologies, is fueling the adoption of advanced turbine systems.

Leading Process Plants Gas Turbine Market Suppliers

Process Plants Gas Turbine Market Analysis By Company

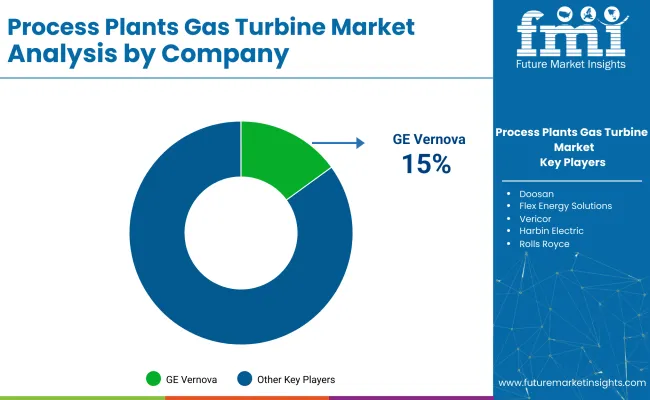
The process plants gas turbine market is structured across several tiers. Dominant players such as General Electric (GE Vernova), Siemens Energy, Mitsubishi Heavy Industries, and Rolls Royce lead the market with their broad product portfolios, large-scale manufacturing capacities, and substantial investments in advanced R&D.

These companies are setting industry standards by launching high-efficiency gas turbines with lower emissions. Key players, including Baker Hughes, AnsaldoEnergia, and Wärtsilä, focus on delivering specialized turbine solutions and catering to regional demands.

Emerging players such as Capstone Green Energy and Destinus Energy are emphasizing sustainable and innovative turbine technologies aimed at next-generation energy solutions. Market entry remains challenging due to high R&D investment requirements, strict regulatory standards, and the technical expertise needed for large-scale turbine production.

Recent Industry Developments

  • In February 2025, GE Vernova launched its next-generation HA gas turbine, designed for enhanced efficiency and reduced carbon emissions, supporting cleaner energy production in process plants.
  • In 2024, Siemens Energy introduced advanced digital twin technology aimed at optimizing gas turbine performance and predictive maintenance schedules, improving operational reliability and cost-efficiency.

Key Players in Process Plants Gas Turbine Market

  • AnsaldoEnergiaBaker Hughes
  • Bharat Heavy Electricals
  • Capstone Green Energy
  • Destinus Energy
  • Doosan
  • Flex Energy Solutions
  • GE Vernova
  • Harbin Electric
  • IHI Corporation
  • Kawasaki Heavy Industries
  • MAN Energy Solutions
  • Mitsubishi Heavy Industries
  • Nanjing Turbine & Electric Machinery
  • Rolls Royce
  • Shanghai Electric Gas Turbine
  • Siemens Energy
  • Solar Turbines
  • Vericor
  • Wärtsilä

Research Coverage and Scope Summary

Report Attributes Details
Current Total Market Size (2025) USD 2.43 billion
Projected Market Size (2035) USD 4.23 billion
CAGR (2025 to 2035) 5.7%
Base Year for Estimation 2024
Historical Period 2020 to 2024
Projections Period 2025 to 2035
Quantitative Units USD billion for value and thousand units for volume
Capacity Analyzed (Segment 1) ≤ 50 kW; > 50 kW to 500 kW; > 500 kW to 1 MW; > 1 MW to 30 MW; > 30 MW to 70 MW; > 70 MW to 200 MW; > 200 MW
Product Types Analyzed (Segment 2) Aero-derivative; Heavy duty
Technologies Analyzed (Segment 3) Open cycle; Combined cycle
Regions Covered North America; Europe; Asia-Pacific; Latin America; Middle East & Africa
Countries Covered United States; Canada; Mexico; United Kingdom; France; Germany; Russia; Italy; Netherlands; Finland; Greece; Denmark; Romania; Poland; Sweden; China; Australia; Japan; South Korea; Indonesia; Thailand; Malaysia; Bangladesh; Saudi Arabia; UAE; Qatar; Kuwait; Oman; Egypt; Turkey; Bahrain; Iraq; Jordan; Lebanon; South Africa; Nigeria; Algeria; Kenya; Ghana; Brazil; Argentina; Peru
Key Players Influencing the Market Ansaldo Energia; Baker Hughes; Bharat Heavy Electricals; Capstone Green Energy; Destinus Energy; Doosan; Flex Energy Solutions; GE Vernova; Harbin Electric; IHI Corporation; Kawasaki Heavy Industries; MAN Energy Solutions; Mitsubishi Heavy Industries; Nanjing Turbine & Electric Machinery; Rolls-Royce; Shanghai Electric Gas Turbine; Siemens Energy; Solar Turbines; Vericor; Wärtsilä
Additional Attributes Dollar share by capacity band; Product-type sales mix (aero-derivative vs. heavy duty); Cycle-type adoption trends (open vs. combined); Regional installation growth rates; Impact of emissions and efficiency regulations; Fuel-flexibility and hydrogen-ready technology uptake; Aftermarket services and maintenance contract trends

Key Segments

By Capacity:

The process plants gas turbine market is segmented by capacity into ≤ 50 kW, > 50 kW to 500 kW, > 500 kW to 1 MW, > 1 MW to 30 MW, > 30 MW to 70 MW, > 70 MW to 200 MW, and > 200 MW.

By Product:

By product, the market includes aero-derivative and heavy-duty gas turbines.

By Technology:

By technology, the market is categorized into open cycle and combined cycle.

By Region:

The market covers North America, Europe, Asia Pacific, Middle East & Africa, and Latin America.

Table of Content

  1. Executive Summary
  2. Market Overview
  3. Market Background
  4. Global Market Analysis 2020 to 2024 and Forecast 2025 to 2035
  5. Global Market Pricing Analysis 2020 to 2024 and Forecast 2025 to 2035
  6. Global Market Analysis 2020 to 2024 and Forecast 2025 to 2035, By Capacity
    • ≤ 50 kW
    • > 50 kW to 500 kW
    • > 500 kW to 1 MW
    • > 1 MW to 30 MW
    • > 30 MW to 70 MW
    • > 70 MW to 200 MW
    • > 200 MW
  7. Global Market Analysis 2020 to 2024 and Forecast 2025 to 2035, By Product
    • Aero-derivative
    • Heavy-duty Gas Turbines
  8. Global Market Analysis 2020 to 2024 and Forecast 2025 to 2035, By Technology
    • Open Cycle
    • Combined Cycle
  9. Global Market Analysis 2020 to 2024 and Forecast 2025 to 2035, By Region
    • North America
    • Latin America
    • Western Europe
    • Eastern Europe
    • East Asia
    • South Asia & Pacific
    • Middle East and Africa
  10. North America Market Analysis 2020 to 2024 and Forecast 2025 to 2035, By Country
  11. Latin America Market Analysis 2020 to 2024 and Forecast 2025 to 2035, By Country
  12. Western Europe Market Analysis 2020 to 2024 and Forecast 2025 to 2035, By Country
  13. Eastern Europe Market Analysis 2020 to 2024 and Forecast 2025 to 2035, By Country
  14. East Asia Market Analysis 2020 to 2024 and Forecast 2025 to 2035, By Country
  15. South Asia & Pacific Market Analysis 2020 to 2024 and Forecast 2025 to 2035, By Country
  16. Middle East and Africa Market Analysis 2020 to 2024 and Forecast 2025 to 2035, By Country
  17. Key Countries Market Analysis
  18. Market Structure Analysis
  19. Competition Analysis
    • Ansaldo Energia
    • Baker Hughes
    • Bharat Heavy Electricals
    • Capstone Green Energy
    • Destinus Energy
    • Doosan
    • Flex Energy Solutions
    • GE Vernova
    • Harbin Electric
    • IHI Corporation
    • Kawasaki Heavy Industries
    • MAN Energy Solutions
    • Mitsubishi Heavy Industries
    • Nanjing Turbine & Electric Machinery
    • Rolls Royce
    • Shanghai Electric Gas Turbine
    • Siemens Energy
    • Solar Turbines
    • Vericor
    • Wärtsilä
  20. Assumptions & Acronyms Used
  21. Research Methodology

List of Tables

  • Table 1: Global Market Value (USD Billion) Forecast by Region, 2020 to 2035
  • Table 2: Global Market Volume (megawatt) Forecast by Region, 2020 to 2035
  • Table 3: Global Market Value (USD Billion) Forecast by Capacity, 2020 to 2035
  • Table 4: Global Market Volume (megawatt) Forecast by Capacity, 2020 to 2035
  • Table 5: Global Market Value (USD Billion) Forecast by Product, 2020 to 2035
  • Table 6: Global Market Volume (megawatt) Forecast by Product, 2020 to 2035
  • Table 7: Global Market Value (USD Billion) Forecast by Technology, 2020 to 2035
  • Table 8: Global Market Volume (megawatt) Forecast by Technology, 2020 to 2035
  • Table 9: North America Market Value (USD Billion) Forecast by Country, 2020 to 2035
  • Table 10: North America Market Volume (megawatt) Forecast by Country, 2020 to 2035
  • Table 11: North America Market Value (USD Billion) Forecast by Capacity, 2020 to 2035
  • Table 12: North America Market Volume (megawatt) Forecast by Capacity, 2020 to 2035
  • Table 13: North America Market Value (USD Billion) Forecast by Product, 2020 to 2035
  • Table 14: North America Market Volume (megawatt) Forecast by Product, 2020 to 2035
  • Table 15: North America Market Value (USD Billion) Forecast by Technology, 2020 to 2035
  • Table 16: North America Market Volume (megawatt) Forecast by Technology, 2020 to 2035
  • Table 17: Latin America Market Value (USD Billion) Forecast by Country, 2020 to 2035
  • Table 18: Latin America Market Volume (megawatt) Forecast by Country, 2020 to 2035
  • Table 19: Latin America Market Value (USD Billion) Forecast by Capacity, 2020 to 2035
  • Table 20: Latin America Market Volume (megawatt) Forecast by Capacity, 2020 to 2035
  • Table 21: Latin America Market Value (USD Billion) Forecast by Product, 2020 to 2035
  • Table 22: Latin America Market Volume (megawatt) Forecast by Product, 2020 to 2035
  • Table 23: Latin America Market Value (USD Billion) Forecast by Technology, 2020 to 2035
  • Table 24: Latin America Market Volume (megawatt) Forecast by Technology, 2020 to 2035
  • Table 25: Western Europe Market Value (USD Billion) Forecast by Country, 2020 to 2035
  • Table 26: Western Europe Market Volume (megawatt) Forecast by Country, 2020 to 2035
  • Table 27: Western Europe Market Value (USD Billion) Forecast by Capacity, 2020 to 2035
  • Table 28: Western Europe Market Volume (megawatt) Forecast by Capacity, 2020 to 2035
  • Table 29: Western Europe Market Value (USD Billion) Forecast by Product, 2020 to 2035
  • Table 30: Western Europe Market Volume (megawatt) Forecast by Product, 2020 to 2035
  • Table 31: Western Europe Market Value (USD Billion) Forecast by Technology, 2020 to 2035
  • Table 32: Western Europe Market Volume (megawatt) Forecast by Technology, 2020 to 2035
  • Table 33: Eastern Europe Market Value (USD Billion) Forecast by Country, 2020 to 2035
  • Table 34: Eastern Europe Market Volume (megawatt) Forecast by Country, 2020 to 2035
  • Table 35: Eastern Europe Market Value (USD Billion) Forecast by Capacity, 2020 to 2035
  • Table 36: Eastern Europe Market Volume (megawatt) Forecast by Capacity, 2020 to 2035
  • Table 37: Eastern Europe Market Value (USD Billion) Forecast by Product, 2020 to 2035
  • Table 38: Eastern Europe Market Volume (megawatt) Forecast by Product, 2020 to 2035
  • Table 39: Eastern Europe Market Value (USD Billion) Forecast by Technology, 2020 to 2035
  • Table 40: Eastern Europe Market Volume (megawatt) Forecast by Technology, 2020 to 2035
  • Table 41: East Asia Market Value (USD Billion) Forecast by Country, 2020 to 2035
  • Table 42: East Asia Market Volume (megawatt) Forecast by Country, 2020 to 2035
  • Table 43: East Asia Market Value (USD Billion) Forecast by Capacity, 2020 to 2035
  • Table 44: East Asia Market Volume (megawatt) Forecast by Capacity, 2020 to 2035
  • Table 45: East Asia Market Value (USD Billion) Forecast by Product, 2020 to 2035
  • Table 46: East Asia Market Volume (megawatt) Forecast by Product, 2020 to 2035
  • Table 47: East Asia Market Value (USD Billion) Forecast by Technology, 2020 to 2035
  • Table 48: East Asia Market Volume (megawatt) Forecast by Technology, 2020 to 2035
  • Table 49: South Asia & Pacific Market Value (USD Billion) Forecast by Country, 2020 to 2035
  • Table 50: South Asia & Pacific Market Volume (megawatt) Forecast by Country, 2020 to 2035
  • Table 51: South Asia & Pacific Market Value (USD Billion) Forecast by Capacity, 2020 to 2035
  • Table 52: South Asia & Pacific Market Volume (megawatt) Forecast by Capacity, 2020 to 2035
  • Table 53: South Asia & Pacific Market Value (USD Billion) Forecast by Product, 2020 to 2035
  • Table 54: South Asia & Pacific Market Volume (megawatt) Forecast by Product, 2020 to 2035
  • Table 55: South Asia & Pacific Market Value (USD Billion) Forecast by Technology, 2020 to 2035
  • Table 56: South Asia & Pacific Market Volume (megawatt) Forecast by Technology, 2020 to 2035
  • Table 57: Middle East and Africa Market Value (USD Billion) Forecast by Country, 2020 to 2035
  • Table 58: Middle East and Africa Market Volume (megawatt) Forecast by Country, 2020 to 2035
  • Table 59: Middle East and Africa Market Value (USD Billion) Forecast by Capacity, 2020 to 2035
  • Table 60: Middle East and Africa Market Volume (megawatt) Forecast by Capacity, 2020 to 2035
  • Table 61: Middle East and Africa Market Value (USD Billion) Forecast by Product, 2020 to 2035
  • Table 62: Middle East and Africa Market Volume (megawatt) Forecast by Product, 2020 to 2035
  • Table 63: Middle East and Africa Market Value (USD Billion) Forecast by Technology, 2020 to 2035
  • Table 64: Middle East and Africa Market Volume (megawatt) Forecast by Technology, 2020 to 2035

List of Figures

  • Figure 1: Global Market Volume (megawatt) Forecast 2020 to 2035
  • Figure 2: Global Market Pricing Analysis
  • Figure 3: Global Market Value (USD Billion) Forecast 2020 to 2035
  • Figure 4: Global Market Value Share and BPS Analysis by Capacity, 2025 and 2035
  • Figure 5: Global Market Y-o-Y Growth Comparison by Capacity, 2025 to 2035
  • Figure 6: Global Market Attractiveness Analysis by Capacity
  • Figure 7: Global Market Value Share and BPS Analysis by Product, 2025 and 2035
  • Figure 8: Global Market Y-o-Y Growth Comparison by Product, 2025 to 2035
  • Figure 9: Global Market Attractiveness Analysis by Product
  • Figure 10: Global Market Value Share and BPS Analysis by Technology, 2025 and 2035
  • Figure 11: Global Market Y-o-Y Growth Comparison by Technology, 2025 to 2035
  • Figure 12: Global Market Attractiveness Analysis by Technology
  • Figure 13: Global Market Value (USD Billion) Share and BPS Analysis by Region, 2025 and 2035
  • Figure 14: Global Market Y-o-Y Growth Comparison by Region, 2025 to 2035
  • Figure 15: Global Market Attractiveness Analysis by Region
  • Figure 16: North America Market Incremental USD Opportunity, 2025 to 2035
  • Figure 17: Latin America Market Incremental USD Opportunity, 2025 to 2035
  • Figure 18: Western Europe Market Incremental USD Opportunity, 2025 to 2035
  • Figure 19: Eastern Europe Market Incremental USD Opportunity, 2025 to 2035
  • Figure 20: East Asia Market Incremental USD Opportunity, 2025 to 2035
  • Figure 21: South Asia & Pacific Market Incremental USD Opportunity, 2025 to 2035
  • Figure 22: Middle East and Africa Market Incremental USD Opportunity, 2025 to 2035
  • Figure 23: North America Market Value Share and BPS Analysis by Country, 2025 and 2035
  • Figure 24: North America Market Value Share and BPS Analysis by Capacity, 2025 and 2035
  • Figure 25: North America Market Y-o-Y Growth Comparison by Capacity, 2025 to 2035
  • Figure 26: North America Market Attractiveness Analysis by Capacity
  • Figure 27: North America Market Value Share and BPS Analysis by Product, 2025 and 2035
  • Figure 28: North America Market Y-o-Y Growth Comparison by Product, 2025 to 2035
  • Figure 29: North America Market Attractiveness Analysis by Product
  • Figure 30: North America Market Value Share and BPS Analysis by Technology, 2025 and 2035
  • Figure 31: North America Market Y-o-Y Growth Comparison by Technology, 2025 to 2035
  • Figure 32: North America Market Attractiveness Analysis by Technology
  • Figure 33: Latin America Market Value Share and BPS Analysis by Country, 2025 and 2035
  • Figure 34: Latin America Market Value Share and BPS Analysis by Capacity, 2025 and 2035
  • Figure 35: Latin America Market Y-o-Y Growth Comparison by Capacity, 2025 to 2035
  • Figure 36: Latin America Market Attractiveness Analysis by Capacity
  • Figure 37: Latin America Market Value Share and BPS Analysis by Product, 2025 and 2035
  • Figure 38: Latin America Market Y-o-Y Growth Comparison by Product, 2025 to 2035
  • Figure 39: Latin America Market Attractiveness Analysis by Product
  • Figure 40: Latin America Market Value Share and BPS Analysis by Technology, 2025 and 2035
  • Figure 41: Latin America Market Y-o-Y Growth Comparison by Technology, 2025 to 2035
  • Figure 42: Latin America Market Attractiveness Analysis by Technology
  • Figure 43: Western Europe Market Value Share and BPS Analysis by Country, 2025 and 2035
  • Figure 44: Western Europe Market Value Share and BPS Analysis by Capacity, 2025 and 2035
  • Figure 45: Western Europe Market Y-o-Y Growth Comparison by Capacity, 2025 to 2035
  • Figure 46: Western Europe Market Attractiveness Analysis by Capacity
  • Figure 47: Western Europe Market Value Share and BPS Analysis by Product, 2025 and 2035
  • Figure 48: Western Europe Market Y-o-Y Growth Comparison by Product, 2025 to 2035
  • Figure 49: Western Europe Market Attractiveness Analysis by Product
  • Figure 50: Western Europe Market Value Share and BPS Analysis by Technology, 2025 and 2035
  • Figure 51: Western Europe Market Y-o-Y Growth Comparison by Technology, 2025 to 2035
  • Figure 52: Western Europe Market Attractiveness Analysis by Technology
  • Figure 53: Eastern Europe Market Value Share and BPS Analysis by Country, 2025 and 2035
  • Figure 54: Eastern Europe Market Value Share and BPS Analysis by Capacity, 2025 and 2035
  • Figure 55: Eastern Europe Market Y-o-Y Growth Comparison by Capacity, 2025 to 2035
  • Figure 56: Eastern Europe Market Attractiveness Analysis by Capacity
  • Figure 57: Eastern Europe Market Value Share and BPS Analysis by Product, 2025 and 2035
  • Figure 58: Eastern Europe Market Y-o-Y Growth Comparison by Product, 2025 to 2035
  • Figure 59: Eastern Europe Market Attractiveness Analysis by Product
  • Figure 60: Eastern Europe Market Value Share and BPS Analysis by Technology, 2025 and 2035
  • Figure 61: Eastern Europe Market Y-o-Y Growth Comparison by Technology, 2025 to 2035
  • Figure 62: Eastern Europe Market Attractiveness Analysis by Technology
  • Figure 63: East Asia Market Value Share and BPS Analysis by Country, 2025 and 2035
  • Figure 64: East Asia Market Value Share and BPS Analysis by Capacity, 2025 and 2035
  • Figure 65: East Asia Market Y-o-Y Growth Comparison by Capacity, 2025 to 2035
  • Figure 66: East Asia Market Attractiveness Analysis by Capacity
  • Figure 67: East Asia Market Value Share and BPS Analysis by Product, 2025 and 2035
  • Figure 68: East Asia Market Y-o-Y Growth Comparison by Product, 2025 to 2035
  • Figure 69: East Asia Market Attractiveness Analysis by Product
  • Figure 70: East Asia Market Value Share and BPS Analysis by Technology, 2025 and 2035
  • Figure 71: East Asia Market Y-o-Y Growth Comparison by Technology, 2025 to 2035
  • Figure 72: East Asia Market Attractiveness Analysis by Technology
  • Figure 73: South Asia & Pacific Market Value Share and BPS Analysis by Country, 2025 and 2035
  • Figure 74: South Asia & Pacific Market Value Share and BPS Analysis by Capacity, 2025 and 2035
  • Figure 75: South Asia & Pacific Market Y-o-Y Growth Comparison by Capacity, 2025 to 2035
  • Figure 76: South Asia & Pacific Market Attractiveness Analysis by Capacity
  • Figure 77: South Asia & Pacific Market Value Share and BPS Analysis by Product, 2025 and 2035
  • Figure 78: South Asia & Pacific Market Y-o-Y Growth Comparison by Product, 2025 to 2035
  • Figure 79: South Asia & Pacific Market Attractiveness Analysis by Product
  • Figure 80: South Asia & Pacific Market Value Share and BPS Analysis by Technology, 2025 and 2035
  • Figure 81: South Asia & Pacific Market Y-o-Y Growth Comparison by Technology, 2025 to 2035
  • Figure 82: South Asia & Pacific Market Attractiveness Analysis by Technology
  • Figure 83: Middle East and Africa Market Value Share and BPS Analysis by Country, 2025 and 2035
  • Figure 84: Middle East and Africa Market Value Share and BPS Analysis by Capacity, 2025 and 2035
  • Figure 85: Middle East and Africa Market Y-o-Y Growth Comparison by Capacity, 2025 to 2035
  • Figure 86: Middle East and Africa Market Attractiveness Analysis by Capacity
  • Figure 87: Middle East and Africa Market Value Share and BPS Analysis by Product, 2025 and 2035
  • Figure 88: Middle East and Africa Market Y-o-Y Growth Comparison by Product, 2025 to 2035
  • Figure 89: Middle East and Africa Market Attractiveness Analysis by Product
  • Figure 90: Middle East and Africa Market Value Share and BPS Analysis by Technology, 2025 and 2035
  • Figure 91: Middle East and Africa Market Y-o-Y Growth Comparison by Technology, 2025 to 2035
  • Figure 92: Middle East and Africa Market Attractiveness Analysis by Technology
  • Figure 93: Global Market - Tier Structure Analysis
  • Figure 94: Global Market - Company Share Analysis

Frequently Asked Questions

What is the projected size of the process plants gas turbine market by 2035?

The market is expected to reach USD 4.23 billion by 2035.

What is the estimated market size of the process plants gas turbine market in 2025?

The market is projected to be valued at USD 2.43 billion in 2025.

Who is the Leading player in the process plants gas turbine market?

GE Vernova is the leading players in the market with 15% market Share.

What is the CAGR of the process plants gas turbine market from 2025 to 2035?

The CAGR is 5.7% from 2025 to 2035.

Which is the Fastest Growing Country in the Market?

India is the fastest growing country in the market with CAGR 8%.

Explore Energy Generation & Conversion Insights

Future Market Insights

Process Plants Gas Turbine Market