Reports

- Global Locations -

Headquarters

Future Market Insights, Inc.

Christiana Corporate, 200
Continental Drive, Suite 401,
Newark, Delaware - 19713,
United States

T: +1-845-579-5705

Americas

Future Market Insights, Inc.

616 Corporate Way, Suite 2-9018,
Valley Cottage, NY 10989, United States

T: +1-347-918-3531

MEA

Future Market Insights

1602-6 Jumeirah Bay X2 Tower, Plot No: JLT-PH2-X2A,
Jumeirah Lakes Towers, Dubai,
United Arab Emirates

Europe

Future Market Insights

3rd Floor, 207 Regent Street,
W1B 3HH London
United Kingdom

T: + 44 (0) 20 8123 9659
D: +44 (0) 20 3287 4268

Asia Pacific

Future Market Insights

IndiaLand Global Tech Park, Unit UG-1, Behind Grand HighStreet, Phase 1, Hinjawadi, MH, Pune – 411057, India

Process Spectroscopy Market Snapshot (2022 to 2032)

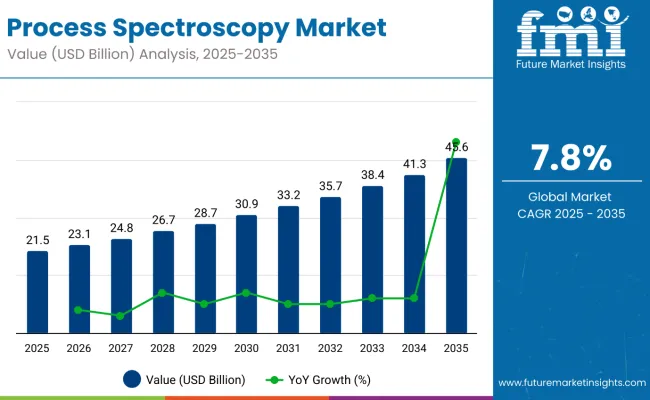
The global process spectroscopy market is projected to expand steadily at a CAGR of 7.1% value, during the forecast period from 2022 to 2032. In the year 2022, the market size is expected to be worth US$ 19.2 Billion. Following the increasing demand in the global market, the Process spectroscopy market is expected to reach US$ 38.12 Billion by 2032.

Data Points Key Statistics
Global Growth Rate (2022 to 2032) 7.1% CAGR
Process spectroscopy market value 2022 US$ 19.2 Billion
Process spectroscopy market projected value (2032) US$ 38.12 Billion

Process spectroscopy is a technology that employs spectroscopy, which is the study of the interplay between matter and electromagnetic waves. A spectrometer generates signals that can be utilized to perform in-process and online measurements on a product sample. Spectrometry approaches include near-infrared (NIR) spectroscopy, Fourier Transform infrared (FT-IR) spectroscopy, Raman spectroscopy, and others. The signals produced are utilized to regulate or monitor the production process of the product.

The significant market development can be attributed to the growing use of spectroscopic methods in the pharmaceutical as well as food and agriculture sectors. The increased awareness of quality food and medications, along with different rules and regulations set by the government and related organizations, are likely to fuel global market expansion during the forecast period.

Increasing efforts in the pharmaceutical business to conduct progressive Research and Development result in the increased usage of numerous spectroscopic techniques during the forecast period. As industries are becoming more aware of the importance of product quality, the technique is expected to increase rapidly. Reduced operational spending is another factor that is projected to drive market expansion over the forecast period.

Significant research and development operations are carried out, which results in several medicinal discoveries. As the number of drug development procedures grows, so will the number of therapy choices for various diseases. Increasing demand for spectroscopic methods and related equipment installations around the world is expected to drive market expansion over the forecast period. The process spectroscopy market is predicted to grow rapidly throughout the forecast period, owing to increased awareness of premium spectroscopic instruments among end-use industries.

Don't pay for what you don't need

Customize your report by selecting specific countries or regions and save 30%!

2017 to 2021 Process Spectroscopy Demand Analysis Vs Forecast 2022 to 2032

According to market research and competitive intelligence provider Future Market Insights- the market for process, spectroscopy reflected a value CAGR worth 6.5% during the historical period, 2017 to 2021. The most difficult part of the COVID-19 pandemic has been the absence of testing required to detect and diagnose illnesses. There were already various biochemical tests accessible, however, they were difficult and expensive.

As a result, some researchers are attempting to build a new coronavirus test technique based on physics rather than bio-chemicals, which might produce a low rate of false negatives, be quick and cheap, and have high sensitivity specificity.

However, as a result of the FDA framework's Process Analytical Technology (PAT) standards, spectroscopy instruments are gradually gaining popularity in the pharmaceutical business. And for its low cost of analysis and great accuracy, the Raman spectroscopy device is renowned in the pharmaceutical business. It is in high demand in the agricultural business due to its capacity to retrieve physical and chemical data from samples without destroying them, allowing for speedier examination. Handheld and portable instruments are expected to grow in popularity. Wi-Fi connectivity is used by these instruments to transfer data to a compatible device. Such advancements are expected to boost the process spectroscopy market demand by 2032.

Process Spectroscopy Market

Prominent Growth Drivers Influencing Process Spectroscopy Industry

Growing emphasis to meet International Quality Standards to accelerate Market Growth

Many sectors throughout the world, including food and beverage, pharmaceutical, chemical, and agriculture, are working to improve product quality in order to meet worldwide standards of quality like ISO or Six Sigma certification. There are currently approximately 162 standard groups representing ISO in various nations.

According to Six Sigma data, more than 150 organizations worldwide have claimed to have effectively applied Six Sigma frameworks for their activities. These certifications apply to both corporate operations and the manufacturing of products within an industry. Consumers are increasingly seeking high-quality packaged foods, medications, agricultural seeds, and chemicals. As a result, these factors are projected to boost the worldwide process spectroscopy market during the forecast period.

Increasing Emphasis on Avoiding Variable Rework Costs and Scrap will propel Market Growth

Process spectroscopy enables product makers to control and supervise the entire manufacturing process. Spectroscopy is used to assess and test the quality of the raw materials, as well as to perform quality checks at each stage of manufacturing. This also assists product makers, particularly those in the pharmaceutical, food products, and chemical industries, in analyzing and forecasting the quality of the final product. If the results at any phase are negative, manufacturing is terminated at that point.

This reduces the amount of rework and scrap generated at the end of the operation. Furthermore, it lowers the expense of maintaining large stockpiles, reducing time to market. As a result, these factors are projected to boost the worldwide process spectroscopy market during the forecast period.

Sudip Saha
Sudip Saha

Principal Consultant

Talk to Analyst

Find your sweet spots for generating winning opportunities in this market.

What could Possibly Hinder Process Spectroscopy Deployment?

High Capital Investment and Dearth of Skilled Workforce to Impede Market Growth

Despite its multiple benefits, process spectrometry has numerous hurdles, including a significant capital commitment. The construction and deployment of spectroscopes are both expensive. Spectroscope manufacturers charge exorbitant rates for these gadgets, limiting their availability. Furthermore, the spectroscope necessitates significant operational and maintenance costs, raising the total expenditure. As a result, these factors are projected to limit the global process spectroscopy market's demand during the forecast period.

To operate and handle a spectroscope, professional persons with proper training and experience are required. If workers are untrained, suitable training must be provided, incurring additional costs. As a result, these factors are projected to impede the growth of the worldwide process spectroscopy market over the forecast period.

Category-wise Insights

Which Technology is forecast to gain the Maximum Market Share?

Molecular Spectroscopy likely gains the Maximum Share

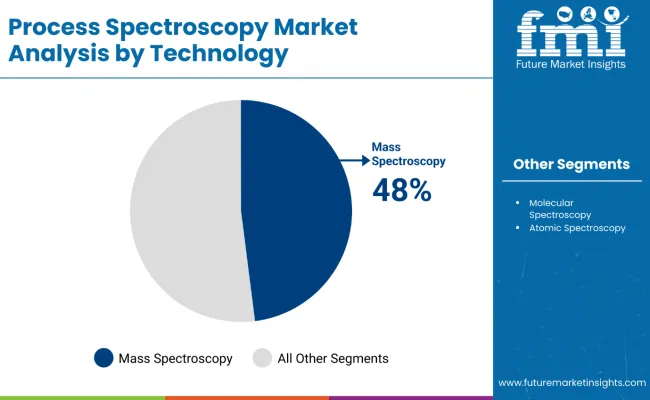
In the technology segment, molecular spectroscopy led the market in 2021. This category is predicted to account for 45.2% of global sales in 2022 and will continue to contribute considerably to growth during the projection period. In 2021, the total number of molecular and atomic spectroscopy exports was 278,342 units and 318,765 units, respectively. By 2032, molecular and atomic spectroscopy shipment units are predicted to expand to 558,689 units and 592,043 units, respectively.

Near Infrared (NIR), Raman, Fourier-Transform Infrared (FT-IR), and Nuclear Magnetic Resonance (NMR) technology are the subdivisions of the molecular spectroscopy section. Miniaturization of molecular spectroscopy devices, as well as advancements in Raman technologies, are projected to drive market expansion. Increasing demand in the pharmaceutical and life sciences industries, as well as significant demand in the chemical and petrochemical industries.

Which Component is forecast to grow the fastest during the Forecast Period?

Process Spectroscopy Hardware to experience Maximum Uptake

By component type, the hardware segment led the market in 2021 and is predicted to account for more than 76.5% of global revenue in 2022. Because of the rising employment of spectroscopic techniques, the segment is expected to dominate during the forecast period.

Due to the frequent changes in requirements by the EMA and the USA FDA, companies all over the world are focusing on producing portable spectrometer hardware tools for instantaneous findings. This saves time and lowers the cost of scrap. Furthermore, these devices are linked to a computer via wireless connections to directly save information on a storage disc. These variables present prospective prospects for process spectroscopy firms.

Which Application Segment Is Likely To Gain The Most Popularity During The Forecast Period?

The pharmaceutical segment is expected to grow rapidly during the forecast period

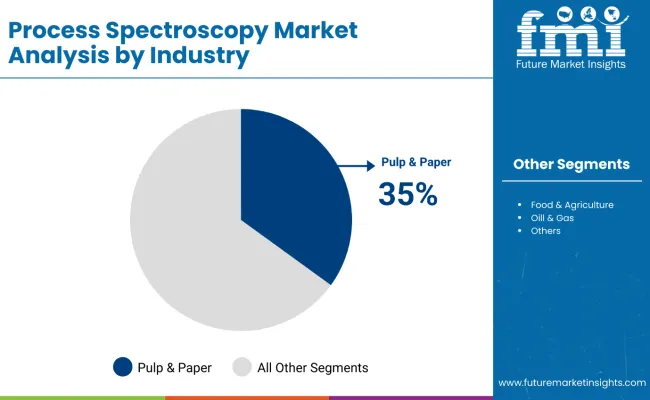
In 2022, the pharmaceutical segment is expected to account for 31.5% of total revenue. In 2021, the pharmaceutical and food, and agricultural areas contributed significantly to revenue. Because of the rising employment of spectroscopic techniques, the pharmaceutical segment is expected to dominate during the projection period.

Additionally, drug producers utilize process spectroscopes to evaluate a substance's material porosity for quality control and to evaluate the state of the compositions. The pressing necessity to manufacture medicines and treatments without sacrificing quality is driving the market.

Get the data you need at a Fraction of the cost

Personalize your report by choosing insights you need
and save 40%!

Region-wise Analysis

What is the Outlook of the North American Process Spectroscopy Market?

The need to enhance product quality will boost Market Growth

North America is predicted to have the greatest revenue share of more than 43.5% in 2022 and to continue its dominance throughout the estimated period. Because of rising shale gas production in the United States and Canada, the market is undergoing a substantial transition across North America.

The region has the infrastructure for varied Research and Development across all major industrial sectors, including pharmaceutical, food and beverage, and chemicals, and has the potential for investments in various technical breakthroughs. These industries demand the need for process spectroscopy to analyze and maintain quality.

The players in this region are mostly inclined to use Process analytical technology (PAT) to regulate, analyze, and develop numerous manufacturing operations in order to improve the overall quality of the products. The PAT framework was developed by the USA Food and Drug Administration (FDA) to ensure high-quality performance. This has resulted in widespread acceptance among pharmaceutical corporations in the United States. The prospective impact of this approach on the process spectroscopy market in the United States is predicted to be felt over the next 10 years.

How is the growth of Process Spectroscopy unfolding across the Asia Pacific?

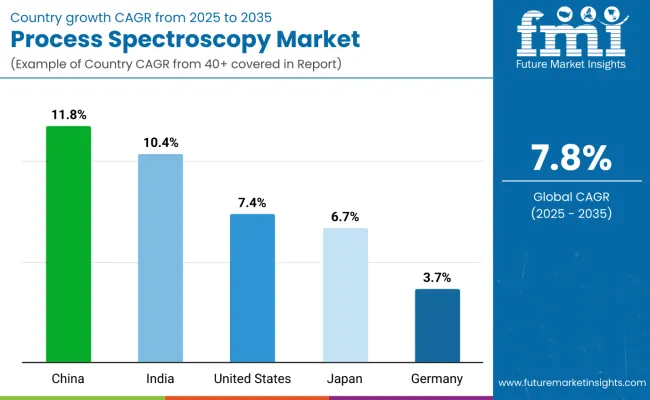
Asia Pacific is expected to grow at the fastest rate over the projected period, owing to the region's strong manufacturing powerhouse and advances in Research and Development techniques. A CAGR of 6.8% can be expected from 2022 to 2032.

The use of spectroscopic techniques for refining, producing, and distributing oil and gas in these countries is leading to an increase in the adoption of spectroscopy equipment and procedures, which is propelling the overall market at a rapid rate. All of these variables have expanded the application of spectroscopic techniques, which has aided regional growth significantly.

Rising public awareness of high quality and standards is likely to compel players to follow worldwide quality standards norms. Companies have been taking quality measures in order to obtain these certifications to improve brand reputation. These quality measures are expected to provide benefits such as increased process efficiency, improved product quality, and cost savings. Such advancements will hasten demand in the Asia-Pacific area.

What will be the outlook of the European Process Spectroscopy Market?

During the projection period, the European Process spectroscopy market would increase at a CAGR of 6.5%. This region is likely to grow significantly in the near future due to the increasing public awareness towards enhancing product quality, especially in the food and beverages sectors.

Various EU countries have abundant resources such as labor and land. In these countries, the cost of land and labor is much lower than in other regions of the world. This provides attractive chances for corporations to develop manufacturing plants in specific regions. And this is expected to enhance the market demand for process spectroscopy during the forecast period in the European region.

Start-up scenario

The top ten start-ups in this market include- ChrysaLabs, Fotenix, Polariks, Senorics, BharatRohan, Monstrsense, APPLIED INSTRUMENT TECHNOLOGIES, Mesa Photonics, LLC, Headwall Photonics, Inc. and Applied Spectra, Inc.

  • ChrysaLabs, a Canadian firm, makes a portable spectroscopic sensor that maps soil samples instantaneously. Their unique interface quickly measures soil nutrients, moisture, pH, and organic matter by combining near-infrared spectroscopy with the help of artificial intelligence (AI). The geotagged test results generate fertilization maps in real-time.
  • Fotenix, a UK-based firm, creates analytics solutions that utilize spectroscopy in the visible and near-infrared (VIS-NIR) regions. It provides significantly more quantifiable data than farmers' visual assessment. This enables systems to optimize the quality and quantity of products by adjusting irrigation or nutrient levels.

Competitive Landscape 

Companies are working on lowering variable costs by reducing rework and errors. This equipment allows for efficient and productive monitoring and control, as well as quality control, which will boost process spectroscopy market share throughout the forecast timeframe. In order to obtain a competitive advantage, corporations have reduced their prices while increasing their quality.

  • Agilent released new mass spectrometry and automation software solutions in 2021, including MassHunter Workstation Plus 11.0, MassHunter Networked Workstation 11.0, and MassHunter BioConfirm. The most recent version of this software ensures data integrity in accordance with US FDA and EU EMEA standards, including checksums, user management, tamper detection, and audit trails for Quantitative Analysis, MassHunter Acquisition, and MassHunter BioConfirm. The first shipments are scheduled for July, with quotations available in May.
  • SCIEX launched a unique accurate mass LC-MS/MS device for biotherapeutics in 2021. The new method allows scientists to identify, classify, and quantify molecules more accurately than ever before by generating previously unachievable data. This finding will help to progress the development of novel precision diagnostics and biotherapeutics by resolving genuine analytical problems.

Report Scope

Report Attributes Details
Growth Rate CAGR of 7.1% from 2022 to 2032
Market Value for 2022 US$ 19.2 Billion
Market Value for 2032 US$ 38.12 Billion
Base Year for Estimation 2021
Historical Data 2017 to 2021
Forecast Period 2022 to 2032
Quantitative Units USD Billion for Value
Report Coverage Revenue Forecast, Volume Forecast, Company Ranking, Competitive Landscape, Growth Factors, Trends, and Pricing Analysis
Segments Covered
  • Technology
  • Application
  • Component
  • Region
Regions Covered
  • North America
  • Latin America
  • Europe
  • Asia Pacific
  • Middle East & Africa
Key Countries Profiled
  • United States of America
  • Canada
  • Brazil
  • Mexico
  • Germany
  • United Kingdom
  • France
  • Spain
  • Italy
  • China
  • Japan
  • South Korea
  • Malaysia
  • Singapore
  • Australia
  • New Zealand
  • GCC Countries
  • South Africa
  • Israel
Key Companies Profiled
  • ABB Group
  • Bruker
  • Agilent Technologies, Inc.
  • Danaher Corporation
  • Buchi Labortechnik AG
  • Foss
  • SCIEX
  • Kaiser Optical Systems, Inc.
  • HORIBA, Ltd
  • Kett Electric Laboratory
  • Sartorius AG
  • Thermo Fisher Scientific, Inc.
  • Shimadzu Corporation
  • Yokogawa Electric Corporation
Report Customization & Pricing Available upon Request

Key Segments Covered in the Process Spectroscopy Market Report

By Technology:

  • Molecular
    • NIR
    • FT-IR
    • Raman
    • NMR
    • Others
  • Mass
  • Atomic

By Application:

  • Polymer Production
  • Water & Wastewater Treatment
  • Oil & Gas
  • Food & Agriculture
  • Pharmaceutical Applications
  • Metal & Mining
  • Pulp & Paper
  • Chemical Manufacturing
  • Other Applications

By Component:

  • Hardware
  • Software

By Region:

  • North America
  • Latin America
  • Europe
  • Asia-Pacific
  • Middle East and Africa (MEA)

Frequently Asked Questions

At what rate did the Process spectroscopy market flourish from 2017 to 2021?

From 2017 to 2021, the Process spectroscopy market grew at a CAGR of 6.5%

What is the outlook of the process spectroscopy market during the forecast period?

The process spectroscopy market is expected to grow with a 7.1% CAGR, projected to reach US$ 38.12 Billion by 2032

Which segment is expected to dominate the global process spectroscopy market during 2022?

In 2022, the hardware segment by component type is expected to dominate the global market with a revenue share of 76.5%

Which application segment of process spectroscopy will dominate during the forecast period?

The pharmaceutical segment is expected to have a market share of more than 31% in 2022

How did the process spectroscopy market In North America is projected to flourish during 2022?

The North American process spectroscopy market is expected to hold a 43.5% global market share in 2021

What was the outlook of the Asia Pacific process spectroscopy market during 2022?

Asia Pacific is expected to grow steadily with a CAGR of 6.8% by 2022.

Table of Content

1. Executive Summary | Process Spectroscopy Market

    1.1. Global Market Outlook

    1.2. Demand-side Trends

    1.3. Supply-side Trends

    1.4. Technology Roadmap Analysis

    1.5. Analysis and Recommendations

2. Market Overview

    2.1. Market Coverage / Taxonomy

    2.2. Market Definition / Scope / Limitations

3. Market Background

    3.1. Market Dynamics

        3.1.1. Drivers

        3.1.2. Restraints

        3.1.3. Opportunity

        3.1.4. Trends

    3.2. Scenario Forecast

        3.2.1. Demand in Optimistic Scenario

        3.2.2. Demand in Likely Scenario

        3.2.3. Demand in Conservative Scenario

    3.3. Opportunity Map Analysis

    3.4. Investment Feasibility Matrix

    3.5. PESTLE and Porter’s Analysis

    3.6. Regulatory Landscape

        3.6.1. By Key Regions

        3.6.2. By Key Countries

    3.7. Regional Parent Market Outlook

4. Global Market Analysis 2017 to 2021 and Forecast, 2022 to 2032

    4.1. Historical Market Size Value (US$ Million) Analysis, 2017 to 2021

    4.2. Current and Future Market Size Value (US$ Million) Projections, 2022 to 2032

        4.2.1. Y-o-Y Growth Trend Analysis

        4.2.2. Absolute Opportunity Analysis

5. Global Market Analysis 2017 to 2021 and Forecast 2022 to 2032, By Technology

    5.1. Introduction / Key Findings

    5.2. Historical Market Size Value (US$ Million) Analysis By Technology, 2017 to 2021

    5.3. Current and Future Market Size Value (US$ Million) Analysis and Forecast By Technology, 2022 to 2032

        5.3.1. Molecular Spectroscopy

            5.3.1.1. NIR

            5.3.1.2. FT-IR

            5.3.1.3. Raman

            5.3.1.4. NMR

        5.3.2. Mass Spectroscopy

        5.3.3. Atomic Spectroscopy

    5.4. Y-o-Y Growth Trend Analysis By Technology, 2017 to 2021

    5.5. Absolute Opportunity Analysis By Technology, 2022 to 2032

6. Global Market Analysis 2017 to 2021 and Forecast 2022 to 2032, By Application

    6.1. Introduction / Key Findings

    6.2. Historical Market Size Value (US$ Million) Analysis By Application, 2017 to 2021

    6.3. Current and Future Market Size Value (US$ Million) Analysis and Forecast By Application, 2022 to 2032

        6.3.1. Polymer

        6.3.2. Oil & Gas

        6.3.3. Pharmaceutical

        6.3.4. Food & Agriculture

        6.3.5. Chemical

        6.3.6. Water & Wastewater

        6.3.7. Pulp & Paper

        6.3.8. Metal & Mining

        6.3.9. Others

    6.4. Y-o-Y Growth Trend Analysis By Application, 2017 to 2021

    6.5. Absolute Opportunity Analysis By Application, 2022 to 2032

7. Global Market Analysis 2017 to 2021 and Forecast 2022 to 2032, By Component

    7.1. Introduction / Key Findings

    7.2. Historical Market Size Value (US$ Million) Analysis By Component, 2017 to 2021

    7.3. Current and Future Market Size Value (US$ Million) Analysis and Forecast By Component, 2022 to 2032

        7.3.1. Hardware

        7.3.2. Software

    7.4. Y-o-Y Growth Trend Analysis By Component, 2017 to 2021

    7.5. Absolute Opportunity Analysis By Component, 2022 to 2032

8. Global Market Analysis 2017 to 2021 and Forecast 2022 to 2032, By Region

    8.1. Introduction

    8.2. Historical Market Size Value (US$ Million) Analysis By Region, 2017 to 2021

    8.3. Current Market Size Value (US$ Million) Analysis and Forecast By Region, 2022 to 2032

        8.3.1. North America

        8.3.2. Latin America

        8.3.3. Europe

        8.3.4. Asia Pacific

        8.3.5. Middle East and Africa

    8.4. Market Attractiveness Analysis By Region

9. North America Market Analysis 2017 to 2021 and Forecast 2022 to 2032, By Country

    9.1. Historical Market Size Value (US$ Million) Trend Analysis By Market Taxonomy, 2017 to 2021

    9.2. Market Size Value (US$ Million) Forecast By Market Taxonomy, 2022 to 2032

        9.2.1. By Country

            9.2.1.1. United States of America

            9.2.1.2. Canada

        9.2.2. By Technology

        9.2.3. By Application

        9.2.4. By Component

    9.3. Market Attractiveness Analysis

        9.3.1. By Country

        9.3.2. By Technology

        9.3.3. By Application

        9.3.4. By Component

    9.4. Key Takeaways

10. Latin America Market Analysis 2017 to 2021 and Forecast 2022 to 2032, By Country

    10.1. Historical Market Size Value (US$ Million) Trend Analysis By Market Taxonomy, 2017 to 2021

    10.2. Market Size Value (US$ Million) Forecast By Market Taxonomy, 2022 to 2032

        10.2.1. By Country

            10.2.1.1. Brazil

            10.2.1.2. Mexico

            10.2.1.3. Rest of Latin America

        10.2.2. By Technology

        10.2.3. By Application

        10.2.4. By Component

    10.3. Market Attractiveness Analysis

        10.3.1. By Country

        10.3.2. By Technology

        10.3.3. By Application

        10.3.4. By Component

    10.4. Key Takeaways

11. Europe Market Analysis 2017 to 2021 and Forecast 2022 to 2032, By Country

    11.1. Historical Market Size Value (US$ Million) Trend Analysis By Market Taxonomy, 2017 to 2021

    11.2. Market Size Value (US$ Million) Forecast By Market Taxonomy, 2022 to 2032

        11.2.1. By Country

            11.2.1.1. Germany

            11.2.1.2. United Kingdom

            11.2.1.3. France

            11.2.1.4. Spain

            11.2.1.5. Italy

            11.2.1.6. Rest of Europe

        11.2.2. By Technology

        11.2.3. By Application

        11.2.4. By Component

    11.3. Market Attractiveness Analysis

        11.3.1. By Country

        11.3.2. By Technology

        11.3.3. By Application

        11.3.4. By Component

    11.4. Key Takeaways

12. Asia Pacific Market Analysis 2017 to 2021 and Forecast 2022 to 2032, By Country

    12.1. Historical Market Size Value (US$ Million) Trend Analysis By Market Taxonomy, 2017 to 2021

    12.2. Market Size Value (US$ Million) Forecast By Market Taxonomy, 2022 to 2032

        12.2.1. By Country

            12.2.1.1. China

            12.2.1.2. Japan

            12.2.1.3. South Korea

            12.2.1.4. India

            12.2.1.5. Malaysia

            12.2.1.6. Singapore

            12.2.1.7. Australia

            12.2.1.8. New Zealand

            12.2.1.9. Rest of Asia-Pacific (APAC)

        12.2.2. By Technology

        12.2.3. By Application

        12.2.4. By Component

    12.3. Market Attractiveness Analysis

        12.3.1. By Country

        12.3.2. By Technology

        12.3.3. By Application

        12.3.4. By Component

    12.4. Key Takeaways

13. Middle East and Africa Market Analysis 2017 to 2021 and Forecast 2022 to 2032, By Country

    13.1. Historical Market Size Value (US$ Million) Trend Analysis By Market Taxonomy, 2017 to 2021

    13.2. Market Size Value (US$ Million) Forecast By Market Taxonomy, 2022 to 2032

        13.2.1. By Country

            13.2.1.1. GCC Countries

            13.2.1.2. South Africa

            13.2.1.3. Israel

            13.2.1.4. Rest of Middle East and Africa

        13.2.2. By Technology

        13.2.3. By Application

        13.2.4. By Component

    13.3. Market Attractiveness Analysis

        13.3.1. By Country

        13.3.2. By Technology

        13.3.3. By Application

        13.3.4. By Component

    13.4. Key Takeaways

14. Key Countries Market Analysis

    14.1. United States of America

        14.1.1. Pricing Analysis

        14.1.2. Market Share Analysis, 2021

            14.1.2.1. By Technology

            14.1.2.2. By Application

            14.1.2.3. By Component

    14.2. Canada

        14.2.1. Pricing Analysis

        14.2.2. Market Share Analysis, 2021

            14.2.2.1. By Technology

            14.2.2.2. By Application

            14.2.2.3. By Component

    14.3. Brazil

        14.3.1. Pricing Analysis

        14.3.2. Market Share Analysis, 2021

            14.3.2.1. By Technology

            14.3.2.2. By Application

            14.3.2.3. By Component

    14.4. Mexico

        14.4.1. Pricing Analysis

        14.4.2. Market Share Analysis, 2021

            14.4.2.1. By Technology

            14.4.2.2. By Application

            14.4.2.3. By Component

    14.5. Germany

        14.5.1. Pricing Analysis

        14.5.2. Market Share Analysis, 2021

            14.5.2.1. By Technology

            14.5.2.2. By Application

            14.5.2.3. By Component

    14.6. United Kingdom

        14.6.1. Pricing Analysis

        14.6.2. Market Share Analysis, 2021

            14.6.2.1. By Technology

            14.6.2.2. By Application

            14.6.2.3. By Component

    14.7. France

        14.7.1. Pricing Analysis

        14.7.2. Market Share Analysis, 2021

            14.7.2.1. By Technology

            14.7.2.2. By Application

            14.7.2.3. By Component

    14.8. Spain

        14.8.1. Pricing Analysis

        14.8.2. Market Share Analysis, 2021

            14.8.2.1. By Technology

            14.8.2.2. By Application

            14.8.2.3. By Component

    14.9. Italy

        14.9.1. Pricing Analysis

        14.9.2. Market Share Analysis, 2021

            14.9.2.1. By Technology

            14.9.2.2. By Application

            14.9.2.3. By Component

    14.10. China

        14.10.1. Pricing Analysis

        14.10.2. Market Share Analysis, 2021

            14.10.2.1. By Technology

            14.10.2.2. By Application

            14.10.2.3. By Component

    14.11. Japan

        14.11.1. Pricing Analysis

        14.11.2. Market Share Analysis, 2021

            14.11.2.1. By Technology

            14.11.2.2. By Application

            14.11.2.3. By Component

    14.12. South Korea

        14.12.1. Pricing Analysis

        14.12.2. Market Share Analysis, 2021

            14.12.2.1. By Technology

            14.12.2.2. By Application

            14.12.2.3. By Component

    14.13. Malaysia

        14.13.1. Pricing Analysis

        14.13.2. Market Share Analysis, 2021

            14.13.2.1. By Technology

            14.13.2.2. By Application

            14.13.2.3. By Component

    14.14. Singapore

        14.14.1. Pricing Analysis

        14.14.2. Market Share Analysis, 2021

            14.14.2.1. By Technology

            14.14.2.2. By Application

            14.14.2.3. By Component

    14.15. Australia

        14.15.1. Pricing Analysis

        14.15.2. Market Share Analysis, 2021

            14.15.2.1. By Technology

            14.15.2.2. By Application

            14.15.2.3. By Component

    14.16. New Zealand

        14.16.1. Pricing Analysis

        14.16.2. Market Share Analysis, 2021

            14.16.2.1. By Technology

            14.16.2.2. By Application

            14.16.2.3. By Component

    14.17. GCC Countries

        14.17.1. Pricing Analysis

        14.17.2. Market Share Analysis, 2021

            14.17.2.1. By Technology

            14.17.2.2. By Application

            14.17.2.3. By Component

    14.18. South Africa

        14.18.1. Pricing Analysis

        14.18.2. Market Share Analysis, 2021

            14.18.2.1. By Technology

            14.18.2.2. By Application

            14.18.2.3. By Component

    14.19. Israel

        14.19.1. Pricing Analysis

        14.19.2. Market Share Analysis, 2021

            14.19.2.1. By Technology

            14.19.2.2. By Application

            14.19.2.3. By Component

15. Market Structure Analysis

    15.1. Competition Dashboard

    15.2. Competition Benchmarking

    15.3. Market Share Analysis of Top Players

        15.3.1. By Regional

        15.3.2. By Technology

        15.3.3. By Application

        15.3.4. By Component

16. Competition Analysis

    16.1. Competition Deep Dive

        16.1.1. ABB Group

            16.1.1.1. Overview

            16.1.1.2. Product Portfolio

            16.1.1.3. Profitability by Market Segments

            16.1.1.4. Sales Footprint

            16.1.1.5. Strategy Overview

                16.1.1.5.1. Marketing Strategy

        16.1.2. Agilent Technologies, Inc.

            16.1.2.1. Overview

            16.1.2.2. Product Portfolio

            16.1.2.3. Profitability by Market Segments

            16.1.2.4. Sales Footprint

            16.1.2.5. Strategy Overview

                16.1.2.5.1. Marketing Strategy

        16.1.3. Bruker

            16.1.3.1. Overview

            16.1.3.2. Product Portfolio

            16.1.3.3. Profitability by Market Segments

            16.1.3.4. Sales Footprint

            16.1.3.5. Strategy Overview

                16.1.3.5.1. Marketing Strategy

        16.1.4. Buchi Labortechnik AG

            16.1.4.1. Overview

            16.1.4.2. Product Portfolio

            16.1.4.3. Profitability by Market Segments

            16.1.4.4. Sales Footprint

            16.1.4.5. Strategy Overview

                16.1.4.5.1. Marketing Strategy

        16.1.5. Danaher Corporation

            16.1.5.1. Overview

            16.1.5.2. Product Portfolio

            16.1.5.3. Profitability by Market Segments

            16.1.5.4. Sales Footprint

            16.1.5.5. Strategy Overview

                16.1.5.5.1. Marketing Strategy

        16.1.6. Foss

            16.1.6.1. Overview

            16.1.6.2. Product Portfolio

            16.1.6.3. Profitability by Market Segments

            16.1.6.4. Sales Footprint

            16.1.6.5. Strategy Overview

                16.1.6.5.1. Marketing Strategy

        16.1.7. Kaiser Optical Systems, Inc

            16.1.7.1. Overview

            16.1.7.2. Product Portfolio

            16.1.7.3. Profitability by Market Segments

            16.1.7.4. Sales Footprint

            16.1.7.5. Strategy Overview

                16.1.7.5.1. Marketing Strategy

        16.1.8. Kett Electric Laboratory

            16.1.8.1. Overview

            16.1.8.2. Product Portfolio

            16.1.8.3. Profitability by Market Segments

            16.1.8.4. Sales Footprint

            16.1.8.5. Strategy Overview

                16.1.8.5.1. Marketing Strategy

        16.1.9. Sartorius AG

            16.1.9.1. Overview

            16.1.9.2. Product Portfolio

            16.1.9.3. Profitability by Market Segments

            16.1.9.4. Sales Footprint

            16.1.9.5. Strategy Overview

                16.1.9.5.1. Marketing Strategy

        16.1.10. Thermo Fisher Scientific, Inc.

            16.1.10.1. Overview

            16.1.10.2. Product Portfolio

            16.1.10.3. Profitability by Market Segments

            16.1.10.4. Sales Footprint

            16.1.10.5. Strategy Overview

                16.1.10.5.1. Marketing Strategy

17. Assumptions & Acronyms Used

18. Research Methodology

List of Tables

Table 1: Global Market Value (US$ Million) Forecast by Region, 2017 to 2032

Table 2: Global Market Value (US$ Million) Forecast by Technology, 2017 to 2032

Table 3: Global Market Value (US$ Million) Forecast by Application, 2017 to 2032

Table 4: Global Market Value (US$ Million) Forecast by Component, 2017 to 2032

Table 5: North America Market Value (US$ Million) Forecast by Country, 2017 to 2032

Table 6: North America Market Value (US$ Million) Forecast by Technology, 2017 to 2032

Table 7: North America Market Value (US$ Million) Forecast by Application, 2017 to 2032

Table 8: North America Market Value (US$ Million) Forecast by Component, 2017 to 2032

Table 9: Latin America Market Value (US$ Million) Forecast by Country, 2017 to 2032

Table 10: Latin America Market Value (US$ Million) Forecast by Technology, 2017 to 2032

Table 11: Latin America Market Value (US$ Million) Forecast by Application, 2017 to 2032

Table 12: Latin America Market Value (US$ Million) Forecast by Component, 2017 to 2032

Table 13: Europe Market Value (US$ Million) Forecast by Country, 2017 to 2032

Table 14: Europe Market Value (US$ Million) Forecast by Technology, 2017 to 2032

Table 15: Europe Market Value (US$ Million) Forecast by Application, 2017 to 2032

Table 16: Europe Market Value (US$ Million) Forecast by Component, 2017 to 2032

Table 17: Asia Pacific Market Value (US$ Million) Forecast by Country, 2017 to 2032

Table 18: Asia Pacific Market Value (US$ Million) Forecast by Technology, 2017 to 2032

Table 19: Asia Pacific Market Value (US$ Million) Forecast by Application, 2017 to 2032

Table 20: Asia Pacific Market Value (US$ Million) Forecast by Component, 2017 to 2032

Table 21: Middle East and Africa Market Value (US$ Million) Forecast by Country, 2017 to 2032

Table 22: Middle East and Africa Market Value (US$ Million) Forecast by Technology, 2017 to 2032

Table 23: Middle East and Africa Market Value (US$ Million) Forecast by Application, 2017 to 2032

Table 24: Middle East and Africa Market Value (US$ Million) Forecast by Component, 2017 to 2032

List of Charts

Figure 1: Global Market Value (US$ Million) by Technology, 2022 to 2032

Figure 2: Global Market Value (US$ Million) by Application, 2022 to 2032

Figure 3: Global Market Value (US$ Million) by Component, 2022 to 2032

Figure 4: Global Market Value (US$ Million) by Region, 2022 to 2032

Figure 5: Global Market Value (US$ Million) Analysis by Region, 2017 to 2032

Figure 6: Global Market Value Share (%) and BPS Analysis by Region, 2022 to 2032

Figure 7: Global Market Y-o-Y Growth (%) Projections by Region, 2022 to 2032

Figure 8: Global Market Value (US$ Million) Analysis by Technology, 2017 to 2032

Figure 9: Global Market Value Share (%) and BPS Analysis by Technology, 2022 to 2032

Figure 10: Global Market Y-o-Y Growth (%) Projections by Technology, 2022 to 2032

Figure 11: Global Market Value (US$ Million) Analysis by Application, 2017 to 2032

Figure 12: Global Market Value Share (%) and BPS Analysis by Application, 2022 to 2032

Figure 13: Global Market Y-o-Y Growth (%) Projections by Application, 2022 to 2032

Figure 14: Global Market Value (US$ Million) Analysis by Component, 2017 to 2032

Figure 15: Global Market Value Share (%) and BPS Analysis by Component, 2022 to 2032

Figure 16: Global Market Y-o-Y Growth (%) Projections by Component, 2022 to 2032

Figure 17: Global Market Attractiveness by Technology, 2022 to 2032

Figure 18: Global Market Attractiveness by Application, 2022 to 2032

Figure 19: Global Market Attractiveness by Component, 2022 to 2032

Figure 20: Global Market Attractiveness by Region, 2022 to 2032

Figure 21: North America Market Value (US$ Million) by Technology, 2022 to 2032

Figure 22: North America Market Value (US$ Million) by Application, 2022 to 2032

Figure 23: North America Market Value (US$ Million) by Component, 2022 to 2032

Figure 24: North America Market Value (US$ Million) by Country, 2022 to 2032

Figure 25: North America Market Value (US$ Million) Analysis by Country, 2017 to 2032

Figure 26: North America Market Value Share (%) and BPS Analysis by Country, 2022 to 2032

Figure 27: North America Market Y-o-Y Growth (%) Projections by Country, 2022 to 2032

Figure 28: North America Market Value (US$ Million) Analysis by Technology, 2017 to 2032

Figure 29: North America Market Value Share (%) and BPS Analysis by Technology, 2022 to 2032

Figure 30: North America Market Y-o-Y Growth (%) Projections by Technology, 2022 to 2032

Figure 31: North America Market Value (US$ Million) Analysis by Application, 2017 to 2032

Figure 32: North America Market Value Share (%) and BPS Analysis by Application, 2022 to 2032

Figure 33: North America Market Y-o-Y Growth (%) Projections by Application, 2022 to 2032

Figure 34: North America Market Value (US$ Million) Analysis by Component, 2017 to 2032

Figure 35: North America Market Value Share (%) and BPS Analysis by Component, 2022 to 2032

Figure 36: North America Market Y-o-Y Growth (%) Projections by Component, 2022 to 2032

Figure 37: North America Market Attractiveness by Technology, 2022 to 2032

Figure 38: North America Market Attractiveness by Application, 2022 to 2032

Figure 39: North America Market Attractiveness by Component, 2022 to 2032

Figure 40: North America Market Attractiveness by Country, 2022 to 2032

Figure 41: Latin America Market Value (US$ Million) by Technology, 2022 to 2032

Figure 42: Latin America Market Value (US$ Million) by Application, 2022 to 2032

Figure 43: Latin America Market Value (US$ Million) by Component, 2022 to 2032

Figure 44: Latin America Market Value (US$ Million) by Country, 2022 to 2032

Figure 45: Latin America Market Value (US$ Million) Analysis by Country, 2017 to 2032

Figure 46: Latin America Market Value Share (%) and BPS Analysis by Country, 2022 to 2032

Figure 47: Latin America Market Y-o-Y Growth (%) Projections by Country, 2022 to 2032

Figure 48: Latin America Market Value (US$ Million) Analysis by Technology, 2017 to 2032

Figure 49: Latin America Market Value Share (%) and BPS Analysis by Technology, 2022 to 2032

Figure 50: Latin America Market Y-o-Y Growth (%) Projections by Technology, 2022 to 2032

Figure 51: Latin America Market Value (US$ Million) Analysis by Application, 2017 to 2032

Figure 52: Latin America Market Value Share (%) and BPS Analysis by Application, 2022 to 2032

Figure 53: Latin America Market Y-o-Y Growth (%) Projections by Application, 2022 to 2032

Figure 54: Latin America Market Value (US$ Million) Analysis by Component, 2017 to 2032

Figure 55: Latin America Market Value Share (%) and BPS Analysis by Component, 2022 to 2032

Figure 56: Latin America Market Y-o-Y Growth (%) Projections by Component, 2022 to 2032

Figure 57: Latin America Market Attractiveness by Technology, 2022 to 2032

Figure 58: Latin America Market Attractiveness by Application, 2022 to 2032

Figure 59: Latin America Market Attractiveness by Component, 2022 to 2032

Figure 60: Latin America Market Attractiveness by Country, 2022 to 2032

Figure 61: Europe Market Value (US$ Million) by Technology, 2022 to 2032

Figure 62: Europe Market Value (US$ Million) by Application, 2022 to 2032

Figure 63: Europe Market Value (US$ Million) by Component, 2022 to 2032

Figure 64: Europe Market Value (US$ Million) by Country, 2022 to 2032

Figure 65: Europe Market Value (US$ Million) Analysis by Country, 2017 to 2032

Figure 66: Europe Market Value Share (%) and BPS Analysis by Country, 2022 to 2032

Figure 67: Europe Market Y-o-Y Growth (%) Projections by Country, 2022 to 2032

Figure 68: Europe Market Value (US$ Million) Analysis by Technology, 2017 to 2032

Figure 69: Europe Market Value Share (%) and BPS Analysis by Technology, 2022 to 2032

Figure 70: Europe Market Y-o-Y Growth (%) Projections by Technology, 2022 to 2032

Figure 71: Europe Market Value (US$ Million) Analysis by Application, 2017 to 2032

Figure 72: Europe Market Value Share (%) and BPS Analysis by Application, 2022 to 2032

Figure 73: Europe Market Y-o-Y Growth (%) Projections by Application, 2022 to 2032

Figure 74: Europe Market Value (US$ Million) Analysis by Component, 2017 to 2032

Figure 75: Europe Market Value Share (%) and BPS Analysis by Component, 2022 to 2032

Figure 76: Europe Market Y-o-Y Growth (%) Projections by Component, 2022 to 2032

Figure 77: Europe Market Attractiveness by Technology, 2022 to 2032

Figure 78: Europe Market Attractiveness by Application, 2022 to 2032

Figure 79: Europe Market Attractiveness by Component, 2022 to 2032

Figure 80: Europe Market Attractiveness by Country, 2022 to 2032

Figure 81: Asia Pacific Market Value (US$ Million) by Technology, 2022 to 2032

Figure 82: Asia Pacific Market Value (US$ Million) by Application, 2022 to 2032

Figure 83: Asia Pacific Market Value (US$ Million) by Component, 2022 to 2032

Figure 84: Asia Pacific Market Value (US$ Million) by Country, 2022 to 2032

Figure 85: Asia Pacific Market Value (US$ Million) Analysis by Country, 2017 to 2032

Figure 86: Asia Pacific Market Value Share (%) and BPS Analysis by Country, 2022 to 2032

Figure 87: Asia Pacific Market Y-o-Y Growth (%) Projections by Country, 2022 to 2032

Figure 88: Asia Pacific Market Value (US$ Million) Analysis by Technology, 2017 to 2032

Figure 89: Asia Pacific Market Value Share (%) and BPS Analysis by Technology, 2022 to 2032

Figure 90: Asia Pacific Market Y-o-Y Growth (%) Projections by Technology, 2022 to 2032

Figure 91: Asia Pacific Market Value (US$ Million) Analysis by Application, 2017 to 2032

Figure 92: Asia Pacific Market Value Share (%) and BPS Analysis by Application, 2022 to 2032

Figure 93: Asia Pacific Market Y-o-Y Growth (%) Projections by Application, 2022 to 2032

Figure 94: Asia Pacific Market Value (US$ Million) Analysis by Component, 2017 to 2032

Figure 95: Asia Pacific Market Value Share (%) and BPS Analysis by Component, 2022 to 2032

Figure 96: Asia Pacific Market Y-o-Y Growth (%) Projections by Component, 2022 to 2032

Figure 97: Asia Pacific Market Attractiveness by Technology, 2022 to 2032

Figure 98: Asia Pacific Market Attractiveness by Application, 2022 to 2032

Figure 99: Asia Pacific Market Attractiveness by Component, 2022 to 2032

Figure 100: Asia Pacific Market Attractiveness by Country, 2022 to 2032

Figure 101: Middle East and Africa Market Value (US$ Million) by Technology, 2022 to 2032

Figure 102: Middle East and Africa Market Value (US$ Million) by Application, 2022 to 2032

Figure 103: Middle East and Africa Market Value (US$ Million) by Component, 2022 to 2032

Figure 104: Middle East and Africa Market Value (US$ Million) by Country, 2022 to 2032

Figure 105: Middle East and Africa Market Value (US$ Million) Analysis by Country, 2017 to 2032

Figure 106: Middle East and Africa Market Value Share (%) and BPS Analysis by Country, 2022 to 2032

Figure 107: Middle East and Africa Market Y-o-Y Growth (%) Projections by Country, 2022 to 2032

Figure 108: Middle East and Africa Market Value (US$ Million) Analysis by Technology, 2017 to 2032

Figure 109: Middle East and Africa Market Value Share (%) and BPS Analysis by Technology, 2022 to 2032

Figure 110: Middle East and Africa Market Y-o-Y Growth (%) Projections by Technology, 2022 to 2032

Figure 111: Middle East and Africa Market Value (US$ Million) Analysis by Application, 2017 to 2032

Figure 112: Middle East and Africa Market Value Share (%) and BPS Analysis by Application, 2022 to 2032

Figure 113: Middle East and Africa Market Y-o-Y Growth (%) Projections by Application, 2022 to 2032

Figure 114: Middle East and Africa Market Value (US$ Million) Analysis by Component, 2017 to 2032

Figure 115: Middle East and Africa Market Value Share (%) and BPS Analysis by Component, 2022 to 2032

Figure 116: Middle East and Africa Market Y-o-Y Growth (%) Projections by Component, 2022 to 2032

Figure 117: Middle East and Africa Market Attractiveness by Technology, 2022 to 2032

Figure 118: Middle East and Africa Market Attractiveness by Application, 2022 to 2032

Figure 119: Middle East and Africa Market Attractiveness by Component, 2022 to 2032

Figure 120: Middle East and Africa Market Attractiveness by Country, 2022 to 2032

Recommendations

Healthcare

Molecular Spectroscopy Market

Published : October 2023

Healthcare

Atomic Spectroscopy Market

Published : September 2022

Healthcare

X-ray Photoelectron Spectroscopy Market

Published : June 2022

Testing Equipment

Spectroscopy Equipment and Supplies Market

Published : December 2018

Explore Technology Insights

View Reports

Process Spectroscopy Market