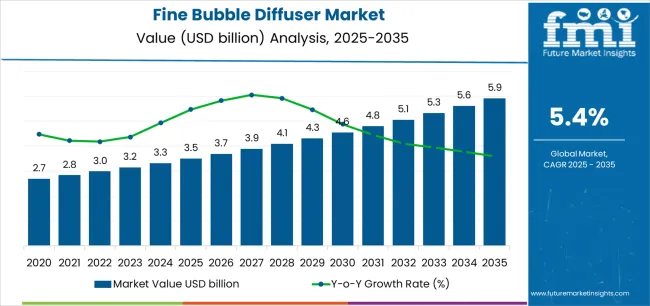
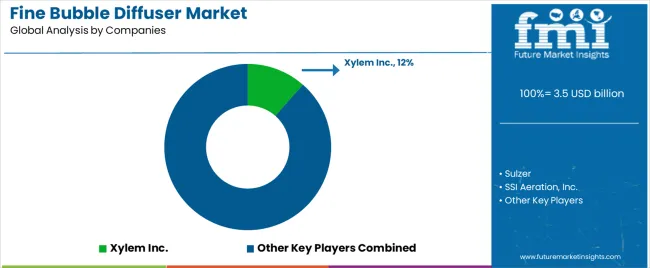
The fine bubble diffuser market stands at the threshold of a decade-long expansion trajectory that promises to reshape wastewater treatment technology and aeration optimization solutions. The market's journey from USD 3.5 billion in 2025 to USD 6.0 billion by 2035 represents substantial growth, demonstrating the accelerating adoption of advanced aeration technology and energy efficiency optimization across municipal wastewater facilities, industrial treatment operations, and aquaculture sectors.
The first half of the decade (2025-2030) will witness the market climbing from USD 3.5 billion to approximately USD 4.6 billion, adding USD 1.1 billion in value, which constitutes 48% of the total forecast growth period. This phase will be characterized by the rapid adoption of disc diffuser systems, driven by increasing wastewater treatment volumes and the growing need for advanced energy-efficient aeration solutions worldwide. Enhanced oxygen transfer capabilities and automated monitoring systems will become standard expectations rather than premium options.
The latter half (2030-2035) will witness continued growth from USD 4.6 billion to USD 6.0 billion, representing an addition of USD 1.4 billion or 52% of the decade's expansion. This period will be defined by mass market penetration of high-efficiency diffuser technologies, integration with comprehensive plant management platforms, and seamless compatibility with existing wastewater treatment infrastructure. The market trajectory signals fundamental shifts in how treatment facilities approach aeration optimization and energy management, with participants positioned to benefit from growing demand across multiple product types and application segments.
Processing operations reveal significant coordination difficulties between research and development teams pursuing enhanced bubble size control and membrane longevity while environmental compliance personnel ensure systems meet biochemical oxygen demand removal requirements and nutrient reduction standards. R&D personnel develop sophisticated membrane technologies incorporating EPDM, silicone, and ceramic materials providing optimal bubble formation and oxygen transfer rates for diverse biological treatment processes, while regulatory teams enforce performance validation protocols that may require extensive pilot testing and long-term operational studies. Operations managers navigate these competing priorities against project implementation schedules when regulatory approval processes require comprehensive environmental impact assessments during facility upgrades.
Supply chain coordination challenges emerge from geographic dispersion between specialized membrane manufacturers and diffuser assembly facilities serving global water treatment markets with varying regulatory requirements. EPDM and silicone membrane production concentrates in regions with advanced polymer processing capabilities, while ceramic membrane manufacturing locates near specialty ceramics facilities with high-temperature processing expertise. Integration coordination between these dispersed suppliers requires sophisticated quality management systems when material property variations affect diffuser performance during diverse wastewater treatment operating conditions and regulatory compliance testing.
| Period | Primary Revenue Buckets | Share | Notes |
|---|---|---|---|
| Today | New diffuser installations (disc, tube, plate) | 42% | Capex-led, WWTP expansion-driven purchases |
| Replacement membranes & components | 28% | 7-10 year replacement cycles for existing systems | |
| Retrofit & upgrade projects | 18% | Energy efficiency improvements, SOTE optimization | |
| Service & maintenance contracts | 12% | Preventive maintenance, performance monitoring | |
| Future (3-5 yrs) | High-efficiency disc systems | 38-42% | Advanced SOTE designs, anti-fouling materials |
| Membrane replacements & refurbishments | 25-28% | Extended service life, chemical-resistant materials | |
| Energy optimization retrofits | 18-22% | Upgrading coarse-bubble to fine-bubble systems | |
| Digital monitoring & analytics | 8-12% | Real-time performance tracking, predictive maintenance | |
| Nutrient removal upgrades | 6-10% | Compliance-driven enhancements, process intensification | |
| Aquaculture & industrial solutions | 4-8% | Specialized applications, niche market growth |
| Metric | Value |
|---|---|
| Market Value (2025) | USD 3.5 billion |
| Market Forecast (2035) | USD 6.0 billion |
| Growth Rate | 5.4% CAGR |
| Leading Technology | Disc Diffusers |
| Primary Application | Municipal Wastewater Segment |
The market demonstrates strong fundamentals with disc diffuser systems capturing a dominant share through advanced oxygen transfer capabilities and wastewater treatment optimization. Municipal wastewater applications drive primary demand, supported by increasing environmental regulations and treatment capacity requirements. Geographic expansion remains concentrated in Asia Pacific with established treatment infrastructure, while emerging economies show accelerating adoption rates driven by urbanization initiatives and rising environmental standards.
Primary Classification: The market segments by product type into disc diffusers, tube diffusers, plate diffusers, and dome/other diffusers, representing the evolution from basic aeration equipment to sophisticated oxygen transfer solutions for comprehensive wastewater treatment optimization.
Secondary Classification: Material segmentation divides the market into EPDM rubber, silicone, PTFE/FEPDM, ceramic, and others (including PU and Viton), reflecting distinct requirements for chemical resistance, durability, and operational efficiency standards.
Tertiary Classification: Application segmentation covers municipal wastewater, industrial wastewater, and aquaculture, while end-use scenarios span wastewater treatment plants, industrial facilities, and aquaculture operations.
Regional Classification: Geographic distribution covers Asia Pacific, North America, Western & Eastern Europe, Middle East & Africa, and Latin America, with developed markets leading adoption while emerging economies show accelerating growth patterns driven by wastewater treatment expansion programs.
The segmentation structure reveals technology progression from standard aeration equipment toward sophisticated oxygen transfer systems with enhanced efficiency and durability capabilities, while application diversity spans from municipal facilities to industrial treatment operations requiring precise aeration solutions.
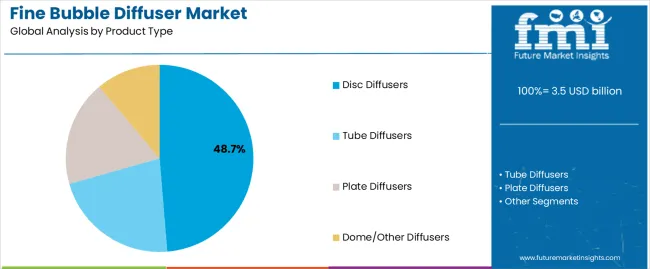
Market Position: Disc diffuser systems command the leading position in the fine bubble diffuser market with 48.7% market share through advanced oxygen transfer features, including superior SOTE performance, operational efficiency, and wastewater treatment optimization that enable facilities to achieve optimal aeration effectiveness across diverse municipal and industrial environments.
Value Drivers: The segment benefits from treatment facility preference for reliable aeration systems that provide consistent oxygen transfer performance, reduced energy consumption, and operational efficiency optimization without requiring significant infrastructure modifications. Advanced design features enable automated dissolved oxygen control systems, energy monitoring, and integration with existing wastewater treatment equipment, where operational performance and regulatory compliance represent critical facility requirements.
Competitive Advantages: Disc diffuser systems differentiate through proven operational reliability, consistent oxygen transfer characteristics, and integration with automated treatment systems that enhance facility effectiveness while maintaining optimal energy efficiency standards suitable for diverse municipal and industrial applications.
Key market characteristics:
Tube diffuser systems maintain a 28.5% market position in the fine bubble diffuser market due to their balanced oxygen transfer properties and installation advantages. These systems appeal to facilities requiring moderate aeration capacity with competitive pricing for mid-scale wastewater applications. Market growth is driven by industrial treatment expansion, emphasizing reliable aeration solutions and operational efficiency through optimized system designs.
Plate diffuser systems capture 15.6% market share through specialized aeration requirements in industrial facilities, small-scale treatment, and specific process applications. These facilities demand flexible aeration systems capable of handling diverse treatment scenarios while providing effective oxygen transfer capabilities and operational simplicity.
Dome and other diffuser configurations account for 7.2% market share, including specialized aeration requirements in unique treatment applications, process-specific installations, and custom aeration solutions requiring tailored oxygen transfer capabilities for specialized operational scenarios.
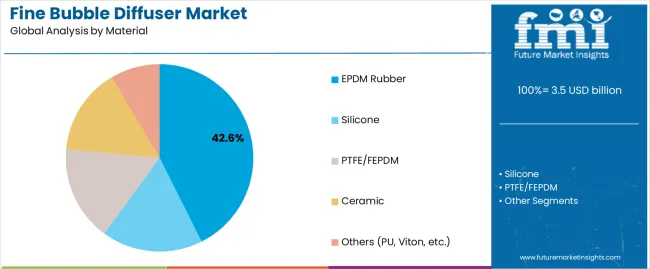
Market Context: EPDM rubber materials demonstrate the highest market share in the fine bubble diffuser market with 42.6% market position due to widespread adoption of durable membrane systems and increasing focus on wastewater treatment optimization, operational cost efficiency, and chemical resistance applications that maximize membrane lifespan while maintaining oxygen transfer standards.
Appeal Factors: EPDM rubber material operators prioritize membrane durability, chemical resistance, and integration with existing treatment infrastructure that enables coordinated aeration operations across multiple treatment processes. The segment benefits from substantial treatment facility investment and membrane replacement programs that emphasize the acquisition of EPDM systems for performance optimization and cost-efficiency applications.
Growth Drivers: Wastewater treatment expansion programs incorporate EPDM rubber membranes as standard components for aeration operations, while industrial treatment growth increases demand for chemical-resistant membrane capabilities that comply with environmental standards and minimize operational complexity.
Market Challenges: Varying chemical exposure requirements and fouling characteristics may limit membrane standardization across different facilities or treatment scenarios.
Application dynamics include:
Silicone materials capture 20.3% market share through specialized membrane requirements in high-temperature applications, chemical-intensive processes, and premium installations. These facilities demand advanced material systems capable of operating under extreme conditions while providing effective oxygen transfer and extended operational lifespan capabilities.
PTFE/FEPDM materials account for 13.7% market share, including advanced chemical resistance applications, ozone-compatible installations, and nutrient removal processes requiring maximum chemical durability capabilities for operational optimization and membrane longevity.
Ceramic materials hold 12.1% market share through exceptional durability requirements in harsh industrial environments, high-temperature applications, and long-life installations. These applications demand ultra-durable membrane systems capable of withstanding extreme operational conditions while providing consistent oxygen transfer performance.
Other materials including PU, Viton, and specialty compounds account for 11.3% market share through niche application requirements in specialized treatment scenarios, unique chemical environments, and custom aeration solutions requiring tailored material properties for specific operational demands.
Market Context: Municipal wastewater applications dominate the market with 56.4% market share, reflecting the primary demand source for fine bubble diffuser technology in urban sanitation and treatment operations.
Business Model Advantages: Municipal facilities provide direct market demand for advanced aeration equipment, driving technology innovation and capacity expansion while maintaining environmental compliance and operational efficiency requirements.
Operational Benefits: Municipal applications include primary treatment, secondary treatment, and nutrient removal processes that drive consistent demand for diffuser equipment while providing access to latest aeration technologies.
Industrial wastewater applications capture 34.1% market share through specialized treatment requirements in manufacturing facilities, food processing operations, and chemical production scenarios. These facilities demand efficient aeration systems capable of handling high organic loads while providing effective oxygen transfer and process optimization capabilities.
Aquaculture applications account for 9.5% market share, including fish farming operations, shrimp cultivation, and aquatic production facilities requiring precise dissolved oxygen management capabilities for operational optimization and production efficiency.
| Category | Factor | Impact | Why It Matters |
|---|---|---|---|
| Driver | Urbanization & wastewater generation growth (population density, infrastructure development) | ★★★★★ | Expanding urban populations require enhanced treatment capacity with energy-efficient aeration solutions and advanced oxygen transfer systems. |
| Driver | Environmental regulations & effluent standards (EPA, EU directives, nutrient limits) | ★★★★★ | Stricter discharge requirements mandate advanced aeration systems; facilities upgrading from coarse to fine-bubble technology for compliance. |
| Driver | Energy cost optimization & operational efficiency (electricity consumption reduction) | ★★★★★ | High SOTE diffusers reduce energy costs by 20-35%; facilities prioritizing energy-efficient retrofits and operational expenditure reduction. |
| Restraint | High initial capital investment & membrane replacement costs | ★★★★☆ | Small treatment facilities defer upgrades; increases price sensitivity and slows advanced diffuser adoption in developing regions. |
| Restraint | Membrane fouling & maintenance complexity (cleaning validation, performance degradation) | ★★★☆☆ | Industrial facilities face frequent cleaning procedures and membrane replacement requirements, limiting operational flexibility and increasing maintenance costs. |
| Trend | Smart aeration & digital monitoring integration | ★★★★★ | Real-time dissolved oxygen monitoring, predictive fouling analytics, and energy optimization transform operations; connectivity becomes core value proposition. |
| Trend | Nutrient removal upgrades & process intensification | ★★★★☆ | Advanced biological nutrient removal requires precise aeration control; modular designs and automated systems drive competition toward optimization solutions. |
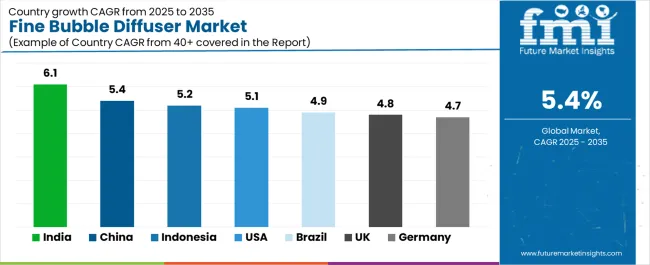
The fine bubble diffuser market demonstrates varied regional dynamics with Growth Leaders including India (6.1% growth rate) and Indonesia (5.2% growth rate) driving expansion through wastewater treatment infrastructure initiatives and sanitation capacity development. Steady Performers encompass United States (5.1% growth rate), Germany (4.7% growth rate), and developed regions, benefiting from established treatment industries and advanced technology adoption. Emerging Markets feature Brazil (4.9% growth rate) and developing regions, where environmental initiatives and infrastructure modernization support consistent growth patterns.
Regional synthesis reveals Asian markets leading adoption through urbanization expansion and sanitation development, while North American countries maintain steady expansion supported by infrastructure funding and regulatory standardization requirements. European markets show moderate growth driven by nutrient removal applications and energy efficiency integration trends.
| Region/Country | 2025-2035 Growth | How to win | What to watch out |
|---|---|---|---|
| India | 6.1% | Focus on cost-effective high-SOTE solutions | Tender complexity; payment cycles |
| China | 5.4% | Lead with retrofit solutions | Localization requirements; domestic competition |
| United States | 5.1% | Provide energy optimization packages | Infrastructure funding delays; skilled labor shortage |
| Indonesia | 5.2% | Value-oriented systems with donor-funding compatibility | Import regulations; technical support requirements |
| Brazil | 4.9% | Privatization-ready solutions | Currency fluctuations; regulatory changes |
| Germany | 4.7% | Offer premium nutrient-removal systems | Over-specification; lengthy approval processes |
| United Kingdom | 4.8% | Push AMP-cycle aligned solutions | Brexit impacts; CSO compliance costs |
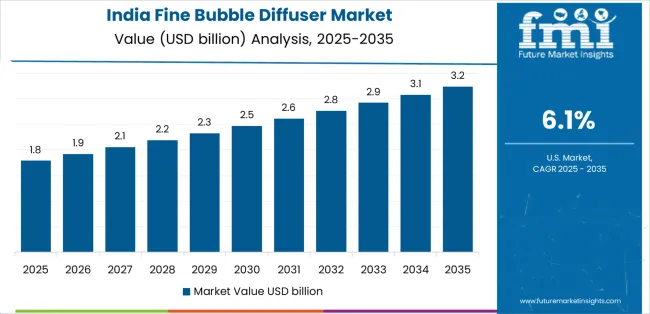
India establishes fastest market growth through aggressive wastewater treatment infrastructure programs and comprehensive sanitation capacity development, integrating advanced fine bubble diffusers as standard components in municipal treatment plants and urban sanitation installations. The country's 6.1% growth rate reflects government initiatives promoting river cleaning programs, urban sanitation missions, and domestic manufacturing capabilities that mandate the use of advanced aeration systems in municipal and industrial wastewater facilities. Growth concentrates in major urban centers, including Delhi, Mumbai, and Bangalore, where wastewater treatment development showcases integrated diffuser systems that appeal to municipal operators seeking advanced energy efficiency capabilities and oxygen transfer applications.
Indian manufacturers are developing cost-effective aeration solutions that combine domestic production advantages with advanced operational features, including automated dissolved oxygen control systems and enhanced SOTE capabilities. Distribution channels through environmental equipment suppliers and municipal contractors expand market access, while government support for swachh bharat and namami gange programs supports adoption across diverse municipal and industrial segments.
Strategic Market Indicators:
In Beijing, Shanghai, and Guangzhou, wastewater treatment facilities and industrial plants are implementing advanced fine bubble diffusers as standard equipment for treatment optimization and environmental compliance applications, driven by increasing government environmental investment and infrastructure modernization programs that emphasize the importance of energy efficiency capabilities. The market holds a 5.4% growth rate, supported by government water pollution control initiatives and treatment capacity development programs that promote advanced aeration systems for municipal and industrial wastewater facilities. Chinese operators are adopting diffuser systems that provide consistent oxygen transfer performance and compliance features, particularly appealing in urban regions where treatment efficiency and environmental standards represent critical operational requirements.
Market expansion benefits from growing wastewater treatment capabilities and technology localization agreements that enable domestic production of advanced diffuser systems for municipal and industrial applications. Technology adoption follows patterns established in environmental equipment, where performance and energy efficiency drive procurement decisions and operational deployment.
Market Intelligence Brief:
United States establishes market leadership through comprehensive infrastructure funding programs and advanced wastewater treatment development, integrating fine bubble diffusers across municipal and industrial applications. The country's 5.1% growth rate reflects established treatment industry relationships and mature aeration technology adoption that supports widespread use of energy-efficient diffuser systems in municipal and industrial facilities. Growth concentrates in major metropolitan areas and aging infrastructure regions where federal and state infrastructure funding showcases mature diffuser deployment that appeals to treatment operators seeking proven energy optimization capabilities and operational efficiency applications.
American equipment providers leverage established distribution networks and comprehensive service capabilities, including installation support programs and maintenance services that create customer relationships and operational advantages. The market benefits from mature regulatory standards and environmental requirements that mandate diffuser system upgrades while supporting technology advancement and operational optimization.
Market Intelligence Brief:
Indonesia's expanding wastewater treatment market demonstrates accelerating fine bubble diffuser deployment with documented operational effectiveness in municipal applications and industrial facilities through integration with donor-funded sanitation projects and urban development infrastructure. The country leverages rapid urbanization and industrial estate expansion to maintain a 5.2% growth rate. Major urban centers, including Jakarta, Surabaya, and Bandung, showcase new installations where diffuser systems integrate with comprehensive treatment platforms to optimize aeration operations and energy effectiveness.
Indonesian facilities prioritize cost-effective systems with low operational expenditure in diffuser equipment procurement, creating demand for efficient systems with proven features, including energy optimization and simple maintenance requirements. The market benefits from donor-funded municipal projects and a willingness to invest in modern wastewater technologies that provide long-term operational benefits and compliance with environmental standards.
Market Intelligence Brief:
Brazil's market expansion benefits from diverse treatment demand, including privatization concessions in São Paulo and Rio de Janeiro, wastewater facility upgrades, and government sanitation programs that increasingly incorporate diffuser solutions for energy optimization applications. The country maintains a 4.9% growth rate, driven by rising environmental activity and increasing recognition of aeration technology benefits, including precise dissolved oxygen control and enhanced treatment efficiency.
Market dynamics focus on cost-effective diffuser solutions that balance advanced operational performance with affordability considerations important to Brazilian municipal operators. Growing water privatization creates continued demand for modern aeration systems in facility upgrade infrastructure and treatment modernization projects.
Strategic Market Considerations:
Germany's advanced wastewater treatment technology market demonstrates sophisticated fine bubble diffuser deployment with documented operational effectiveness in nutrient removal applications and municipal facilities through integration with existing treatment systems and environmental infrastructure. The country leverages engineering expertise in wastewater technology and process optimization to maintain a 4.7% growth rate. Industrial centers, including Baden-Württemberg, Bavaria, and North Rhine-Westphalia, showcase premium installations where diffuser systems integrate with comprehensive biological nutrient removal platforms and facility management systems to optimize treatment operations and energy effectiveness.
German manufacturers prioritize system precision and EU compliance in diffuser equipment development, creating demand for premium systems with advanced features, including facility monitoring integration and automated dissolved oxygen control systems. The market benefits from established environmental technology infrastructure and a willingness to invest in advanced treatment technologies that provide long-term operational benefits and compliance with stringent nutrient removal standards.
Market Intelligence Brief:
United Kingdom's market expansion benefits from asset management plan (AMP) investment cycles, including storm overflow improvements and combined sewer overflow (CSO) compliance projects that increasingly incorporate diffuser solutions for capacity enhancement applications. The country maintains a 4.8% growth rate, driven by regulatory compliance requirements and increasing focus on aeration efficiency benefits, including energy cost reduction and enhanced treatment performance.
Market dynamics focus on AMP-cycle aligned diffuser solutions that meet water company investment requirements and operational performance standards. Growing CSO compliance mandates create continued demand for aeration capacity upgrades and diffuser refurbishment projects in existing treatment infrastructure.
Strategic Market Considerations:
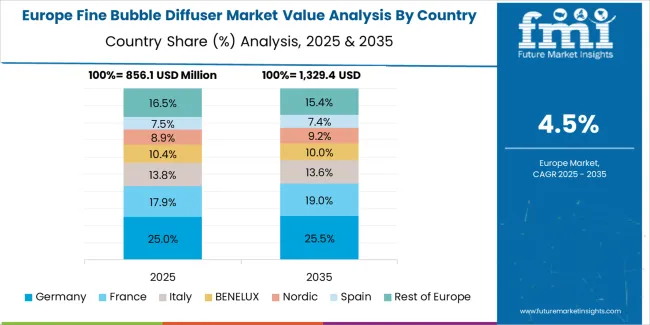
The fine bubble diffuser market in Europe is projected to grow from USD 0.8 billion in 2025 to USD 1.3 billion by 2035, registering a CAGR of 4.8% over the forecast period. Germany is expected to maintain its leadership position with a 32.5% market share in 2025, declining slightly to 31.8% by 2035, supported by its advanced wastewater treatment infrastructure and stringent nutrient removal requirements.
United Kingdom follows with a 21.7% share in 2025, projected to reach 22.3% by 2035, driven by comprehensive AMP investment cycles and CSO compliance programs. France holds a 18.9% share in 2025, expected to reach 19.5% by 2035 through specialized nutrient removal applications and treatment facility modernization. Italy commands a 13.2% share, while Spain accounts for 9.8% in 2025. The Rest of Europe region is anticipated to gain momentum, expanding its collective share from 3.9% to 4.3% by 2035, attributed to increasing diffuser adoption in Nordic countries and emerging Eastern European treatment facilities implementing modernization programs.
| Stakeholder | What they actually control | Typical strengths | Typical blind spots |
|---|---|---|---|
| Global platforms | Distribution reach, extensive product portfolios, service networks | Multi-regional support, proven reliability, comprehensive offerings | Technology refresh cycles; market penetration in emerging regions |
| Technology innovators | R&D capabilities; advanced membrane materials; high-SOTE systems | Latest efficiency features first; strong performance guarantees | Service density outside core markets; cost competitiveness |
| Regional specialists | Local compliance, rapid delivery, nearby technical support | Close-to-site service; pragmatic pricing; regional regulations | Technology gaps; talent retention in technical teams |
| Service-focused ecosystems | Membrane replacement programs, performance monitoring, maintenance SLAs | Lowest operational downtime; comprehensive support packages | Service costs if over-promised; membrane inventory management |
| Niche specialists | Specialized applications, custom materials, aquaculture solutions | Win specialized segments; flexible configurations | Scalability limitations; narrow market focus |
| Item | Value |
|---|---|
| Quantitative Units | USD 3.5 billion |
| Product Type | Disc Diffusers, Tube Diffusers, Plate Diffusers, Dome/Other Diffusers |
| Material | EPDM Rubber, Silicone, PTFE/FEPDM, Ceramic, Others (PU, Viton) |
| Application | Municipal Wastewater, Industrial Wastewater, Aquaculture |
| Regions Covered | Asia Pacific, North America, Western & Eastern Europe, Middle East & Africa, Latin America |
| Countries Covered | India, China, United States, Germany, United Kingdom, Indonesia, Brazil, France, Japan, Australia, and 25+ additional countries |
| Key Companies Profiled | Xylem Inc., Sulzer, SSI Aeration Inc., Jäger Umwelt-Technik, Aqua-Aerobic Systems, Environmental Dynamics International (EDI/CECO Environmental), Aquaconsult Anlagenbau (AEROSTRIP), Refractron Technologies, OTT Group, Diffused Gas Technologies |
| Additional Attributes | Dollar sales by product type and material categories, regional adoption trends across Asia Pacific, North America, and Europe, competitive landscape with environmental equipment manufacturers and wastewater treatment suppliers, municipal operator preferences for energy efficiency control and system reliability, integration with treatment plant platforms and monitoring systems, innovations in membrane technology and SOTE enhancement, and development of advanced aeration solutions with enhanced performance and energy optimization capabilities. |
The global fine bubble diffuser market is estimated to be valued at USD 3.5 billion in 2025.
The market size for the fine bubble diffuser market is projected to reach USD 5.9 billion by 2035.
The fine bubble diffuser market is expected to grow at a 5.4% CAGR between 2025 and 2035.
The key product types in fine bubble diffuser market are disc diffusers, tube diffusers, plate diffusers and dome/other diffusers.
In terms of material, epdm rubber segment to command 42.6% share in the fine bubble diffuser market in 2025.


Our Research Products

The "Full Research Suite" delivers actionable market intel, deep dives on markets or technologies, so clients act faster, cut risk, and unlock growth.

The Leaderboard benchmarks and ranks top vendors, classifying them as Established Leaders, Leading Challengers, or Disruptors & Challengers.

Locates where complements amplify value and substitutes erode it, forecasting net impact by horizon

We deliver granular, decision-grade intel: market sizing, 5-year forecasts, pricing, adoption, usage, revenue, and operational KPIs—plus competitor tracking, regulation, and value chains—across 60 countries broadly.

Spot the shifts before they hit your P&L. We track inflection points, adoption curves, pricing moves, and ecosystem plays to show where demand is heading, why it is changing, and what to do next across high-growth markets and disruptive tech

Real-time reads of user behavior. We track shifting priorities, perceptions of today’s and next-gen services, and provider experience, then pace how fast tech moves from trial to adoption, blending buyer, consumer, and channel inputs with social signals (#WhySwitch, #UX).

Partner with our analyst team to build a custom report designed around your business priorities. From analysing market trends to assessing competitors or crafting bespoke datasets, we tailor insights to your needs.
Supplier Intelligence
Discovery & Profiling
Capacity & Footprint
Performance & Risk
Compliance & Governance
Commercial Readiness
Who Supplies Whom
Scorecards & Shortlists
Playbooks & Docs
Category Intelligence
Definition & Scope
Demand & Use Cases
Cost Drivers
Market Structure
Supply Chain Map
Trade & Policy
Operating Norms
Deliverables
Buyer Intelligence
Account Basics
Spend & Scope
Procurement Model
Vendor Requirements
Terms & Policies
Entry Strategy
Pain Points & Triggers
Outputs
Pricing Analysis
Benchmarks
Trends
Should-Cost
Indexation
Landed Cost
Commercial Terms
Deliverables
Brand Analysis
Positioning & Value Prop
Share & Presence
Customer Evidence
Go-to-Market
Digital & Reputation
Compliance & Trust
KPIs & Gaps
Outputs
Full Research Suite comprises of:
Market outlook & trends analysis
Interviews & case studies
Strategic recommendations
Vendor profiles & capabilities analysis
5-year forecasts
8 regions and 60+ country-level data splits
Market segment data splits
12 months of continuous data updates
DELIVERED AS:
PDF EXCEL ONLINE
Bubble Wrap Machine Market Size and Share Forecast Outlook 2025 to 2035
Fine Chemicals Market Size and Share Forecast Outlook 2025 to 2035
Bubble Wrap Packaging Market Size and Share Forecast Outlook 2025 to 2035
Bubble Lined Courier Bags Market Size and Share Forecast Outlook 2025 to 2035
Bubble Blower Market Size and Share Forecast Outlook 2025 to 2035
Bubble Wrap Packaging Industry Analysis in Japan Size and Share Forecast Outlook 2025 to 2035
Bubble Tea Market Analysis - Size, Share, and Forecast Outlook 2025 to 2035
Bubble Tubes Market Size and Share Forecast Outlook 2025 to 2035
Bubble Tea Industry Analysis in USA - Size, Share, and Forecast 2025 to 2035
Fine Hydrates Market Analysis & Forecast 2025 to 2035
Market Share Distribution Among Bubble Tea Providers
Market Share Distribution Among Bubble Wrap Packaging Manufacturers
Competitive Breakdown of Bubble Tubes Suppliers
Diffuser Membrane Market Insights – Trends, Demand & Growth 2025-2035
Western Europe Bubble Wrap Packaging Market Analysis – Growth & Forecast 2023-2033
Korea Bubble Wrap Packaging Market Growth – Trends & Forecast 2023-2033
Fine Line Striping Tape Market
Refinery Process Chemical Market Size and Share Forecast Outlook 2025 to 2035
Refinery fuel additives Market Size and Share Forecast Outlook 2025 to 2035
Refined Functional Carbohydrates Market Size and Share Forecast Outlook 2025 to 2035

Thank you!
You will receive an email from our Business Development Manager. Please be sure to check your SPAM/JUNK folder too.
Chat With
MaRIA