Reports

- Global Locations -

Headquarters

Future Market Insights, Inc.

Christiana Corporate, 200
Continental Drive, Suite 401,
Newark, Delaware - 19713,
United States

T: +1-845-579-5705

Americas

Future Market Insights, Inc.

616 Corporate Way, Suite 2-9018,
Valley Cottage, NY 10989, United States

T: +1-347-918-3531

MEA

Future Market Insights

1602-6 Jumeirah Bay X2 Tower, Plot No: JLT-PH2-X2A,
Jumeirah Lakes Towers, Dubai,
United Arab Emirates

Europe

Future Market Insights

3rd Floor, 207 Regent Street,
W1B 3HH London
United Kingdom

T: + 44 (0) 20 8123 9659
D: +44 (0) 20 3287 4268

Asia Pacific

Future Market Insights

IndiaLand Global Tech Park, Unit UG-1, Behind Grand HighStreet, Phase 1, Hinjawadi, MH, Pune – 411057, India

Industrial Lubricants Market Outlook (2023 to 2033)

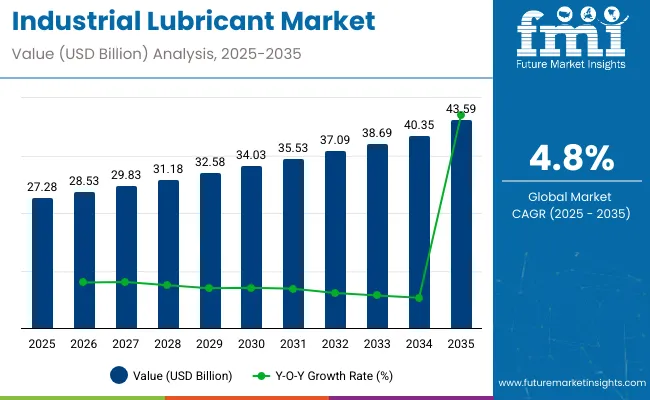
The global industrial lubricants market is anticipated to be valued at US$ 22,845.9 million in 2023, expanding at a CAGR of 4.4% from 2023 to 2033, to be valued at US$ 35,140.9 million in 2033. Growth is attributed to the increasing usage of IoT-based applications. From 2018 to 2022, a CAGR of 3.1% was registered for the industrial lubricants market.

Attributes Details
Industrial Lubricants Market Share (2022) US$ 21,883.0 million
Industrial Lubricants Market Share (2023) US$ 22,845.6 million
Industrial Lubricants Market Share (2033) US$ 35,140.9 million
Industrial Lubricants Market Share (2023 to 2033) 4.4%

The global industrial lubricants market is primarily driven by the increasing adoption of complex machinery and tools in various industries. Industrials in the manufacturing sector are constantly on a hunt to boost their output efficiency by enhancing productivity and minimizing downtime, sustaining the revenue pool of market players.

Rising stringency in regulatory frameworks is influencing market players to shift towards bio-based industrial lubricants that, apart from environmental benefits, offer better lubrication and viscosity. Manufacturers are turning to sustainability measures such as the reuse and recycling of industrial lubricants. Moreover, lubricant manufacturers are offering onsite and offsite recycling equipment and services to their end users.

Don't pay for what you don't need

Customize your report by selecting specific countries or regions and save 30%!

Which are Some Prominent Drivers Spearheading Industrial Lubricants Market Growth?

Booming Construction Industry to enhance uptake of Industrial Lubricants

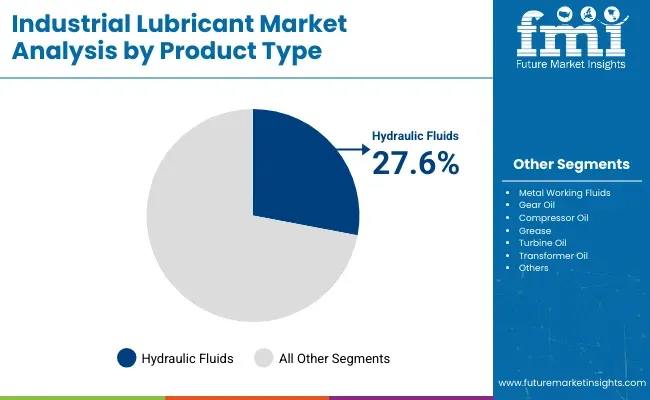
The construction sector is the leading consumer of industrial lubricants. The growing infrastructural development in emerging economies is anticipated to fuel industrial lubricant sales. Hydraulic fluid is the main product type used in the construction industry in the lubrication of heavy load equipment, as it is relatively cheaper compared to other lubricants.

Moving ahead, the automobile industry is also offering potential revenue prospects for industrial lubricant manufacturers. Umpteen benefits of industrial lubricants such as high durability, corrosion protection, and high electrical resistance is boosting their usage in the automotive sector.

Several end-use industries such as the food processing industry are gradually Involving advanced technologies including, artificial intelligence (AI), and automation, implying greater indulgence of machines, thus, auguring well for the industrial lubricants market.

What are the Challenges Faced by the Industrial Lubricants Industry?

Mounting Concerns regarding Environmental Pollution to restrict uptake

Although the industrial lubricants market has numerous end-uses, there are numerous obstacles that likely pose a challenge to market growth. The majority of industrial lubricants are byproducts of petrochemicals, disposal of which leads to water pollution, the oils produced from crude oil have a negative impact on the environment, cause serious contamination of soils and groundwater, and can accumulate in plant tissues as well as terrestrial and aquatic animals. Synthetic lubricants are a major threat to the environment, as such governments in various countries are imposing bans on their usage.

The high impact of lubricating oils on the environment and health motivates research centers and industries to create new technologies for the production of fully biodegradable, lubricating oils of natural origin. Thus, growing environmental concerns, as well as stringent governmental regulations may impede the growth of the industrial lubricant market during the forecast period.

Nikhil Kaitwade
Nikhil Kaitwade

Principal Consultant

Talk to Analyst

Find your sweet spots for generating winning opportunities in this market.

Regional Insights

Why is North America Emerging as an Opportunistic Industrial Lubricants Market?

Expansion of the Oil & Gas industry to drive Market Growth in the Future

As per FMI, demand for industrial lubricants in North America is anticipated to account for a 19.2% share in the global market during the forecast period, owing to the rapid expansion of end-use industries such as construction, metal, mining, and the subsequent use of lubricants in these sectors.

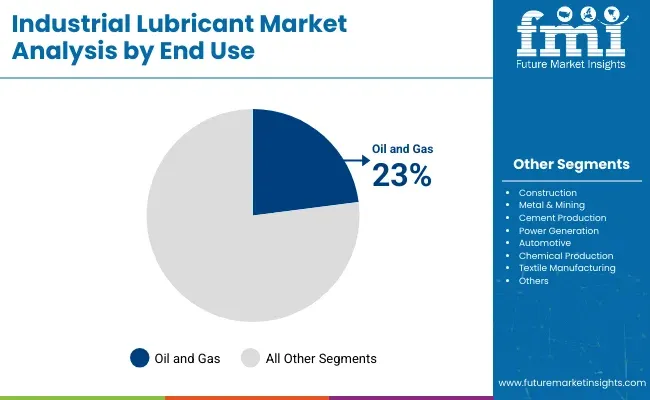
North America is also reflecting value-creation opportunities for industrial lubricant manufacturers, owing to expanding oil and gas industry in this region. The United States alone houses about 9,000 independent oil and gas power plants. Demand for industrial lubricants is increasing in drilling and exploration activities in the regional oil & gas industry.

North America is anticipated to witness comparatively substantial growth in the industrial lubricants market, due to the increasing demand for lubricants for specific applications in vehicles, building construction, metalworking, and others.

How Opportunistic are Growth Prospects across the Europe Market?

Growing Automotive Sector Provides Opportunity for Market Growth

Europe dominates the industrial lubricants market and is foreseen to account for around 23.1% share of the global market in 2023. Due to an increase in industrialization in the region.

Besides this, opportunities across industries such as chemicals, food and beverages, mining and metals, automotive and transportation, power generation, oil and gas, and others will give tailwinds to growth in Europe. Also, the rapidly growing automotive sector and industrial growth are expected to fuel the demand for the industrial lubricants market in the region.

Will the Asia Pacific Emerge as an Attractive Industrial Lubricants Market?

Rapid Industrialization in the Region Boost the Industrial Lubricants Market in Coming Years

The industrial lubricants market in the Asia Pacific is projected to expand at a rapid pace during the forecast period. Growth of the market in the region is attributed to the increasing growth in the base oil movement, rapid industrialization & urbanization, rising population, and high growth in major industries, such as textiles, chemicals, food processing, and metalworking in Asia Pacific.

Asia Pacific is estimated as a significantly growing region owing to the growing demand for industrial lubricants in several end-use industries, especially automotive and transportation. India, China, and Japan are the prominent countries in terms of consumption and production of industrial lubricants in Asia Pacific.

The increasing population in the region, accompanied by increasing construction spending in the developing markets of China, India, and Indonesia, is projected to make this region an ideal destination for the industrial lubricants industry.

Start-up Scenario

The new entrants in the industrial lubricants market are continually indulging in several collaborations and highly investing in research and development activities to provide more convenient solutions to industry verticals. Some of the major start-ups that are leading the development of the market are- Witman’s Advance Fluids, Arzol, JETEXINDIA, Transasia Petrochem Pvt Ltd, Chemilube, and M K Corporation

  • Transasia Petrochem Pvt. Ltd - the company was founded in 2013 and is operating as a prominent manufacturer, trader, and supplier of a varied range of automotive industrial lubricants/specialty additives for the lubricant industry. The offered product range comprises Engine Oils, Gear Oils, and Hydraulic Oils. The offered products are highly appreciated by the clients.

Get the data you need at a Fraction of the cost

Personalize your report by choosing insights you need
and save 40%!

Competitive Landscape

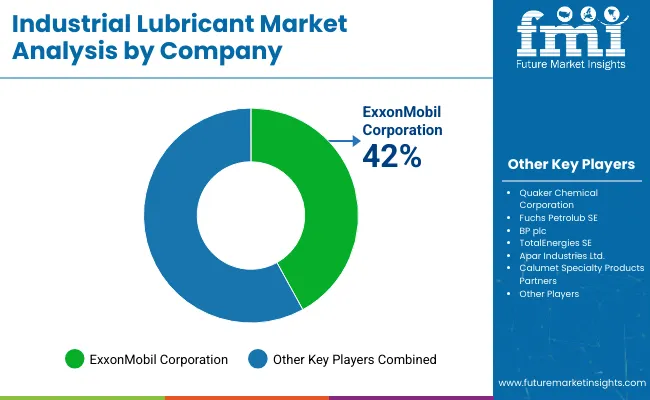
Some of the key participants present in the global industrial lubricants market include ExxonMobil Corp., Fuchs Group, The Lubrizol Corp., Royal Dutch Shell, Phillips 66, Lucas Oil Products Inc., Amsoil, Inc., Bel-Ray Co. Inc, Total S.A, Kluber Lubrication, Valvoline International, Inc., Chevron Corp., Clariant, Quaker Chemical Corp., Zeller+Gmelin GmbH & Co KG, Houghton International, Inc., Castrol, Blaser Swisslube, Inc., Calumet Specialty Product Partners L.P., Petronas Lubricant International among others.

Attributed to the presence of such a high number of participants, the market is highly competitive. While global players such as ExxonMobil Corp., Fuchs Group, The Lubrizol Corp., Royal Dutch Shell, Phillips 66, Lucas Oil Products Inc., Amsoil, Inc., Bel-Ray Co. Inc. account for considerable market size, several regional-level players are also operating across key growth regions, particularly in the Asia Pacific.

Recent Developments Observed by FMI :

  • In July 2022 - Quaker Houghton has entered into a collaboration that will combine SKF RecondOil’s Double Separation Technology (DST) with Quaker Houghton’s industrial oils and application expertise to enable the industry to more efficiently utilize its resources by reducing the unsustainable linear of use of oil.
  • A marketing agreement with Rock Energy in Bangladesh for Chevron Lubricants Lanka PLC's lubricant products was announced in January 2022. Chevron Lubricants Lanka PLC is a subsidiary of Chevron Corporation.
  • Bharat Petroleum Corporation Limited, Indian Oil, and Hindustan Petroleum Corporation Limited announced the official launch of the Model Retail Outlet Scheme and the Darpan-Petrol Pump Digital Customer Feedback Program in November 2021. The three oil PSUs worked together to create model retail stores in order to raise service standards and facilities across their networks, which serve more than six crore people each day.
  • ExxonMobil Corp has launched FuelCell carbon capture technology that has the capacity to lower emissions from exhaust streams, power plants, refineries, and chemical plants.
  • Fuchs Group has launched the RENOCLEAN AIR series to control dust production in the mining sector.
  • In May 2020- The Lubrizol Corporation became the first lubricant additive technology supplier to join the Getting to Zero Coalition. An international group currently endorsed by 14 governments and composed of more than 100 organizations, it aims to drive the development of commercially viable, zero-emissions deep-sea ships by 2030.

Key Players in the Global Market

  • ExxonMobil Corp.
  • Fuchs Lubricants
  • The Lubrizol Corp.
  • Royal Dutch Shell
  • Phillips 66
  • Lucas Oil Products Inc.
  • Amsoil Inc.
  • Bel-Ray Co. Inc.
  • Total S.A.
  • Kluber Lubrication
  • Valvoline International Inc.
  • Chevron Corp.
  • Clariant
  • Quaker Chemical Corp.
  • Zeller+Gmelin GmbH & Co. KG
  • Houghton International Inc.
  • Castrol
  • Blaser Swisslube Inc.
  • Calumet Specialty Product Partners LLP
  • Petronas Lubricant International

Scope of the Report

Attribute Details
Forecast Period 2023 to 2033
Historical Data Available for 2018 to 2022
Market Analysis US$ Million for Value
Key Regions Covered
  • North America
  • Latin America
  • Europe
  • Asia Pacific
  • Middle East & Africa (MEA)
Key Countries Covered
  • United States
  • Canada
  • Germany
  • United Kingdom
  • Nordic
  • Russia
  • BENELUX
  • Poland
  • France
  • Spain
  • Italy
  • Czech Republic
  • Hungary
  • Rest of EMEAI
  • Brazil
  • Peru
  • Argentina
  • Mexico
  • South Africa
  • Northern Africa
  • GCC Countries
  • China
  • Japan
  • South Korea
  • India
  • ASEAN
  • Thailand
  • Malaysia
  • Indonesia
  • Australia
  • New Zealand
  • Others
Key Segments Covered
  • Base Oil
  • Product Type
  • End-use Industry
  • Region
Report Coverage Market Forecast, Company Share Analysis, Competition Intelligence, Trend Analysis, Market Dynamics and Challenges, and Strategic Growth Initiatives

Industrial Lubricants Market Segmentation

By Base Oil :

  • Mineral Oil
  • Synthetic Oil
  • Bio-based Oil

By Product Type :

  • Hydraulic Fluids
  • Metalworking Fluids
  • Gear Oil
  • Compressor Oil
  • Grease
  • Turbine Oil
  • Transformer Oil
  • Refrigeration Oil
  • Textile Machinery Lubricants
  • Others

By End-use Industry :

  • Construction
  • Metal & Mining
  • Cement Production
  • Power Generation
  • Automotive
  • Chemical Production
  • Oil & Gas
  • Textile Manufacturing
  • Food Processing
  • Agriculture
  • Pulp & Paper
  • Marine Applications
  • Others

By Region :

  • North America
  • Latin America
  • Europe
  • Asia Pacific
  • Middle East & Africa (MEA)

Frequently Asked Questions

How Big is the Industrial Lubricants Market?

The market is expected to reach US$ 22,845.6 million in 2023.

What is the Anticipated CAGR of the Market?

The market is anticipated to expand at a CAGR of 4.4%.

What Factors are Yielding Market Expansion?

Booming construction and food processing industry, plus deployment of advanced technologies are aiding product sales.

What Factors Hold back the Market Growth?

Heightened ecological concerns are restricting the uptake of industrial lubricants.

Which Region Holds High Attractiveness for Market Players?

Asia Pacific holds high attractiveness for market players.

Table of Content

1. Executive Summary

    1.1. Global Market Outlook

    1.2. Demand-side Trends

    1.3. Supply-side Trends

    1.4. Technology Roadmap Analysis

    1.5. Analysis and Recommendations

2. Market Overview

    2.1. Market Coverage / Taxonomy

    2.2. Market Definition / Scope / Limitations

3. Market Background

    3.1. Market Dynamics

        3.1.1. Drivers

        3.1.2. Restraints

        3.1.3. Opportunity

        3.1.4. Trends

    3.2. Scenario Forecast

        3.2.1. Demand in Optimistic Scenario

        3.2.2. Demand in Likely Scenario

        3.2.3. Demand in Conservative Scenario

    3.3. Opportunity Map Analysis

    3.4. Product Life Cycle Analysis

    3.5. Supply Chain Analysis

        3.5.1. Supply Side Participants and their Roles

            3.5.1.1. Producers

            3.5.1.2. Mid-Level Participants (Traders/ Agents/ Brokers)

            3.5.1.3. Wholesalers and Distributors

        3.5.2. Value Added and Value Created at Node in the Supply Chain

        3.5.3. List of Raw Material Suppliers

        3.5.4. List of Existing and Potential Buyer’s

    3.6. Investment Feasibility Matrix

    3.7. Value Chain Analysis

        3.7.1. Profit Margin Analysis

        3.7.2. Wholesalers and Distributors

        3.7.3. Retailers

    3.8. PESTLE and Porter’s Analysis

    3.9. Regulatory Landscape

        3.9.1. By Key Regions

        3.9.2. By Key Countries

    3.10. Regional Parent Market Outlook

    3.11. Production and Consumption Statistics

    3.12. Import and Export Statistics

4. Global Market Analysis 2018 to 2022 and Forecast, 2023 to 2033

    4.1. Historical Market Size Value (US$ Million) & Volume (Tons) Analysis, 2018 to 2022

    4.2. Current and Future Market Size Value (US$ Million) & Volume (Tons) Projections, 2023 to 2033

        4.2.1. Y-o-Y Growth Trend Analysis

        4.2.2. Absolute $ Opportunity Analysis

5. Global Market Analysis 2018 to 2022 and Forecast 2023 to 2033, By Base Oil

    5.1. Introduction / Key Findings

    5.2. Historical Market Size Value (US$ Million) & Volume (Tons) Analysis By Base Oil, 2018 to 2022

    5.3. Current and Future Market Size Value (US$ Million) & Volume (Tons) Analysis and Forecast By Base Oil, 2023 to 2033

        5.3.1. Mineral Oil

        5.3.2. Synthetic Oil

        5.3.3. Bio-based Oil

    5.4. Y-o-Y Growth Trend Analysis By Base Oil, 2018 to 2022

    5.5. Absolute $ Opportunity Analysis By Base Oil, 2023 to 2033

6. Global Market Analysis 2018 to 2022 and Forecast 2023 to 2033, By Product Type

    6.1. Introduction / Key Findings

    6.2. Historical Market Size Value (US$ Million) & Volume (Tons) Analysis By Product Type, 2018 to 2022

    6.3. Current and Future Market Size Value (US$ Million) & Volume (Tons) Analysis and Forecast By Product Type, 2023 to 2033

        6.3.1. Hydraulic Fluids

        6.3.2. Metalworking Fluids

        6.3.3. Gear Oil

        6.3.4. Compressor Oil

        6.3.5. Grease

        6.3.6. Turbine Oil

        6.3.7. Transformer Oil

        6.3.8. Refrigeration Oil

        6.3.9. Textile Machinery Lubricants

        6.3.10. Others

    6.4. Y-o-Y Growth Trend Analysis By Product Type, 2018 to 2022

    6.5. Absolute $ Opportunity Analysis By Product Type, 2023 to 2033

7. Global Market Analysis 2018 to 2022 and Forecast 2023 to 2033, By End Use Industry

    7.1. Introduction / Key Findings

    7.2. Historical Market Size Value (US$ Million) & Volume (Tons) Analysis By End Use Industry, 2018 to 2022

    7.3. Current and Future Market Size Value (US$ Million) & Volume (Tons) Analysis and Forecast By End Use Industry, 2023 to 2033

        7.3.1. Construction

        7.3.2. Metal & Mining

        7.3.3. Cement Production

        7.3.4. Power Generation

        7.3.5. Automotive

        7.3.6. Chemical Production

        7.3.7. Oil & Gas

        7.3.8. Textile Manufacturing

        7.3.9. Food Processing

        7.3.10. Agriculture

        7.3.11. Pulp & Paper

        7.3.12. Marine Applications

    7.4. Y-o-Y Growth Trend Analysis By End Use Industry, 2018 to 2022

    7.5. Absolute $ Opportunity Analysis By End Use Industry, 2023 to 2033

8. Global Market Analysis 2018 to 2022 and Forecast 2023 to 2033, By Region

    8.1. Introduction

    8.2. Historical Market Size Value (US$ Million) & Volume (Tons) Analysis By Region, 2018 to 2022

    8.3. Current Market Size Value (US$ Million) & Volume (Tons) Analysis and Forecast By Region, 2023 to 2033

        8.3.1. North America

        8.3.2. Latin America

        8.3.3. Western Europe

        8.3.4. Eastern Europe

        8.3.5. South Asia and Pacific

        8.3.6. East Asia

        8.3.7. Middle East and Africa

    8.4. Market Attractiveness Analysis By Region

9. North America Market Analysis 2018 to 2022 and Forecast 2023 to 2033, By Country

    9.1. Historical Market Size Value (US$ Million) & Volume (Tons) Trend Analysis By Market Taxonomy, 2018 to 2022

    9.2. Market Size Value (US$ Million) & Volume (Tons) Forecast By Market Taxonomy, 2023 to 2033

        9.2.1. By Country

            9.2.1.1. USA

            9.2.1.2. Canada

        9.2.2. By Base Oil

        9.2.3. By Product Type

        9.2.4. By End Use Industry

    9.3. Market Attractiveness Analysis

        9.3.1. By Country

        9.3.2. By Base Oil

        9.3.3. By Product Type

        9.3.4. By End Use Industry

    9.4. Key Takeaways

10. Latin America Market Analysis 2018 to 2022 and Forecast 2023 to 2033, By Country

    10.1. Historical Market Size Value (US$ Million) & Volume (Tons) Trend Analysis By Market Taxonomy, 2018 to 2022

    10.2. Market Size Value (US$ Million) & Volume (Tons) Forecast By Market Taxonomy, 2023 to 2033

        10.2.1. By Country

            10.2.1.1. Brazil

            10.2.1.2. Mexico

            10.2.1.3. Rest of Latin America

        10.2.2. By Base Oil

        10.2.3. By Product Type

        10.2.4. By End Use Industry

    10.3. Market Attractiveness Analysis

        10.3.1. By Country

        10.3.2. By Base Oil

        10.3.3. By Product Type

        10.3.4. By End Use Industry

    10.4. Key Takeaways

11. Western Europe Market Analysis 2018 to 2022 and Forecast 2023 to 2033, By Country

    11.1. Historical Market Size Value (US$ Million) & Volume (Tons) Trend Analysis By Market Taxonomy, 2018 to 2022

    11.2. Market Size Value (US$ Million) & Volume (Tons) Forecast By Market Taxonomy, 2023 to 2033

        11.2.1. By Country

            11.2.1.1. Germany

            11.2.1.2. UK

            11.2.1.3. France

            11.2.1.4. Spain

            11.2.1.5. Italy

            11.2.1.6. Rest of Western Europe

        11.2.2. By Base Oil

        11.2.3. By Product Type

        11.2.4. By End Use Industry

    11.3. Market Attractiveness Analysis

        11.3.1. By Country

        11.3.2. By Base Oil

        11.3.3. By Product Type

        11.3.4. By End Use Industry

    11.4. Key Takeaways

12. Eastern Europe Market Analysis 2018 to 2022 and Forecast 2023 to 2033, By Country

    12.1. Historical Market Size Value (US$ Million) & Volume (Tons) Trend Analysis By Market Taxonomy, 2018 to 2022

    12.2. Market Size Value (US$ Million) & Volume (Tons) Forecast By Market Taxonomy, 2023 to 2033

        12.2.1. By Country

            12.2.1.1. Poland

            12.2.1.2. Russia

            12.2.1.3. Czech Republic

            12.2.1.4. Romania

            12.2.1.5. Rest of Eastern Europe

        12.2.2. By Base Oil

        12.2.3. By Product Type

        12.2.4. By End Use Industry

    12.3. Market Attractiveness Analysis

        12.3.1. By Country

        12.3.2. By Base Oil

        12.3.3. By Product Type

        12.3.4. By End Use Industry

    12.4. Key Takeaways

13. South Asia and Pacific Market Analysis 2018 to 2022 and Forecast 2023 to 2033, By Country

    13.1. Historical Market Size Value (US$ Million) & Volume (Tons) Trend Analysis By Market Taxonomy, 2018 to 2022

    13.2. Market Size Value (US$ Million) & Volume (Tons) Forecast By Market Taxonomy, 2023 to 2033

        13.2.1. By Country

            13.2.1.1. India

            13.2.1.2. Bangladesh

            13.2.1.3. Australia

            13.2.1.4. New Zealand

            13.2.1.5. Rest of South Asia and Pacific

        13.2.2. By Base Oil

        13.2.3. By Product Type

        13.2.4. By End Use Industry

    13.3. Market Attractiveness Analysis

        13.3.1. By Country

        13.3.2. By Base Oil

        13.3.3. By Product Type

        13.3.4. By End Use Industry

    13.4. Key Takeaways

14. East Asia Market Analysis 2018 to 2022 and Forecast 2023 to 2033, By Country

    14.1. Historical Market Size Value (US$ Million) & Volume (Tons) Trend Analysis By Market Taxonomy, 2018 to 2022

    14.2. Market Size Value (US$ Million) & Volume (Tons) Forecast By Market Taxonomy, 2023 to 2033

        14.2.1. By Country

            14.2.1.1. China

            14.2.1.2. Japan

            14.2.1.3. South Korea

        14.2.2. By Base Oil

        14.2.3. By Product Type

        14.2.4. By End Use Industry

    14.3. Market Attractiveness Analysis

        14.3.1. By Country

        14.3.2. By Base Oil

        14.3.3. By Product Type

        14.3.4. By End Use Industry

    14.4. Key Takeaways

15. Middle East and Africa Market Analysis 2018 to 2022 and Forecast 2023 to 2033, By Country

    15.1. Historical Market Size Value (US$ Million) & Volume (Tons) Trend Analysis By Market Taxonomy, 2018 to 2022

    15.2. Market Size Value (US$ Million) & Volume (Tons) Forecast By Market Taxonomy, 2023 to 2033

        15.2.1. By Country

            15.2.1.1. GCC Countries

            15.2.1.2. South Africa

            15.2.1.3. Israel

            15.2.1.4. Rest of MEA

        15.2.2. By Base Oil

        15.2.3. By Product Type

        15.2.4. By End Use Industry

    15.3. Market Attractiveness Analysis

        15.3.1. By Country

        15.3.2. By Base Oil

        15.3.3. By Product Type

        15.3.4. By End Use Industry

    15.4. Key Takeaways

16. Key Countries Market Analysis

    16.1. USA

        16.1.1. Pricing Analysis

        16.1.2. Market Share Analysis, 2022

            16.1.2.1. By Base Oil

            16.1.2.2. By Product Type

            16.1.2.3. By End Use Industry

    16.2. Canada

        16.2.1. Pricing Analysis

        16.2.2. Market Share Analysis, 2022

            16.2.2.1. By Base Oil

            16.2.2.2. By Product Type

            16.2.2.3. By End Use Industry

    16.3. Brazil

        16.3.1. Pricing Analysis

        16.3.2. Market Share Analysis, 2022

            16.3.2.1. By Base Oil

            16.3.2.2. By Product Type

            16.3.2.3. By End Use Industry

    16.4. Mexico

        16.4.1. Pricing Analysis

        16.4.2. Market Share Analysis, 2022

            16.4.2.1. By Base Oil

            16.4.2.2. By Product Type

            16.4.2.3. By End Use Industry

    16.5. Germany

        16.5.1. Pricing Analysis

        16.5.2. Market Share Analysis, 2022

            16.5.2.1. By Base Oil

            16.5.2.2. By Product Type

            16.5.2.3. By End Use Industry

    16.6. UK

        16.6.1. Pricing Analysis

        16.6.2. Market Share Analysis, 2022

            16.6.2.1. By Base Oil

            16.6.2.2. By Product Type

            16.6.2.3. By End Use Industry

    16.7. France

        16.7.1. Pricing Analysis

        16.7.2. Market Share Analysis, 2022

            16.7.2.1. By Base Oil

            16.7.2.2. By Product Type

            16.7.2.3. By End Use Industry

    16.8. Spain

        16.8.1. Pricing Analysis

        16.8.2. Market Share Analysis, 2022

            16.8.2.1. By Base Oil

            16.8.2.2. By Product Type

            16.8.2.3. By End Use Industry

    16.9. Italy

        16.9.1. Pricing Analysis

        16.9.2. Market Share Analysis, 2022

            16.9.2.1. By Base Oil

            16.9.2.2. By Product Type

            16.9.2.3. By End Use Industry

    16.10. Poland

        16.10.1. Pricing Analysis

        16.10.2. Market Share Analysis, 2022

            16.10.2.1. By Base Oil

            16.10.2.2. By Product Type

            16.10.2.3. By End Use Industry

    16.11. Russia

        16.11.1. Pricing Analysis

        16.11.2. Market Share Analysis, 2022

            16.11.2.1. By Base Oil

            16.11.2.2. By Product Type

            16.11.2.3. By End Use Industry

    16.12. Czech Republic

        16.12.1. Pricing Analysis

        16.12.2. Market Share Analysis, 2022

            16.12.2.1. By Base Oil

            16.12.2.2. By Product Type

            16.12.2.3. By End Use Industry

    16.13. Romania

        16.13.1. Pricing Analysis

        16.13.2. Market Share Analysis, 2022

            16.13.2.1. By Base Oil

            16.13.2.2. By Product Type

            16.13.2.3. By End Use Industry

    16.14. India

        16.14.1. Pricing Analysis

        16.14.2. Market Share Analysis, 2022

            16.14.2.1. By Base Oil

            16.14.2.2. By Product Type

            16.14.2.3. By End Use Industry

    16.15. Bangladesh

        16.15.1. Pricing Analysis

        16.15.2. Market Share Analysis, 2022

            16.15.2.1. By Base Oil

            16.15.2.2. By Product Type

            16.15.2.3. By End Use Industry

    16.16. Australia

        16.16.1. Pricing Analysis

        16.16.2. Market Share Analysis, 2022

            16.16.2.1. By Base Oil

            16.16.2.2. By Product Type

            16.16.2.3. By End Use Industry

    16.17. New Zealand

        16.17.1. Pricing Analysis

        16.17.2. Market Share Analysis, 2022

            16.17.2.1. By Base Oil

            16.17.2.2. By Product Type

            16.17.2.3. By End Use Industry

    16.18. China

        16.18.1. Pricing Analysis

        16.18.2. Market Share Analysis, 2022

            16.18.2.1. By Base Oil

            16.18.2.2. By Product Type

            16.18.2.3. By End Use Industry

    16.19. Japan

        16.19.1. Pricing Analysis

        16.19.2. Market Share Analysis, 2022

            16.19.2.1. By Base Oil

            16.19.2.2. By Product Type

            16.19.2.3. By End Use Industry

    16.20. South Korea

        16.20.1. Pricing Analysis

        16.20.2. Market Share Analysis, 2022

            16.20.2.1. By Base Oil

            16.20.2.2. By Product Type

            16.20.2.3. By End Use Industry

    16.21. GCC Countries

        16.21.1. Pricing Analysis

        16.21.2. Market Share Analysis, 2022

            16.21.2.1. By Base Oil

            16.21.2.2. By Product Type

            16.21.2.3. By End Use Industry

    16.22. South Africa

        16.22.1. Pricing Analysis

        16.22.2. Market Share Analysis, 2022

            16.22.2.1. By Base Oil

            16.22.2.2. By Product Type

            16.22.2.3. By End Use Industry

    16.23. Israel

        16.23.1. Pricing Analysis

        16.23.2. Market Share Analysis, 2022

            16.23.2.1. By Base Oil

            16.23.2.2. By Product Type

            16.23.2.3. By End Use Industry

17. Market Structure Analysis

    17.1. Competition Dashboard

    17.2. Competition Benchmarking

    17.3. Market Share Analysis of Top Players

        17.3.1. By Regional

        17.3.2. By Base Oil

        17.3.3. By Product Type

        17.3.4. By End Use Industry

18. Competition Analysis

    18.1. Competition Deep Dive

        18.1.1. ExxonMobil Corp.

            18.1.1.1. Overview

            18.1.1.2. Product Portfolio

            18.1.1.3. Profitability by Market Segments

            18.1.1.4. Sales Footprint

            18.1.1.5. Strategy Overview

                18.1.1.5.1. Marketing Strategy

                18.1.1.5.2. Product Strategy

                18.1.1.5.3. Channel Strategy

        18.1.2. Fuchs Lubricants

            18.1.2.1. Overview

            18.1.2.2. Product Portfolio

            18.1.2.3. Profitability by Market Segments

            18.1.2.4. Sales Footprint

            18.1.2.5. Strategy Overview

                18.1.2.5.1. Marketing Strategy

                18.1.2.5.2. Product Strategy

                18.1.2.5.3. Channel Strategy

        18.1.3. The Lubrizol Corp.

            18.1.3.1. Overview

            18.1.3.2. Product Portfolio

            18.1.3.3. Profitability by Market Segments

            18.1.3.4. Sales Footprint

            18.1.3.5. Strategy Overview

                18.1.3.5.1. Marketing Strategy

                18.1.3.5.2. Product Strategy

                18.1.3.5.3. Channel Strategy

        18.1.4. Royal Dutch Shell

            18.1.4.1. Overview

            18.1.4.2. Product Portfolio

            18.1.4.3. Profitability by Market Segments

            18.1.4.4. Sales Footprint

            18.1.4.5. Strategy Overview

                18.1.4.5.1. Marketing Strategy

                18.1.4.5.2. Product Strategy

                18.1.4.5.3. Channel Strategy

        18.1.5. Phillips 66

            18.1.5.1. Overview

            18.1.5.2. Product Portfolio

            18.1.5.3. Profitability by Market Segments

            18.1.5.4. Sales Footprint

            18.1.5.5. Strategy Overview

                18.1.5.5.1. Marketing Strategy

                18.1.5.5.2. Product Strategy

                18.1.5.5.3. Channel Strategy

        18.1.6. Lucas Oil Products Inc.

            18.1.6.1. Overview

            18.1.6.2. Product Portfolio

            18.1.6.3. Profitability by Market Segments

            18.1.6.4. Sales Footprint

            18.1.6.5. Strategy Overview

                18.1.6.5.1. Marketing Strategy

                18.1.6.5.2. Product Strategy

                18.1.6.5.3. Channel Strategy

        18.1.7. Amsoil, Inc.

            18.1.7.1. Overview

            18.1.7.2. Product Portfolio

            18.1.7.3. Profitability by Market Segments

            18.1.7.4. Sales Footprint

            18.1.7.5. Strategy Overview

                18.1.7.5.1. Marketing Strategy

                18.1.7.5.2. Product Strategy

                18.1.7.5.3. Channel Strategy

        18.1.8. Bel-Ray Co. Inc.

            18.1.8.1. Overview

            18.1.8.2. Product Portfolio

            18.1.8.3. Profitability by Market Segments

            18.1.8.4. Sales Footprint

            18.1.8.5. Strategy Overview

                18.1.8.5.1. Marketing Strategy

                18.1.8.5.2. Product Strategy

                18.1.8.5.3. Channel Strategy

        18.1.9. Total S.A

            18.1.9.1. Overview

            18.1.9.2. Product Portfolio

            18.1.9.3. Profitability by Market Segments

            18.1.9.4. Sales Footprint

            18.1.9.5. Strategy Overview

                18.1.9.5.1. Marketing Strategy

                18.1.9.5.2. Product Strategy

                18.1.9.5.3. Channel Strategy

        18.1.10. Kluber Lubrication

            18.1.10.1. Overview

            18.1.10.2. Product Portfolio

            18.1.10.3. Profitability by Market Segments

            18.1.10.4. Sales Footprint

            18.1.10.5. Strategy Overview

                18.1.10.5.1. Marketing Strategy

                18.1.10.5.2. Product Strategy

                18.1.10.5.3. Channel Strategy

        18.1.11. Valvoline International, Inc.

            18.1.11.1. Overview

            18.1.11.2. Product Portfolio

            18.1.11.3. Profitability by Market Segments

            18.1.11.4. Sales Footprint

            18.1.11.5. Strategy Overview

                18.1.11.5.1. Marketing Strategy

                18.1.11.5.2. Product Strategy

                18.1.11.5.3. Channel Strategy

        18.1.12. Chevron Corp.

            18.1.12.1. Overview

            18.1.12.2. Product Portfolio

            18.1.12.3. Profitability by Market Segments

            18.1.12.4. Sales Footprint

            18.1.12.5. Strategy Overview

                18.1.12.5.1. Marketing Strategy

                18.1.12.5.2. Product Strategy

                18.1.12.5.3. Channel Strategy

        18.1.13. Clariant

            18.1.13.1. Overview

            18.1.13.2. Product Portfolio

            18.1.13.3. Profitability by Market Segments

            18.1.13.4. Sales Footprint

            18.1.13.5. Strategy Overview

                18.1.13.5.1. Marketing Strategy

                18.1.13.5.2. Product Strategy

                18.1.13.5.3. Channel Strategy

        18.1.14. Quaker Chemical Corp.

            18.1.14.1. Overview

            18.1.14.2. Product Portfolio

            18.1.14.3. Profitability by Market Segments

            18.1.14.4. Sales Footprint

            18.1.14.5. Strategy Overview

                18.1.14.5.1. Marketing Strategy

                18.1.14.5.2. Product Strategy

                18.1.14.5.3. Channel Strategy

        18.1.15. Zeller+Gmelin GmbH & Co KG

            18.1.15.1. Overview

            18.1.15.2. Product Portfolio

            18.1.15.3. Profitability by Market Segments

            18.1.15.4. Sales Footprint

            18.1.15.5. Strategy Overview

                18.1.15.5.1. Marketing Strategy

                18.1.15.5.2. Product Strategy

                18.1.15.5.3. Channel Strategy

        18.1.16. Houghton International, Inc.

            18.1.16.1. Overview

            18.1.16.2. Product Portfolio

            18.1.16.3. Profitability by Market Segments

            18.1.16.4. Sales Footprint

            18.1.16.5. Strategy Overview

                18.1.16.5.1. Marketing Strategy

                18.1.16.5.2. Product Strategy

                18.1.16.5.3. Channel Strategy

        18.1.17. Castrol

            18.1.17.1. Overview

            18.1.17.2. Product Portfolio

            18.1.17.3. Profitability by Market Segments

            18.1.17.4. Sales Footprint

            18.1.17.5. Strategy Overview

                18.1.17.5.1. Marketing Strategy

                18.1.17.5.2. Product Strategy

                18.1.17.5.3. Channel Strategy

        18.1.18. Blaser Swisslube, Inc.

            18.1.18.1. Overview

            18.1.18.2. Product Portfolio

            18.1.18.3. Profitability by Market Segments

            18.1.18.4. Sales Footprint

            18.1.18.5. Strategy Overview

                18.1.18.5.1. Marketing Strategy

                18.1.18.5.2. Product Strategy

                18.1.18.5.3. Channel Strategy

        18.1.19. Calumet Specialty Product Partners LP

            18.1.19.1. Overview

            18.1.19.2. Product Portfolio

            18.1.19.3. Profitability by Market Segments

            18.1.19.4. Sales Footprint

            18.1.19.5. Strategy Overview

                18.1.19.5.1. Marketing Strategy

                18.1.19.5.2. Product Strategy

                18.1.19.5.3. Channel Strategy

19. Assumptions & Acronyms Used

20. Research Methodology

Don't pay for what you don't need

Customize your report by selecting specific countries or regions and save 30%!

List of Tables

Table 01: Global Market Value (US$ Million) Forecast by Region, 2018 to 2033

Table 02: Global Market Volume (Tons) Forecast by Region, 2018 to 2033

Table 03: Global Market Value (US$ Million) Forecast by Base Oil, 2018 to 2033

Table 04: Global Market Volume (Tons) Forecast by Base Oil, 2018 to 2033

Table 05: Global Market Value (US$ Million) Forecast by Product Type, 2018 to 2033

Table 06: Global Market Volume (Tons) Forecast by Product Type, 2018 to 2033

Table 07: Global Market Value (US$ Million) Forecast by End Use Industry, 2018 to 2033

Table 08: Global Market Volume (Tons) Forecast by End Use Industry, 2018 to 2033

Table 09: North America Market Value (US$ Million) Forecast by Country, 2018 to 2033

Table 10: North America Market Volume (Tons) Forecast by Country, 2018 to 2033

Table 11: North America Market Value (US$ Million) Forecast by Base Oil, 2018 to 2033

Table 12: North America Market Volume (Tons) Forecast by Base Oil, 2018 to 2033

Table 13: North America Market Value (US$ Million) Forecast by Product Type, 2018 to 2033

Table 14: North America Market Volume (Tons) Forecast by Product Type, 2018 to 2033

Table 15: North America Market Value (US$ Million) Forecast by End Use Industry, 2018 to 2033

Table 16: North America Market Volume (Tons) Forecast by End Use Industry, 2018 to 2033

Table 17: Latin America Market Value (US$ Million) Forecast by Country, 2018 to 2033

Table 18: Latin America Market Volume (Tons) Forecast by Country, 2018 to 2033

Table 19: Latin America Market Value (US$ Million) Forecast by Base Oil, 2018 to 2033

Table 20: Latin America Market Volume (Tons) Forecast by Base Oil, 2018 to 2033

Table 21: Latin America Market Value (US$ Million) Forecast by Product Type, 2018 to 2033

Table 22: Latin America Market Volume (Tons) Forecast by Product Type, 2018 to 2033

Table 23: Latin America Market Value (US$ Million) Forecast by End Use Industry, 2018 to 2033

Table 24: Latin America Market Volume (Tons) Forecast by End Use Industry, 2018 to 2033

Table 25: Western Europe Market Value (US$ Million) Forecast by Country, 2018 to 2033

Table 26: Western Europe Market Volume (Tons) Forecast by Country, 2018 to 2033

Table 27: Western Europe Market Value (US$ Million) Forecast by Base Oil, 2018 to 2033

Table 28: Western Europe Market Volume (Tons) Forecast by Base Oil, 2018 to 2033

Table 29: Western Europe Market Value (US$ Million) Forecast by Product Type, 2018 to 2033

Table 30: Western Europe Market Volume (Tons) Forecast by Product Type, 2018 to 2033

Table 31: Western Europe Market Value (US$ Million) Forecast by End Use Industry, 2018 to 2033

Table 32: Western Europe Market Volume (Tons) Forecast by End Use Industry, 2018 to 2033

Table 33: Eastern Europe Market Value (US$ Million) Forecast by Country, 2018 to 2033

Table 34: Eastern Europe Market Volume (Tons) Forecast by Country, 2018 to 2033

Table 35: Eastern Europe Market Value (US$ Million) Forecast by Base Oil, 2018 to 2033

Table 36: Eastern Europe Market Volume (Tons) Forecast by Base Oil, 2018 to 2033

Table 37: Eastern Europe Market Value (US$ Million) Forecast by Product Type, 2018 to 2033

Table 38: Eastern Europe Market Volume (Tons) Forecast by Product Type, 2018 to 2033

Table 39: Eastern Europe Market Value (US$ Million) Forecast by End Use Industry, 2018 to 2033

Table 40: Eastern Europe Market Volume (Tons) Forecast by End Use Industry, 2018 to 2033

Table 41: South Asia and Pacific Market Value (US$ Million) Forecast by Country, 2018 to 2033

Table 42: South Asia and Pacific Market Volume (Tons) Forecast by Country, 2018 to 2033

Table 43: South Asia and Pacific Market Value (US$ Million) Forecast by Base Oil, 2018 to 2033

Table 44: South Asia and Pacific Market Volume (Tons) Forecast by Base Oil, 2018 to 2033

Table 45: South Asia and Pacific Market Value (US$ Million) Forecast by Product Type, 2018 to 2033

Table 46: South Asia and Pacific Market Volume (Tons) Forecast by Product Type, 2018 to 2033

Table 47: South Asia and Pacific Market Value (US$ Million) Forecast by End Use Industry, 2018 to 2033

Table 48: South Asia and Pacific Market Volume (Tons) Forecast by End Use Industry, 2018 to 2033

Table 49: East Asia Market Value (US$ Million) Forecast by Country, 2018 to 2033

Table 50: East Asia Market Volume (Tons) Forecast by Country, 2018 to 2033

Table 51: East Asia Market Value (US$ Million) Forecast by Base Oil, 2018 to 2033

Table 52: East Asia Market Volume (Tons) Forecast by Base Oil, 2018 to 2033

Table 53: East Asia Market Value (US$ Million) Forecast by Product Type, 2018 to 2033

Table 54: East Asia Market Volume (Tons) Forecast by Product Type, 2018 to 2033

Table 55: East Asia Market Value (US$ Million) Forecast by End Use Industry, 2018 to 2033

Table 56: East Asia Market Volume (Tons) Forecast by End Use Industry, 2018 to 2033

Table 57: Middle East and Africa Market Value (US$ Million) Forecast by Country, 2018 to 2033

Table 58: Middle East and Africa Market Volume (Tons) Forecast by Country, 2018 to 2033

Table 59: Middle East and Africa Market Value (US$ Million) Forecast by Base Oil, 2018 to 2033

Table 60: Middle East and Africa Market Volume (Tons) Forecast by Base Oil, 2018 to 2033

Table 61: Middle East and Africa Market Value (US$ Million) Forecast by Product Type, 2018 to 2033

Table 62: Middle East and Africa Market Volume (Tons) Forecast by Product Type, 2018 to 2033

Table 63: Middle East and Africa Market Value (US$ Million) Forecast by End Use Industry, 2018 to 2033

Table 64: Middle East and Africa Market Volume (Tons) Forecast by End Use Industry, 2018 to 2033
Nikhil Kaitwade
Nikhil Kaitwade

Principal Consultant

Talk to Analyst

Find your sweet spots for generating winning opportunities in this market.

List of Charts

Figure 01: Global Market Value (US$ Million) by Base Oil, 2023 to 2033

Figure 02: Global Market Value (US$ Million) by Product Type, 2023 to 2033

Figure 03: Global Market Value (US$ Million) by End Use Industry, 2023 to 2033

Figure 04: Global Market Value (US$ Million) by Region, 2023 to 2033

Figure 05: Global Market Value (US$ Million) Analysis by Region, 2018 to 2033

Figure 06: Global Market Volume (Tons) Analysis by Region, 2018 to 2033

Figure 07: Global Market Value Share (%) and BPS Analysis by Region, 2023 to 2033

Figure 08: Global Market Y-o-Y Growth (%) Projections by Region, 2023 to 2033

Figure 09: Global Market Value (US$ Million) Analysis by Base Oil, 2018 to 2033

Figure 10: Global Market Volume (Tons) Analysis by Base Oil, 2018 to 2033

Figure 11: Global Market Value Share (%) and BPS Analysis by Base Oil, 2023 to 2033

Figure 12: Global Market Y-o-Y Growth (%) Projections by Base Oil, 2023 to 2033

Figure 13: Global Market Value (US$ Million) Analysis by Product Type, 2018 to 2033

Figure 14: Global Market Volume (Tons) Analysis by Product Type, 2018 to 2033

Figure 15: Global Market Value Share (%) and BPS Analysis by Product Type, 2023 to 2033

Figure 16: Global Market Y-o-Y Growth (%) Projections by Product Type, 2023 to 2033

Figure 17: Global Market Value (US$ Million) Analysis by End Use Industry, 2018 to 2033

Figure 18: Global Market Volume (Tons) Analysis by End Use Industry, 2018 to 2033

Figure 19: Global Market Value Share (%) and BPS Analysis by End Use Industry, 2023 to 2033

Figure 20: Global Market Y-o-Y Growth (%) Projections by End Use Industry, 2023 to 2033

Figure 21: Global Market Attractiveness by Base Oil, 2023 to 2033

Figure 22: Global Market Attractiveness by Product Type, 2023 to 2033

Figure 23: Global Market Attractiveness by End Use Industry, 2023 to 2033

Figure 24: Global Market Attractiveness by Region, 2023 to 2033

Figure 25: North America Market Value (US$ Million) by Base Oil, 2023 to 2033

Figure 26: North America Market Value (US$ Million) by Product Type, 2023 to 2033

Figure 27: North America Market Value (US$ Million) by End Use Industry, 2023 to 2033

Figure 28: North America Market Value (US$ Million) by Country, 2023 to 2033

Figure 29: North America Market Value (US$ Million) Analysis by Country, 2018 to 2033

Figure 30: North America Market Volume (Tons) Analysis by Country, 2018 to 2033

Figure 31: North America Market Value Share (%) and BPS Analysis by Country, 2023 to 2033

Figure 32: North America Market Y-o-Y Growth (%) Projections by Country, 2023 to 2033

Figure 33: North America Market Value (US$ Million) Analysis by Base Oil, 2018 to 2033

Figure 34: North America Market Volume (Tons) Analysis by Base Oil, 2018 to 2033

Figure 35: North America Market Value Share (%) and BPS Analysis by Base Oil, 2023 to 2033

Figure 36: North America Market Y-o-Y Growth (%) Projections by Base Oil, 2023 to 2033

Figure 37: North America Market Value (US$ Million) Analysis by Product Type, 2018 to 2033

Figure 38: North America Market Volume (Tons) Analysis by Product Type, 2018 to 2033

Figure 39: North America Market Value Share (%) and BPS Analysis by Product Type, 2023 to 2033

Figure 40: North America Market Y-o-Y Growth (%) Projections by Product Type, 2023 to 2033

Figure 41: North America Market Value (US$ Million) Analysis by End Use Industry, 2018 to 2033

Figure 42: North America Market Volume (Tons) Analysis by End Use Industry, 2018 to 2033

Figure 43: North America Market Value Share (%) and BPS Analysis by End Use Industry, 2023 to 2033

Figure 44: North America Market Y-o-Y Growth (%) Projections by End Use Industry, 2023 to 2033

Figure 45: North America Market Attractiveness by Base Oil, 2023 to 2033

Figure 46: North America Market Attractiveness by Product Type, 2023 to 2033

Figure 47: North America Market Attractiveness by End Use Industry, 2023 to 2033

Figure 48: North America Market Attractiveness by Country, 2023 to 2033

Figure 49: Latin America Market Value (US$ Million) by Base Oil, 2023 to 2033

Figure 50: Latin America Market Value (US$ Million) by Product Type, 2023 to 2033

Figure 51: Latin America Market Value (US$ Million) by End Use Industry, 2023 to 2033

Figure 52: Latin America Market Value (US$ Million) by Country, 2023 to 2033

Figure 53: Latin America Market Value (US$ Million) Analysis by Country, 2018 to 2033

Figure 54: Latin America Market Volume (Tons) Analysis by Country, 2018 to 2033

Figure 55: Latin America Market Value Share (%) and BPS Analysis by Country, 2023 to 2033

Figure 56: Latin America Market Y-o-Y Growth (%) Projections by Country, 2023 to 2033

Figure 57: Latin America Market Value (US$ Million) Analysis by Base Oil, 2018 to 2033

Figure 58: Latin America Market Volume (Tons) Analysis by Base Oil, 2018 to 2033

Figure 59: Latin America Market Value Share (%) and BPS Analysis by Base Oil, 2023 to 2033

Figure 60: Latin America Market Y-o-Y Growth (%) Projections by Base Oil, 2023 to 2033

Figure 61: Latin America Market Value (US$ Million) Analysis by Product Type, 2018 to 2033

Figure 62: Latin America Market Volume (Tons) Analysis by Product Type, 2018 to 2033

Figure 63: Latin America Market Value Share (%) and BPS Analysis by Product Type, 2023 to 2033

Figure 64: Latin America Market Y-o-Y Growth (%) Projections by Product Type, 2023 to 2033

Figure 65: Latin America Market Value (US$ Million) Analysis by End Use Industry, 2018 to 2033

Figure 66: Latin America Market Volume (Tons) Analysis by End Use Industry, 2018 to 2033

Figure 67: Latin America Market Value Share (%) and BPS Analysis by End Use Industry, 2023 to 2033

Figure 68: Latin America Market Y-o-Y Growth (%) Projections by End Use Industry, 2023 to 2033

Figure 69: Latin America Market Attractiveness by Base Oil, 2023 to 2033

Figure 70: Latin America Market Attractiveness by Product Type, 2023 to 2033

Figure 71: Latin America Market Attractiveness by End Use Industry, 2023 to 2033

Figure 72: Latin America Market Attractiveness by Country, 2023 to 2033

Figure 73: Western Europe Market Value (US$ Million) by Base Oil, 2023 to 2033

Figure 74: Western Europe Market Value (US$ Million) by Product Type, 2023 to 2033

Figure 75: Western Europe Market Value (US$ Million) by End Use Industry, 2023 to 2033

Figure 76: Western Europe Market Value (US$ Million) by Country, 2023 to 2033

Figure 77: Western Europe Market Value (US$ Million) Analysis by Country, 2018 to 2033

Figure 78: Western Europe Market Volume (Tons) Analysis by Country, 2018 to 2033

Figure 79: Western Europe Market Value Share (%) and BPS Analysis by Country, 2023 to 2033

Figure 80: Western Europe Market Y-o-Y Growth (%) Projections by Country, 2023 to 2033

Figure 81: Western Europe Market Value (US$ Million) Analysis by Base Oil, 2018 to 2033

Figure 82: Western Europe Market Volume (Tons) Analysis by Base Oil, 2018 to 2033

Figure 83: Western Europe Market Value Share (%) and BPS Analysis by Base Oil, 2023 to 2033

Figure 84: Western Europe Market Y-o-Y Growth (%) Projections by Base Oil, 2023 to 2033

Figure 85: Western Europe Market Value (US$ Million) Analysis by Product Type, 2018 to 2033

Figure 86: Western Europe Market Volume (Tons) Analysis by Product Type, 2018 to 2033

Figure 87: Western Europe Market Value Share (%) and BPS Analysis by Product Type, 2023 to 2033

Figure 88: Western Europe Market Y-o-Y Growth (%) Projections by Product Type, 2023 to 2033

Figure 89: Western Europe Market Value (US$ Million) Analysis by End Use Industry, 2018 to 2033

Figure 90: Western Europe Market Volume (Tons) Analysis by End Use Industry, 2018 to 2033

Figure 91: Western Europe Market Value Share (%) and BPS Analysis by End Use Industry, 2023 to 2033

Figure 92: Western Europe Market Y-o-Y Growth (%) Projections by End Use Industry, 2023 to 2033

Figure 93: Western Europe Market Attractiveness by Base Oil, 2023 to 2033

Figure 94: Western Europe Market Attractiveness by Product Type, 2023 to 2033

Figure 95: Western Europe Market Attractiveness by End Use Industry, 2023 to 2033

Figure 96: Western Europe Market Attractiveness by Country, 2023 to 2033

Figure 97: Eastern Europe Market Value (US$ Million) by Base Oil, 2023 to 2033

Figure 98: Eastern Europe Market Value (US$ Million) by Product Type, 2023 to 2033

Figure 99: Eastern Europe Market Value (US$ Million) by End Use Industry, 2023 to 2033

Figure 100: Eastern Europe Market Value (US$ Million) by Country, 2023 to 2033

Figure 101: Eastern Europe Market Value (US$ Million) Analysis by Country, 2018 to 2033

Figure 102: Eastern Europe Market Volume (Tons) Analysis by Country, 2018 to 2033

Figure 103: Eastern Europe Market Value Share (%) and BPS Analysis by Country, 2023 to 2033

Figure 104: Eastern Europe Market Y-o-Y Growth (%) Projections by Country, 2023 to 2033

Figure 105: Eastern Europe Market Value (US$ Million) Analysis by Base Oil, 2018 to 2033

Figure 106: Eastern Europe Market Volume (Tons) Analysis by Base Oil, 2018 to 2033

Figure 107: Eastern Europe Market Value Share (%) and BPS Analysis by Base Oil, 2023 to 2033

Figure 108: Eastern Europe Market Y-o-Y Growth (%) Projections by Base Oil, 2023 to 2033

Figure 109: Eastern Europe Market Value (US$ Million) Analysis by Product Type, 2018 to 2033

Figure 110: Eastern Europe Market Volume (Tons) Analysis by Product Type, 2018 to 2033

Figure 111: Eastern Europe Market Value Share (%) and BPS Analysis by Product Type, 2023 to 2033

Figure 112: Eastern Europe Market Y-o-Y Growth (%) Projections by Product Type, 2023 to 2033

Figure 113: Eastern Europe Market Value (US$ Million) Analysis by End Use Industry, 2018 to 2033

Figure 114: Eastern Europe Market Volume (Tons) Analysis by End Use Industry, 2018 to 2033

Figure 115: Eastern Europe Market Value Share (%) and BPS Analysis by End Use Industry, 2023 to 2033

Figure 116: Eastern Europe Market Y-o-Y Growth (%) Projections by End Use Industry, 2023 to 2033

Figure 117: Eastern Europe Market Attractiveness by Base Oil, 2023 to 2033

Figure 118: Eastern Europe Market Attractiveness by Product Type, 2023 to 2033

Figure 119: Eastern Europe Market Attractiveness by End Use Industry, 2023 to 2033

Figure 120: Eastern Europe Market Attractiveness by Country, 2023 to 2033

Figure 121: South Asia and Pacific Market Value (US$ Million) by Base Oil, 2023 to 2033

Figure 122: South Asia and Pacific Market Value (US$ Million) by Product Type, 2023 to 2033

Figure 123: South Asia and Pacific Market Value (US$ Million) by End Use Industry, 2023 to 2033

Figure 124: South Asia and Pacific Market Value (US$ Million) by Country, 2023 to 2033

Figure 125: South Asia and Pacific Market Value (US$ Million) Analysis by Country, 2018 to 2033

Figure 126: South Asia and Pacific Market Volume (Tons) Analysis by Country, 2018 to 2033

Figure 127: South Asia and Pacific Market Value Share (%) and BPS Analysis by Country, 2023 to 2033

Figure 128: South Asia and Pacific Market Y-o-Y Growth (%) Projections by Country, 2023 to 2033

Figure 129: South Asia and Pacific Market Value (US$ Million) Analysis by Base Oil, 2018 to 2033

Figure 130: South Asia and Pacific Market Volume (Tons) Analysis by Base Oil, 2018 to 2033

Figure 131: South Asia and Pacific Market Value Share (%) and BPS Analysis by Base Oil, 2023 to 2033

Figure 132: South Asia and Pacific Market Y-o-Y Growth (%) Projections by Base Oil, 2023 to 2033

Figure 133: South Asia and Pacific Market Value (US$ Million) Analysis by Product Type, 2018 to 2033

Figure 134: South Asia and Pacific Market Volume (Tons) Analysis by Product Type, 2018 to 2033

Figure 135: South Asia and Pacific Market Value Share (%) and BPS Analysis by Product Type, 2023 to 2033

Figure 136: South Asia and Pacific Market Y-o-Y Growth (%) Projections by Product Type, 2023 to 2033

Figure 137: South Asia and Pacific Market Value (US$ Million) Analysis by End Use Industry, 2018 to 2033

Figure 138: South Asia and Pacific Market Volume (Tons) Analysis by End Use Industry, 2018 to 2033

Figure 139: South Asia and Pacific Market Value Share (%) and BPS Analysis by End Use Industry, 2023 to 2033

Figure 140: South Asia and Pacific Market Y-o-Y Growth (%) Projections by End Use Industry, 2023 to 2033

Figure 141: South Asia and Pacific Market Attractiveness by Base Oil, 2023 to 2033

Figure 142: South Asia and Pacific Market Attractiveness by Product Type, 2023 to 2033

Figure 143: South Asia and Pacific Market Attractiveness by End Use Industry, 2023 to 2033

Figure 144: South Asia and Pacific Market Attractiveness by Country, 2023 to 2033

Figure 145: East Asia Market Value (US$ Million) by Base Oil, 2023 to 2033

Figure 146: East Asia Market Value (US$ Million) by Product Type, 2023 to 2033

Figure 147: East Asia Market Value (US$ Million) by End Use Industry, 2023 to 2033

Figure 148: East Asia Market Value (US$ Million) by Country, 2023 to 2033

Figure 149: East Asia Market Value (US$ Million) Analysis by Country, 2018 to 2033

Figure 150: East Asia Market Volume (Tons) Analysis by Country, 2018 to 2033

Figure 151: East Asia Market Value Share (%) and BPS Analysis by Country, 2023 to 2033

Figure 152: East Asia Market Y-o-Y Growth (%) Projections by Country, 2023 to 2033

Figure 153: East Asia Market Value (US$ Million) Analysis by Base Oil, 2018 to 2033

Figure 154: East Asia Market Volume (Tons) Analysis by Base Oil, 2018 to 2033

Figure 155: East Asia Market Value Share (%) and BPS Analysis by Base Oil, 2023 to 2033

Figure 156: East Asia Market Y-o-Y Growth (%) Projections by Base Oil, 2023 to 2033

Figure 157: East Asia Market Value (US$ Million) Analysis by Product Type, 2018 to 2033

Figure 158: East Asia Market Volume (Tons) Analysis by Product Type, 2018 to 2033

Figure 159: East Asia Market Value Share (%) and BPS Analysis by Product Type, 2023 to 2033

Figure 160: East Asia Market Y-o-Y Growth (%) Projections by Product Type, 2023 to 2033

Figure 161: East Asia Market Value (US$ Million) Analysis by End Use Industry, 2018 to 2033

Figure 162: East Asia Market Volume (Tons) Analysis by End Use Industry, 2018 to 2033

Figure 163: East Asia Market Value Share (%) and BPS Analysis by End Use Industry, 2023 to 2033

Figure 164: East Asia Market Y-o-Y Growth (%) Projections by End Use Industry, 2023 to 2033

Figure 165: East Asia Market Attractiveness by Base Oil, 2023 to 2033

Figure 166: East Asia Market Attractiveness by Product Type, 2023 to 2033

Figure 167: East Asia Market Attractiveness by End Use Industry, 2023 to 2033

Figure 168: East Asia Market Attractiveness by Country, 2023 to 2033

Figure 169: Middle East and Africa Market Value (US$ Million) by Base Oil, 2023 to 2033

Figure 170: Middle East and Africa Market Value (US$ Million) by Product Type, 2023 to 2033

Figure 171: Middle East and Africa Market Value (US$ Million) by End Use Industry, 2023 to 2033

Figure 172: Middle East and Africa Market Value (US$ Million) by Country, 2023 to 2033

Figure 173: Middle East and Africa Market Value (US$ Million) Analysis by Country, 2018 to 2033

Figure 174: Middle East and Africa Market Volume (Tons) Analysis by Country, 2018 to 2033

Figure 175: Middle East and Africa Market Value Share (%) and BPS Analysis by Country, 2023 to 2033

Figure 176: Middle East and Africa Market Y-o-Y Growth (%) Projections by Country, 2023 to 2033

Figure 177: Middle East and Africa Market Value (US$ Million) Analysis by Base Oil, 2018 to 2033

Figure 178: Middle East and Africa Market Volume (Tons) Analysis by Base Oil, 2018 to 2033

Figure 179: Middle East and Africa Market Value Share (%) and BPS Analysis by Base Oil, 2023 to 2033

Figure 180: Middle East and Africa Market Y-o-Y Growth (%) Projections by Base Oil, 2023 to 2033

Figure 181: Middle East and Africa Market Value (US$ Million) Analysis by Product Type, 2018 to 2033

Figure 182: Middle East and Africa Market Volume (Tons) Analysis by Product Type, 2018 to 2033

Figure 183: Middle East and Africa Market Value Share (%) and BPS Analysis by Product Type, 2023 to 2033

Figure 184: Middle East and Africa Market Y-o-Y Growth (%) Projections by Product Type, 2023 to 2033

Figure 185: Middle East and Africa Market Value (US$ Million) Analysis by End Use Industry, 2018 to 2033

Figure 186: Middle East and Africa Market Volume (Tons) Analysis by End Use Industry, 2018 to 2033

Figure 187: Middle East and Africa Market Value Share (%) and BPS Analysis by End Use Industry, 2023 to 2033

Figure 188: Middle East and Africa Market Y-o-Y Growth (%) Projections by End Use Industry, 2023 to 2033

Figure 189: Middle East and Africa Market Attractiveness by Base Oil, 2023 to 2033

Figure 190: Middle East and Africa Market Attractiveness by Product Type, 2023 to 2033

Figure 191: Middle East and Africa Market Attractiveness by End Use Industry, 2023 to 2033

Figure 192: Middle East and Africa Market Attractiveness by Country, 2023 to 2033

Recommendations

Chemicals & Materials

Lubricant Market

Published : February 2024

Chemicals & Materials

Lubricant Additives Market

Published : June 2023

Explore Chemicals & Materials Insights

View Reports

Industrial Lubricants Market