The global lubricant market is valued at USD 182.8 billion in 2025. It is slated to reach USD 283.9 billion by 2035, recording an absolute increase of USD 101.1 billion over the forecast period. This translates into a total growth of 55.3%, with the market forecast to expand at a CAGR of 4.5% between 2025 and 2035. According to validated data from FMI’s Chemical Industry Analytics, tracking raw material price and sustainability drivers, the overall market size is expected to grow by nearly 1.55X during the same period, supported by increasing demand for high-performance synthetic lubricants in automotive and industrial applications, growing adoption of extended-drain-interval formulations reducing maintenance frequency, and rising emphasis on energy-efficient fluids across diverse automotive, manufacturing, and energy generation applications.
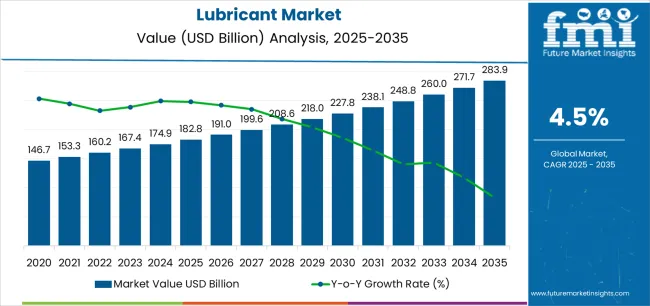
Between 2025 and 2030, the lubricant market is projected to expand from USD 182.8 billion to USD 227.8 billion, resulting in a value increase of USD 45.0 billion, which represents 44.5% of the total forecast growth for the decade. This phase of development will be shaped by increasing vehicle production and fleet expansion in emerging markets, rising industrial automation driving metalworking fluid demand, and growing adoption of premium synthetic lubricants that ensure extended service intervals and improved equipment protection. Automotive original equipment manufacturers and industrial machinery operators are expanding their lubricant consumption to address the growing demand for fuel-efficient formulations and equipment reliability solutions.
| Metric | Value |
|---|---|
| Estimated Value in (2025E) | USD 182.8 billion |
| Forecast Value in (2035F) | USD 283.9 billion |
| Forecast CAGR (2025 to 2035) | 4.5% |
From 2030 to 2035, the market is forecast to grow from USD 227.8 billion to USD 283.9 billion, adding another USD 56.1 billion, which constitutes 55.5% of the overall ten-year expansion. This period is expected to be characterized by the expansion of electric vehicle thermal management fluids including e-axle and battery cooling systems, the development of bio-based and recycled lubricant formulations supporting circular economy principles, and the growth of specialized applications for wind turbine gear oils, data center cooling fluids, and robotics precision lubricants. The growing adoption of Industry 4.0 predictive maintenance systems and extended producer responsibility regulations will drive demand for lubricants with enhanced performance characteristics, verifiable sustainability credentials, and comprehensive digital monitoring compatibility.
Between 2020 and 2025, the lubricant market experienced steady growth, driven by recovering automotive production following pandemic disruptions and growing recognition of synthetic lubricants as essential performance fluids delivering fuel economy benefits, extended drain intervals, and superior equipment protection across passenger vehicles, commercial fleets, and industrial machinery. The market developed as fleet operators and maintenance managers recognized the potential for premium lubricants to reduce total cost of ownership while supporting emission compliance and operational efficiency objectives. Technological advancement in additive chemistry and base oil refining began emphasizing the critical importance of maintaining equipment reliability while addressing environmental regulations and energy efficiency requirements.
Market expansion is being supported by the increasing global vehicle population and fleet operations requiring regular maintenance lubricants and the corresponding need for high-performance motor oils, transmission fluids, and drivetrain lubricants that can protect modern engines, support fuel efficiency regulations, and ensure reliable operation across various passenger cars, commercial vehicles, and off-highway equipment. Modern automotive manufacturers and fleet operators are increasingly focused on implementing lubricant solutions that can extend service intervals, reduce friction losses, and provide emission system compatibility while meeting stringent original equipment manufacturer specifications. Synthetic lubricants' proven ability to deliver superior thermal stability, enhanced oxidation resistance, and consistent viscosity performance makes them essential fluids for contemporary vehicle and equipment operation.
The growing emphasis on industrial automation and manufacturing productivity is driving demand for metalworking fluids, hydraulic oils, and gear lubricants that can support high-speed machining operations, ensure hydraulic system reliability, and enable precision manufacturing while reducing maintenance downtime and extending equipment life. Industrial operators' preference for premium lubricants that combine performance reliability with extended service life and condition monitoring compatibility is creating opportunities for innovative lubricant formulations. The rising influence of sustainability regulations and circular economy principles is also contributing to increased adoption of bio-based and recycled-content lubricants that can provide documented environmental benefits without compromising equipment protection or operational performance across manufacturing, mining, and marine applications.
The market is segmented by base oil, product type, end-user vertical, and region. By base oil, the market is divided into synthetic oil, mineral oil, and bio-based oil. Based on product type, the market is categorized into automotive oil, hydraulic oil, metalworking fluid, gear oil, compressor oil, and greases. By end-user vertical, the market covers automotive, industrial, oil & gas, marine, chemical, aerospace, and others (including power generation, construction equipment, agriculture, and food processing). Regionally, the market is divided into Asia Pacific, Europe, North America, Latin America, and the Middle East & Africa.
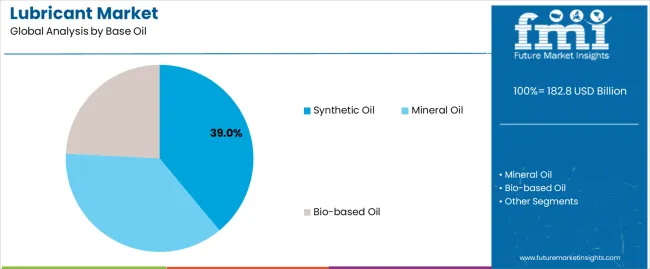
The synthetic oil segment is projected to maintain its leading position in the lubricant market in 2025 with a commanding 39.0% market share, reaffirming its role as the preferred base oil category for premium lubricant formulations requiring superior performance characteristics including exceptional low-temperature fluidity, enhanced high-temperature stability, and extended oxidation resistance.
Automotive manufacturers and industrial equipment operators increasingly utilize synthetic lubricants for their superior viscosity index enabling consistent performance across temperature extremes, reduced friction coefficients supporting fuel economy and energy efficiency, and extended drain intervals reducing maintenance costs and downtime. Synthetic base oil technology's proven effectiveness in delivering superior equipment protection directly addresses requirements for extended service life and operational reliability.
This base oil segment forms the foundation of premium lubricant formulations, representing the technology with the greatest performance advantages across passenger vehicle engine oils, heavy-duty commercial lubricants, and demanding industrial applications including robotics, precision machining, and high-pressure hydraulic systems. Industry investments in Group III and synthetic base stock production continue to strengthen adoption among lubricant blenders and original equipment manufacturers. With emission regulations requiring low-viscosity formulations and equipment manufacturers specifying extended service intervals, synthetic base oils align with both regulatory objectives and total cost of ownership optimization, making them the central component of comprehensive fleet management and industrial maintenance strategies.
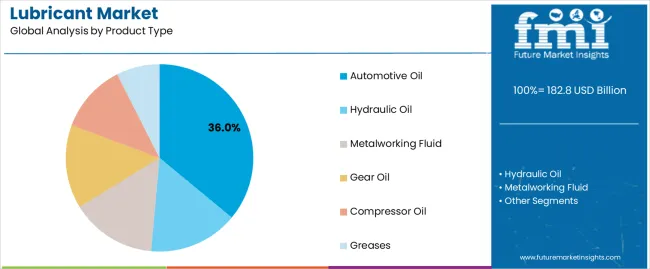
The automotive oil product type segment is projected to represent the largest share of lubricant demand in 2025 with 36.0% market share, underscoring its critical role as the primary driver for lubricant consumption across passenger car motor oils, heavy-duty diesel engine oils, transmission fluids, and drivetrain lubricants serving global vehicle populations. Automotive lubricant formulators prefer advanced base oils and additive packages for their ability to protect modern turbocharged engines, support emission control systems including diesel particulate filters and catalytic converters, and deliver fuel economy improvements through friction reduction while maintaining engine cleanliness and wear protection. Positioned as essential maintenance products for vehicle reliability, automotive oils offer both equipment protection and regulatory compliance benefits.
The segment is supported by continuous innovation in low-viscosity formulations and the growing availability of synthetic and semi-synthetic motor oils that enable extended drain intervals, enhanced fuel efficiency, and superior temperature performance across diverse operating conditions and climates. Additionally, automotive manufacturers are investing in factory-fill specifications and extended service programs to support warranty requirements and customer satisfaction objectives. As vehicle technology advances with turbocharging, direct injection, and hybrid powertrains, the automotive oil segment will continue to dominate the market while supporting advanced engine protection and emission compliance strategies across global automotive markets.
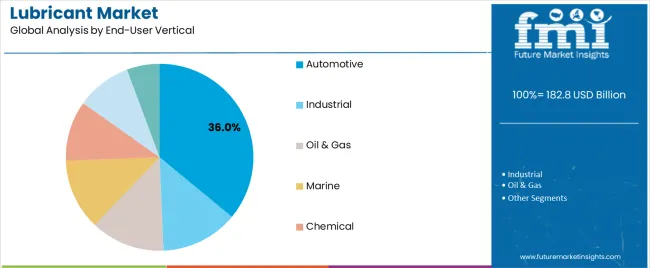
The automotive end-user vertical segment commands the largest market share at 36.0% in 2025, reflecting its established position as the most volume-intensive sector for lubricant consumption across passenger vehicles, light commercial vehicles, heavy-duty trucks, buses, and motorcycles requiring regular oil changes and drivetrain maintenance. This segment benefits from the global vehicle population exceeding 1.4 billion units generating recurring lubricant demand through scheduled maintenance intervals, the growing complexity of modern engines requiring premium lubricant specifications, and expanding fleet operations supporting commercial transportation and logistics services. The extensive use of engine oils, transmission fluids, and drivetrain lubricants in automotive applications combined with aftermarket service demand supports automotive segment dominance.
Industrial follows with 25.0% share, utilizing metalworking fluids, hydraulic oils, gear lubricants, and compressor oils across manufacturing, mining, and construction equipment applications. Oil & gas accounts for 9.0%, serving drilling operations, compressors, and turbines in energy production. Marine holds 8.0% share, encompassing marine engine oils and environmentally acceptable lubricants for shipping and offshore operations. Chemical represents 6.0%, serving processing equipment and specialty applications. Aerospace accounts for 4.0%, including turbine oils and aviation hydraulic fluids. Others hold 12.0%, encompassing power generation, agriculture, construction equipment, and food processing applications requiring specialized lubricants.
The lubricant market is advancing steadily due to increasing global vehicle production and fleet expansion in emerging markets and growing adoption of premium synthetic formulations that provide extended service intervals, superior equipment protection, and fuel efficiency benefits across diverse automotive, industrial, and specialty applications.
The market faces challenges, including electric vehicle adoption reducing traditional automotive lubricant demand as EVs require fewer lubricants than internal combustion engine vehicles, extended drain interval trends reducing lubricant consumption frequency despite performance benefits, and competition from remanufactured and recycled lubricants offering cost advantages in price-sensitive markets. Innovation in specialized fluids for electric vehicle thermal management and bio-based formulations continues to influence product development and market expansion patterns.
The growing adoption of electric vehicles and hybrid powertrains is enabling lubricant manufacturers to develop specialized fluids including e-axle oils providing electrical insulation and thermal conductivity, battery cooling fluids managing thermal performance in lithium-ion battery systems, and power electronics cooling solutions supporting inverter and charging system reliability. These emerging applications provide growth opportunities offsetting traditional engine oil volume declines as electrification progresses. Advanced electric vehicle fluid formulations also allow lubricant suppliers to support comprehensive electrification strategies and differentiate products beyond conventional automotive applications, creating competitive advantages in emerging mobility segments and supporting long-term strategic positioning as automotive industry transforms toward battery electric and fuel cell technologies.
Modern lubricant manufacturers are incorporating recycled and re-refined base oils produced through advanced hydroprocessing of used lubricant oils to enhance environmental credentials, reduce virgin base oil consumption, and support circular economy principles while maintaining performance equivalence with virgin base stocks through sophisticated purification and treatment processes. These sustainable base oils improve life cycle environmental performance while enabling carbon footprint reduction and resource efficiency. Advanced recycling technologies also allow manufacturers to support comprehensive sustainability objectives and differentiate products beyond conventional petroleum-derived formulations, creating competitive advantages in environmentally-conscious procurement decisions and addressing extended producer responsibility regulations driving lubricant packaging recovery and base oil recycling across European and North American markets.
The emergence of smart lubrication systems, sensor-enabled equipment monitoring, and predictive maintenance platforms is creating opportunities for lubricant suppliers to provide integrated solutions combining premium fluids with digital monitoring services, oil analysis programs, and equipment health diagnostics that optimize lubricant change intervals, prevent equipment failures, and reduce total cost of ownership through data-driven maintenance strategies. These value-added services enable lubricant companies to strengthen customer relationships, support subscription-based business models, and differentiate offerings beyond product specifications through comprehensive lubrication management programs. Leading industrial lubricant suppliers are investing in IoT connectivity, artificial intelligence analytics, and remote monitoring capabilities that enable predictive maintenance recommendations, automated reorder systems, and equipment performance optimization supporting customer operational excellence and creating competitive barriers through service integration across manufacturing, mining, and transportation fleets.
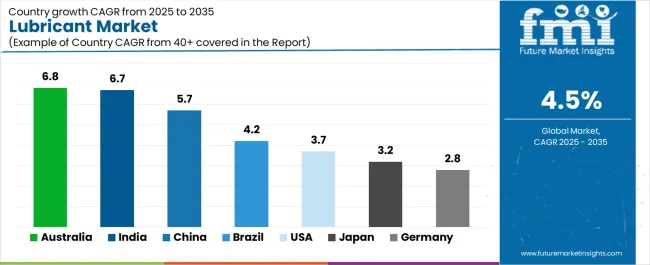
| Country | CAGR (2025-2035) |
|---|---|
| Australia | 6.8% |
| India | 6.7% |
| China | 5.7% |
| Brazil | 4.2% |
| United States | 3.7% |
| Japan | 3.2% |
| Germany | 2.8% |
The market is experiencing solid growth globally, with Australia leading at a 6.8% CAGR through 2035, driven by mining and offshore project expansion, extended-drain synthetic lubricants adoption in remote operations requiring reduced maintenance frequency, and growing industrial activity supporting specialty lubricant demand. India follows at 6.7%, supported by fast-growing vehicle population, production-linked incentive schemes driving base stock and additive manufacturing capacity, and logistics fleet expansion requiring commercial vehicle lubricants. China shows growth at 5.7%, emphasizing Group III base oil production expansion, electric vehicle niche applications for dielectric and e-gear oils, and industrial automation driving metalworking fluid demand.
Brazil records 4.2%, focusing on agribusiness equipment, offshore floating production storage and offloading vessel operations, and ester-based bio-hydraulic fluid adoption. The United States demonstrates 3.7% growth, supported by high synthetic lubricant penetration, wind turbine and data center fluid applications, and Industrial Internet of Things maintenance service bundles. Japan exhibits 3.2% growth, emphasizing robotics and precision machining lubricants with hybrid and electric vehicle factory-fill specifications. Germany shows 2.8% growth, supported by EU Green Deal alignment, offshore wind turbine gear oils, and recyclable packaging programs.
The report covers an in-depth analysis of 40+ countries, Top-performing countries are highlighted below.
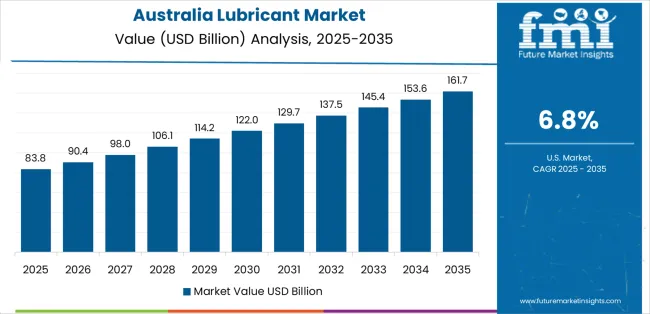
The lubricants market in Australia is projected to exhibit exceptional growth with a CAGR of 6.8% through 2035, driven by expanding mining operations requiring heavy-duty lubricants for excavation equipment, offshore oil and gas projects supporting marine and industrial lubricant demand, and extended-drain synthetic formulations enabling reduced maintenance frequency in remote mining sites where logistics costs and equipment downtime significantly impact operational economics. The country's resource-intensive economy and geographic challenges are creating substantial demand for premium lubricants across mining, energy, and agricultural applications. Major international lubricant suppliers and specialized industrial lubricant manufacturers are establishing comprehensive distribution and technical service capabilities to serve Australian industrial markets.
The lubricants industry in India is expanding at a CAGR of 6.7%, supported by the country's fast-growing vehicle population including passenger cars, two-wheelers, and commercial vehicles generating increasing aftermarket lubricant demand, production-linked incentive schemes driving domestic base stock and additive manufacturing capacity development, and logistics fleet expansion supporting commercial vehicle and industrial lubricant consumption across transportation and manufacturing sectors. The country's rapidly expanding automotive market and industrial growth are driving comprehensive lubricant demand. Indian and international lubricant companies are establishing extensive manufacturing, distribution, and retail service capabilities.
The lubricants industry in the United States is expanding at a CAGR of 3.7%, supported by the country's high synthetic lubricant penetration reflecting premium market positioning and consumer willingness to invest in extended-drain products, wind turbine gear oils and data center cooling fluids serving renewable energy infrastructure and digital economy growth, and Industrial IoT maintenance service bundles integrating lubricants with condition monitoring and predictive maintenance platforms. The nation's mature lubricant market and technology adoption are driving demand for specialized high-performance products. Leading lubricant manufacturers and service providers are investing in digital integration and specialty formulations.
The lubricants industry in China is growing at a CAGR of 5.7%, driven by the country's Group III base oil capacity expansions supporting domestic high-quality base stock production, electric vehicle niche applications requiring dielectric fluids for e-axle transmissions and specialized gear oils for electric drivetrains, and industrial automation driving metalworking fluid and precision machining lubricant demand across manufacturing sectors. The country's large automotive market and manufacturing base are supporting comprehensive lubricant consumption. Chinese lubricant manufacturers and international suppliers are establishing extensive capabilities.
Revenue from lubricants in Brazil is expanding at a CAGR of 4.2%, supported by the country's large agribusiness sector requiring agricultural equipment lubricants including tractor oils and hydraulic fluids, offshore floating production storage and offloading vessel operations supporting marine and industrial lubricant demand in energy sector, and ester-based bio-hydraulic fluid adoption supporting environmental protection in agricultural and forestry applications. Brazil's resource-based economy and agricultural strength are driving specialized lubricant demand. International and domestic lubricant suppliers are establishing comprehensive market coverage.
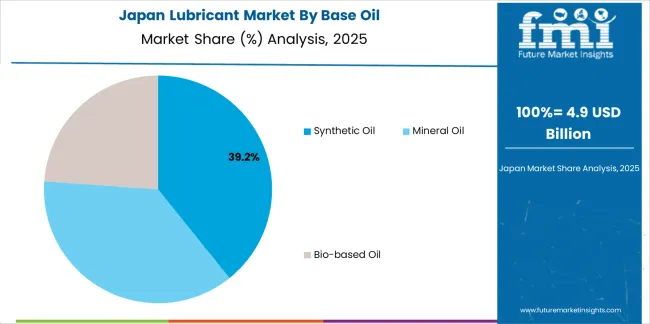
Revenue from lubricants in Japan is expanding at a CAGR of 3.2%, supported by the country's robotics and precision machining applications requiring ultra-clean lubricants with controlled friction characteristics, hybrid and electric vehicle factory-fill specifications supporting automotive manufacturer sustainability initiatives, and quality-focused maintenance practices emphasizing premium lubricants and scheduled service intervals. Japan's advanced manufacturing culture and automotive technology leadership are driving specialized lubricant demand. Japanese lubricant manufacturers and automotive companies are investing in advanced formulation capabilities.
Revenue from lubricants in Germany is growing at a CAGR of 2.8%, driven by the country's EU Green Deal alignment supporting sustainable lubricant adoption and circular economy implementation, offshore wind turbine gear oil applications requiring specialized high-performance lubricants for challenging marine environments, and recyclable packaging programs addressing extended producer responsibility regulations and environmental commitments. Germany's environmental leadership and renewable energy development are supporting sustainable lubricant market evolution. German lubricant manufacturers are investing in sustainability credentials and specialized applications.
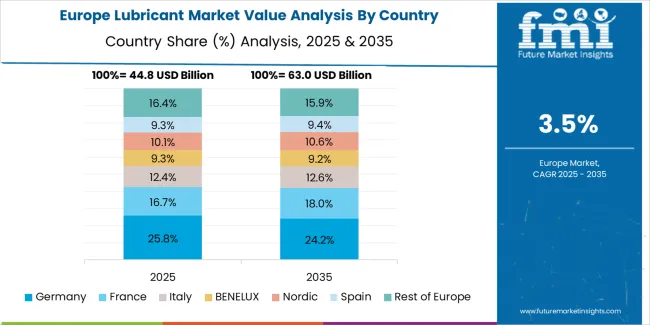
The lubricant market in Europe is projected to grow from USD 42.0 billion in 2025 to USD 58.5 billion by 2035, registering a CAGR of 3.3% over the forecast period. Germany is expected to maintain its leadership position with a 24.0% market share in 2025, moderating slightly to 23.7% by 2035, supported by its original equipment manufacturer factory-fill volumes, high-value synthetic lubricant penetration, and industrial automation clusters serving automotive and manufacturing sectors.
The United Kingdom follows with 14.0% in 2025, projected to reach 14.2% by 2035, driven by aftermarket services infrastructure, e-commerce logistics fleet expansion, and electric vehicle thermal management and e-axle fluid development. France holds 13.0% in 2025, rising to 13.2% by 2035, supported by construction equipment operations, agricultural machinery lubrication, and energy sector maintenance requirements. Italy commands 12.0% in 2025, projected to reach 12.1% by 2035, driven by Tier-1 automotive supplier base and machinery manufacturing exports. Spain accounts for 9.0% in 2025, expected to reach 9.2% by 2035, supported by appliance manufacturing, shipping operations, and tile and flooring industry requirements.
Netherlands maintains 7.0% in 2025, growing to 7.1% by 2035, driven by lubricant blending operations, logistics infrastructure, and label and pressure-sensitive adhesive converting operations. Nordics hold 8.0% in 2025, reaching 8.2% by 2035, supported by offshore wind installations, marine environmentally acceptable lubricants, and robotics applications. Rest of Europe represents 13.0% in 2025, moderating to 12.3% by 2035, attributed to expanding Central and Eastern European contract manufacturing and industrial park development supporting growing lubricant consumption across emerging markets.
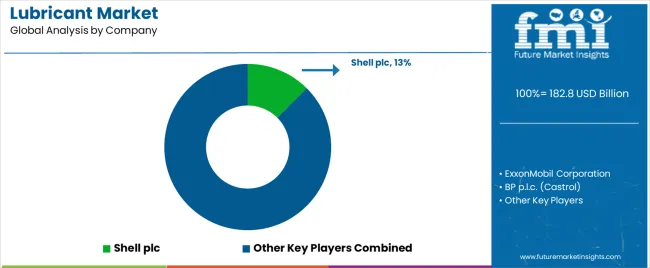
The lubricant market is characterized by competition among established integrated oil companies, specialized lubricant manufacturers, and regional blending operations. Companies are investing in advanced synthetic formulation research, bio-based product development, digital service integration, and comprehensive product portfolios to deliver high-performance, sustainable, and digitally-enabled lubricant solutions. Innovation in electric vehicle fluids, recycled base oils, and predictive maintenance platforms is central to strengthening market position and competitive advantage.
Shell plc leads the market with a commanding 12.5% market share, offering comprehensive lubricant solutions across automotive, industrial, and marine applications with premium synthetic product lines including Helix and Advance ranges. The company upgraded and expanded premium synthetic offerings during 2024-2025, highlighted Indonesia as a core lubricants growth market, and pursued portfolio optimization through retail fuels divestments enabling focus on lubricants and specialty products. ExxonMobil Corporation provides global lubricant manufacturing and distribution with Mobil 1 synthetic motor oil leadership and industrial product ranges.
BP p.l.c. specializes in automotive and industrial lubricants through its Castrol brand with strong aftermarket presence and original equipment manufacturer partnerships. Chevron Corporation delivers Havoline, Delo, and Techron lubricant brands across passenger vehicle and heavy-duty applications. TotalEnergies SE offers comprehensive lubrication solutions, launching Quartz EV3R and Rubia EV3R ranges formulated with regenerated base oils in 2024 extending to heavy-duty original equipment manufacturer approvals.
Valvoline Inc. focuses on automotive aftermarket leadership introducing new full-synthetic gear oil in November 2024 and debuting liquid-cooling solutions for high-performance computing and data centers in November 2024. FUCHS SE specializes in specialty industrial lubricants, acquiring IRMCO in April 2025 and completing LUBCON Group acquisition in July 2024 deepening specialty lubricant capabilities. Sinopec Lubricant Company provides comprehensive lubricant manufacturing serving Chinese domestic market and export customers. Indian Oil Corporation Ltd. delivers lubricant products across Indian automotive and industrial markets. Petronas Lubricants International offers global lubricant solutions with technology partnerships.
Lubricants represent a specialized performance fluids segment within automotive maintenance and industrial operations, projected to grow from USD 182.8 billion in 2025 to USD 283.9 billion by 2035 at a 4.5% CAGR. These formulated products-primarily synthetic and mineral oil-based fluids for friction reduction-are produced through base oil refining and additive blending to serve as essential maintenance fluids reducing friction and wear in engines, transmissions, hydraulic systems, and industrial machinery across automotive transportation, manufacturing, mining, and energy generation applications. Market expansion is driven by increasing global vehicle population, growing industrial automation, expanding synthetic lubricant adoption, and rising demand for specialized fluids including electric vehicle thermal management and data center cooling across transportation, manufacturing, and infrastructure sectors.
How Environmental Regulators Could Strengthen Sustainability Standards?
How Industry Associations Could Advance Technical Standards?
How Lubricant Manufacturers Could Drive Innovation?
How Fleet Operators Could Optimize Maintenance?
How Investors Could Support Market Growth?
| Items | Values |
|---|---|
| Quantitative Units (2025) | USD 182.8 billion |
| Base Oil | Synthetic Oil, Mineral Oil, Bio-based Oil |
| Product Type | Automotive Oil, Hydraulic Oil, Metalworking Fluid, Gear Oil, Compressor Oil, Greases |
| End-User Vertical | Automotive, Industrial, Oil & Gas, Marine, Chemical, Aerospace, Others (Power Generation, Construction Equipment, Agriculture, Food Processing) |
| Regions Covered | Asia Pacific, Europe, North America, Latin America, Middle East & Africa |
| Countries Covered | Australia, India, China, Brazil, United States, Japan, Germany, and 40+ countries |
| Key Companies Profiled | Shell plc, ExxonMobil Corporation, BP p.l.c., Chevron Corporation, TotalEnergies SE, Valvoline Inc. |
| Additional Attributes | Dollar sales by base oil, product type, and end-user vertical categories, regional demand trends, competitive landscape, technological advancements in synthetic formulations, bio-based product development, electric vehicle fluid innovation, and digital service integration |
Base Oil
The global lubricant market is estimated to be valued at USD 182.8 billion in 2025.
The market size for the lubricant market is projected to reach USD 283.9 billion by 2035.
The lubricant market is expected to grow at a 4.5% CAGR between 2025 and 2035.
The key product types in lubricant market are synthetic oil, mineral oil and bio-based oil.
In terms of product type, automotive oil segment to command 36.0% share in the lubricant market in 2025.


Full Research Suite comprises of:
Market outlook & trends analysis
Interviews & case studies
Strategic recommendations
Vendor profiles & capabilities analysis
5-year forecasts
8 regions and 60+ country-level data splits
Market segment data splits
12 months of continuous data updates
DELIVERED AS:
PDF EXCEL ONLINE
Lubricants / Slip Agents Market Size and Share Forecast Outlook 2025 to 2035
Lubricant Packaging Market Analysis - Size, Share, and Forecast Outlook 2025 to 2035
Lubricant Testing Machine Market Size and Share Forecast Outlook 2025 to 2035
Lubricant Additives Market Growth - Trends & Forecast 2025 to 2035
Examining Market Share Trends in the Lubricant Packaging Industry
Lubricants for Cement Industry Market
USA Lubricant Contaminated HDPE Container Waste Market Size and Share Forecast Outlook 2025 to 2035
Mining Lubricant Market Size and Share Forecast Outlook 2025 to 2035
Firearm Lubricants Market Demand & Growth 2025 to 2035
Plastic Lubricants Market
Aircraft Lubricant Market Size and Share Forecast Outlook 2025 to 2035
Market Share Distribution Among Forestry Lubricants Manufacturers
Aviation Lubricants Market
Wire Rope Lubricants Market Size and Share Forecast Outlook 2025 to 2035
Synthetic Lubricants and Functional Fluids Market - Growth & Demand 2025 to 2035
Bio-Based Lubricants Market
Open Gear Lubricants Market
Industrial Lubricant Market Analysis - Size, Share, and Forecast Outlook 2025 to 2035
Industrial Lubricants Industry Analysis in India - Growth Trends, Regional Insights 2025 to 2035
Food Grade Lubricant Market Analysis by Base Oil Type, Product Type and Application Through 2035

Thank you!
You will receive an email from our Business Development Manager. Please be sure to check your SPAM/JUNK folder too.
Chat With
MaRIA