Lubricant Packaging Market Size, Share, and Forecast Outlook 2025 to 2035

In 2025, the global lubricant packaging market is likely to be valued at USD 13.4 billion and is projected to grow steadily to USD 22.7 billion by 2035, expanding at a CAGR of 5.4%. This growth is expected to follow a consistent year-on-year (Y-o-Y) trend, averaging between 5.1% and 5.7% over the forecast period.
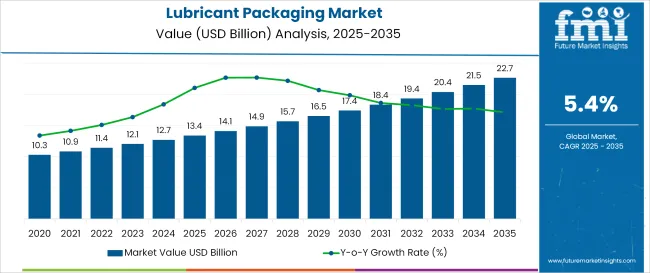
Quick Stats of Lubricant Packaging Market

  • Lubricant Packaging Market Size (2025): USD 13.4 billion
  • Projected Lubricant Packaging Market Size (2035): USD 22.7 billion
  • Forecast CAGR of Lubricant Packaging Market (2025 to 2035): 5.4%
  • Leading Segment of Lubricant Packaging Market (2025): Engine Oil (39%)
  • Key Growth Regions of Lubricant Packaging Market: Asia-Pacific, North America, Europe
  • Top Key Players of Lubricant Packaging Market: Amcor Plc, Berry Global Inc., Greif Inc., Mauser Packaging Solutions, Sonoco Products Company

Lubricant Packaging Market Market Value Analysis

Attributes Description
Estimated Industry Size (2025E) USD 13.4 billion
Projected Industry Value (2035F) USD 22.7 billion
Value-based CAGR (2025 to 2035) 5.4%

By 2026, the industry will likely reach around USD 14.1 billion, driven by increased lubricant consumption across the automotive, industrial, and marine sectors. From 2030 onward, market momentum will likely benefit from stricter environmental regulations and a growing shift toward recyclable and reusable lubricant containers. By 2033, the industry is expected to surpass USD 20.3 billion, ultimately reaching USD 22.7 billion by 2035.

The industry represents a niche but essential segment within broader parent industries. Within the industrial packaging market, it holds an estimated 8-10% share, driven by the constant demand for industrial oils and greases. In the chemical packaging sector, its share is around 6-8%, as lubricants are one of many chemical-based products.

Within the petrochemical & oil packaging market, the share is higher at 12-15%, since lubricants are a core downstream product. In the automotive aftermarket, lubricant packaging commands 10-12%, reflecting its role in vehicle maintenance. within the overall packaging industry, it accounts for a modest 2-3%, as it competes with dominant segments like food and consumer goods packaging. Its value lies in durability, safety, and compliance.

A spokesperson from Berry Global stated that the company’s investment in eco-designed flexible formats aligns with the lubricant industry’s accelerating transition toward packaging that combines low environmental impact with high functional performance. This strategic move supports the growing preference for lightweight, spill-resistant pouches over traditional rigid containers, addressing the dual goals of material reduction and cost-efficient transportation.

Analyzing Lubricant Packaging Market by Top Investment Segments

Lubricant packaging demand is projected to reach USD 13.4 billion in 2025, expanding steadily toward USD 22.7 billion by 2035 at a CAGR of 5.4%. Engine oil and automotive sectors remain key drivers, with plastics dominating material usage due to ease of moldability and cost advantage. Growth is further fueled by packaging shifts toward convenience, anti-leak formats, and evolving lubricant chemistries across industrial applications
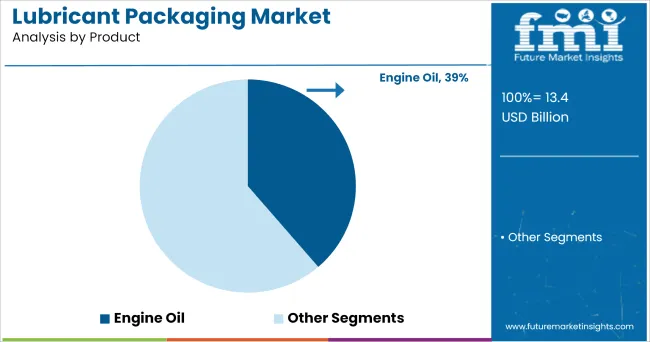
Engine Oil to Dominate with 39% Product Share in 2025

Lubricant Packaging Market Analysis By Product

Engine oil packaging will contribute 39% of global lubricant packaging revenue in 2025, driven by its recurring use across automotive, construction, and agricultural vehicles. The segment demands a high frequency of refill cycles and packaging standardization for viscosity grades.
  • Over 6.8 billion liters of engine oil will be packaged globally in 2025, with 61% of this used in light and heavy-duty vehicles
  • ExxonMobil, Shell, and IndianOil account for more than 27% of engine oil packaging units in emerging markets
  • By 2025, 1L and 5L plastic jugs will dominate, while 20L packs are expected to rise in commercial fleet and workshop formats

Plastic Packaging to Hold 65% Share by Material Type

Lubricant Packaging Market Analysis By Material

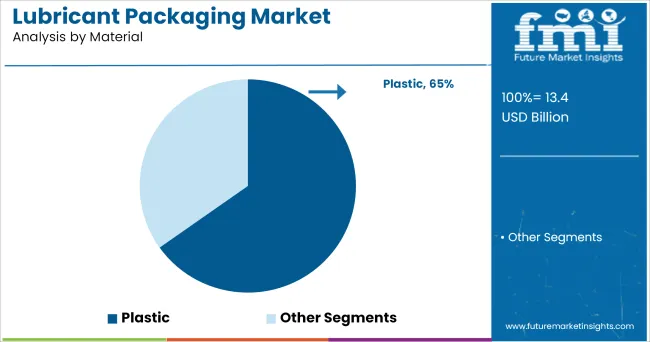
Plastic packaging will account for 65% of lubricant container usage in 2025, Because of its moldability, cost effectiveness, and growing recyclability. HDPE and PP remain top material choices, covering most light and industrial-grade lubricant containers.
  • About 14 billion lubricant packs will be manufactured in plastic annually by 2025, with HDPE forming over 43% of this volume
  • Greif, Time Technoplast, Mold-Tek, and Mauser Packaging dominate the market for injection-molded lubricant containers
  • PET packaging is gaining share in Southeast Asia and Latin America for 1L and below formats due to better clarity and aesthetics

Automotive to Consume Over 54% of Lubricant Packs in 2025

Lubricant Packaging Market Analysis By End Use Industry

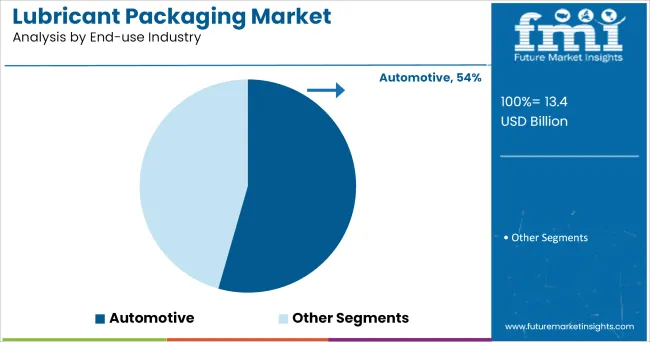
The automotive sector will be the leading end-use industry, consuming over 54% of all lubricant packaging in 2025. This includes private vehicles, commercial fleets, 2-wheelers, and electric vehicle-compatible transmission and greasing products.

  • In 2025, passenger and commercial vehicles globally will demand 11.6 billion liters of lubricant, 87% of which is packaged for retail
  • Companies like TotalEnergies and Valvoline rely on custom-molded 1L to 5L packs for aftermarket engine and transmission oils
  • Electric vehicles are contributing new demand for specialized coolant and grease packs, with over 1.3 million EV units targeted

Top Lubricant Packaging Market Dynamics

Lubricant packaging shipments reached 4.3 billion units globally in H1 2025, marking a 5.1% increase from the previous year. Material selection, pack size distribution, and refill integration were shaped by automotive service cycles, resin availability, and regulatory pressures related to disposal standards and recovery logistics in high-volume consumption regions.

Automotive and Equipment Service Demand Influencing Format Mix

Passenger vehicle motor oils accounted for 47.6% of filled packaging in Q2 2025. Industrial machinery lubricants contributed 34.2%, with off-highway segments such as agriculture and construction generating 11.5%. One-litre bottles held 51.8% of global filled units.

Flexible pouch formats recorded 14.9% growth in Southeast Asia, especially where smaller service operators sought to lower handling and storage costs. Pail containers in the 10 to 20 litre range expanded by 6.3% across Middle East distribution hubs due to bulk purchasing shifts in equipment maintenance networks.

Resin Economics and Labeling Tech Reshaping Converter Strategy

HDPE remained the dominant substrate, used in 69.4% of lubricant packaging globally in H1 2025. Blow-mold grade HDPE averaged GBP 1,428 per metric ton in June, reflecting a 7.2% increase from Q1 pricing. Polypropylene gained traction in Brazil and Argentina due to improved local availability and compatibility with hot-fill lines.

QR-cap authentication reached 18.6% of retail-facing SKUs in Europe, compared to 5.2% a year earlier. UV-cured labels saw a 9.3% rise in North American demand, mainly among premium-grade lubricant marketers targeting higher-viscosity synthetic blends.

Regulatory Shifts Trigger Refill Design and End-of-Use Changes

Packaging mandates introduced in Q2 across Germany, South Korea, and Japan prompted adjustments in closure systems and layer separation for recycling ease. Dual-material recovery coding is now found on 22.1% of lubricant containers in the EU.

Auto service centers across France and Italy increased procurement of semi-rigid refill containers, replacing single-use drums in 1 out of every 3 new fleet contracts. Used-oil collection programs spurred a 17.4% rise in demand for return-ready pouches and nested bag-in-box kits, particularly in regions with mandatory lubricant waste reporting thresholds.
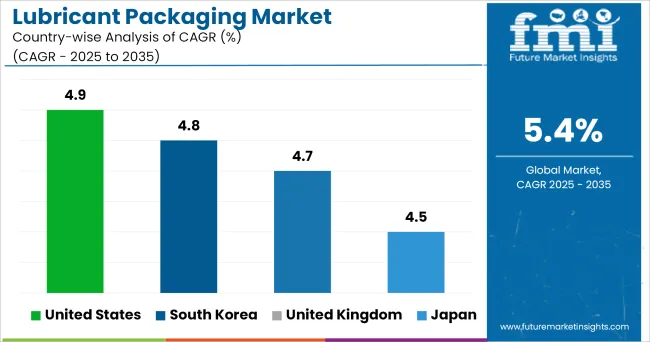
Top Countries Advancing and Adjusting Lubricant Packaging Strategies

Lubricant Packaging Market Cagr Analysis By Country

Country CAGR (2025 to 2035)
India 5.1%
United States 4.9%
South Korea 4.8%
United Kingdom 4.7%
Japan 4.5%

The lubricant packaging industry is projected to grow at a global CAGR of 5.4% between 2025 and 2035. Among key players, India (BRICS) is closest to this average with a growth rate of 5.1%, reflecting expanding automotive and industrial applications. The United States, South Korea, the United Kingdom, and Japan-all OECD economies-register comparatively moderate figures, ranging from 4.5% to 4.9%.

These differences point to divergent market priorities. India continues to scale production and expand distribution networks, while packaging development in OECD countries focuses more on efficiency, recycling compatibility, and compliance-driven innovation. Industry expansion is shaped by domestic manufacturing capacities, sectoral lubricant demand, and evolving material preferences.

The report covers detailed analysis of 40+ countries, with the top five countries shared as a reference.

Lubricant Packaging Market Trends in India

The lubricant packaging industry in India is projected to expand at a CAGR of 5.1% through 2035, supported by high consumption in automotive, railways, and industrial sectors. From 2020 to 2024, the industr grew at 4.2%, aided by rapid motorization and fleet expansion.

Mid-size and heavy vehicles accounted for increasing bulk lube purchases, prompting demand for HDPE drums and multilayer pouches. Digital retailing of lubricants also fueled the shift toward tamper-evident, single-use packs, for aftermarket use. Flexible pouches are gaining traction for synthetic lubricants in Tier 2 cities.

  • Over 62% of packaging demand in 2024 came from automotive applications
  • Use of 1L and 500ml SKUs rose 28% in e-commerce lubricant sales
  • Industrial lubricant packaging demand grew at 5.6% CAGR between 2020 and 2024

Lubricant Packaging Market Overview in the United States

The United States is forecast to grow at 4.9% CAGR through 2035, up from 3.6% between 2020 and 2024. The resurgence of manufacturing and rising vehicle miles traveled have revived bulk lubricant consumption. High-viscosity oils for trucks and equipment fleets are driving demand for durable drum and IBC (intermediate bulk container) formats.

Green packaging formats like re-refillable bottles and PCR-based jugs are seeing gradual uptake. Automation in filling lines and investments in clean dispensing closures are becoming procurement priorities for top-tier brands.

  • Over 34% of lubricant packaging volume in 2024 was in 20L+ formats
  • PCR content in HDPE lubricant bottles averaged 18% across top 10 producers
  • Vehicle maintenance chains increased branded pouch-pack lubricant adoption by 19%

Lubricant Packaging Market Performance in South Korea

South Korea is expected to grow at 4.8% CAGR between 2025 and 2035, up from 3.9% over the previous five years. Domestic OEM lubricant production for automotive assembly has supported demand for high-barrier, thermoformed plastic packs.

Brands are focusing on digitally coded anti-counterfeit closures to support warranty-linked servicing. Space-efficient packs for electric vehicles and hybrid drivetrains are seeing early adoption. Pack formats in industrial segments are evolving, with more collapsible containers being adopted for metalworking fluids and hydraulic oils.

  • 2024 saw a 22% YoY increase in smart-lid lubricant packs
  • Over 51% of EV-compatible lubricants now use under-1L plastic packs
  • 3L and 4L pails accounted for 54% of automotive service lubricant packaging

Lubricant Packaging Market Evolution in the United Kingdom

The UK lubricant packaging industry is projected to grow at 4.7% CAGR from 2025 to 2035, accelerating from 3.4% in the 2020 to 2024 period. Aftermarket synthetic oils and specialty industrial fluids have shaped demand for resealable and recyclable rigid packs. The transition to electric mobility and fleet digitization is reducing average lube consumption per vehicle, pushing brands to re-engineer packaging sizes and dosing control.

  • Nearly 44% of industrial lubricant packs used metal canisters in 2024
  • 500ml and 1L bottle demand rose 14.8% between 2021 and 2024
  • 6.1 million lubricant packs in 2024 were made with over 25% recycled content

Lubricant Packaging Market Structure in Japan

The lubricant packaging industry in Japan is forecast to grow at 4.5% CAGR over 2025 to 2035, compared to 3.3% in the prior five-year window. The country's high share of hybrid and compact vehicles has steady demand for smaller pack sizes, particularly 0.5L to 2L bottles.

Smart dispensing systems with tamper verification are being deployed in industrial lubricant settings. Material innovations are focused on anti-leak, low-permeability containers for high-temperature synthetic oils used in aerospace and electronics machinery.
  • Compact cars drove 57% of 2024 lubricant bottle volume under 2L
  • QR-coded lubricant bottles saw a 31% increase from 2020 to 2024
  • Polycarbonate-lined metal drums grew in usage for thermal management fluids

Leading Lubricant Packaging Manufacturers, Suppliers, Distributors

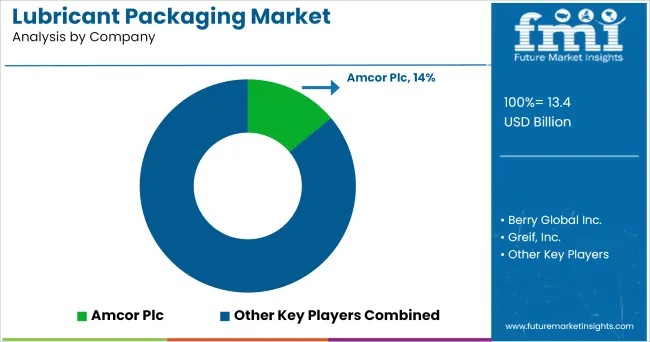
Lubricant Packaging Market Analysis By Company

The industry is led by global players like Amcor Plc and Berry Global Inc., who dominate through strategic acquisitions and diversified product lines. Amcor expanded its flexible pouch offerings for automotive lubricants, while Berry Global developed spill-proof containers for industrial use. Greif, Inc. and Mauser Packaging Solutions specialize in steel and plastic drums, catering to bulk lubricant distributors.

Emerging competitors such as Uflex Ltd. focus on cost-efficient flexible films, gaining traction in price-sensitive markets. Entry barriers include significant capital requirements for blow-molding and injection molding equipment, along with strict regulatory standards for hazardous material containment.

Established brands like Sonoco Products Company benefit from long-term contracts with oil majors, while new entrants compete through regional specialization and customized solutions for smaller lubricant blenders.

Leading player- Amcor Plc holding 14% industry share

Recent Industry News

  • In 2024, Amcor Plc introduced a new line of ultra-durable, lightweight HDPE bottles with integrated measuring caps, specifically designed for high-end synthetic lubricants, enhancing convenience and reducing spillage risks.
  • In 2024, Berry Global Inc. expanded its North American production facilities to meet surging demand for flexible lubricant pouches, particularly for the automotive aftermarket, leveraging faster filling and lower shipping costs versus rigid containers.

Leading Players

  • Amcor Plc
  • Berry Global Inc.
  • Greif, Inc.
  • Scholle IPN
  • Mauser Packaging Solutions
  • Sonoco Products Company
  • Mondi Group
  • CCL Industries
  • Glenroy, Inc.
  • Uflex Ltd.

Report Scope

Report Attributes Details
Market Size (2025) USD 13.4 billion
Projected Market Size (2035) USD 22.7 billion
CAGR (2025 to 2035) 5.4%
Forecast Period 2025 to 2035
Quantitative Units USD billion (revenue)
Product Segmentation Engine Oil, Transmission & Hydraulic Fluid, Process Oil, Metal Working Fluid, General Industrial Fluid, Gear Oil, Greases
Material Segmentation Metal (Tin, Steel), Plastic (Polyethylene, HDPE, LDPE, PVC, PET, PS, PP, PA), Others
End-use Industry Segmentation Automotive, Metal Working, Oil & Gas, Power Generation, Machine Industry, Chemicals, Other Manufacturing
Regional Coverage North America, Latin America, Middle East and Africa (MEA), Europe, Asia Pacific
Country Covered United States, Canada, Germany, United Kingdom, France, Italy, Japan, China, India, Brazil, ASEAN, GCC countries
Leading Companies Profiled Amcor Plc, Berry Global Inc., Greif, Inc., Scholle IPN, Mauser Packaging Solutions, Sonoco Products Company, Mondi Group, CCL Industries, Glenroy, Inc., Uflex Ltd.
Additional Insights Dollar sales, share by lubricant type and container format, rising demand for HDPE and PET containers in automotive and industrial applications, shift toward sustainable plastic and metal hybrid packaging, growth in refillable and recyclable lubricant pouches, influence of high-speed filling lines and digital labeling innovations

Key Segments

By Product:

  • Engine Oil
  • Transmission & Hydraulic Fluid
  • Process Oil
  • Metal Working Fluid
  • General Industrial Fluid
  • Gear Oil
  • Greases

By Material:

  • Metal
    • Tin
    • Steel
  • Plastic
    • Polyethylene
    • HDPE
    • LDPE
    • Polyvinyl Chloride (PVC)
    • Polyethylene Terephthalate (PET)
    • Polystyrene (PS)
    • Polypropylene (PP)
    • Polyamide (PA)
  • Others

By End-use Industry:

  • Automotive
  • Metal working
  • Oil & Gas
  • Power Generation
  • Machine Industry
  • Chemicals
  • Other Manufacturing

By Region:

  • North America
  • Latin America
  • The Middle East and Africa (MEA)
  • Europe
  • Asia Pacific

Table of Content

  1. Executive Summary
    • Global Market Outlook
    • Demand-side Trends
    • Supply-side Trends
    • Technology Roadmap Analysis
    • Analysis and Recommendations
  2. Market Overview
    • Market Coverage / Taxonomy
    • Market Definition / Scope / Limitations
  3. Market Background
    • Market Dynamics
      • Drivers
      • Restraints
      • Opportunity
      • Trends
    • Scenario Forecast
      • Demand in Optimistic Scenario
      • Demand in Likely Scenario
      • Demand in Conservative Scenario
    • Opportunity Map Analysis
    • Product Life Cycle Analysis
    • Supply Chain Analysis
      • Supply Side Participants and their Roles
        • Producers
        • Mid-Level Participants (Traders/ Agents/ Brokers)
        • Wholesalers and Distributors
      • Value Added and Value Created at Node in the Supply Chain
      • List of Raw Material Suppliers
      • List of Existing and Potential Buyer’s
    • Investment Feasibility Matrix
    • Value Chain Analysis
      • Profit Margin Analysis
      • Wholesalers and Distributors
      • Retailers
    • PESTLE and Porter’s Analysis
    • Regulatory Landscape
      • By Key Regions
      • By Key Countries
    • Regional Parent Market Outlook
    • Production and Consumption Statistics
    • Import and Export Statistics
  4. Global Market Analysis 2020 to 2024 and Forecast, 2025 to 2035
    • Historical Market Size Value (MT) & Volume (MilLion Units) Analysis, 2020 to 2024
    • Current and Future Market Size Value (MT) & Volume (MilLion Units) Projections, 2025 to 2035
      • Y-o-Y Growth Trend Analysis
      • Absolute $ Opportunity Analysis
  5. Global Market Pricing Analysis 2020 to 2024 and Forecast 2025 to 2035
  6. Global Market Analysis 2020 to 2024 and Forecast 2025 to 2035, By Product
    • Introduction / Key Findings
    • Historical Market Size Value (MT) & Volume (MilLion Units) Analysis By Product, 2020 to 2024
    • Current and Future Market Size Value (MT) & Volume (MilLion Units) Analysis and Forecast By Product, 2025 to 2035
      • Engine Oil
      • Transmission & Hydraulic Fluid
      • Process Oil
      • Metal Working Fluid
      • General Industrial Fluid
      • Gear Oil
      • Greases
    • Y-o-Y Growth Trend Analysis By Product, 2020 to 2024
    • Absolute $ Opportunity Analysis By Product, 2025 to 2035
  7. Global Market Analysis 2020 to 2024 and Forecast 2025 to 2035, By Material
    • Introduction / Key Findings
    • Historical Market Size Value (MT) & Volume (MilLion Units) Analysis By Material, 2020 to 2024
    • Current and Future Market Size Value (MT) & Volume (MilLion Units) Analysis and Forecast By Material, 2025 to 2035
      • Metal
        • Tin
        • Steel
      • Plastic
        • Polyethylene
        • HDPE
      • LDPE
        • Polyvinyl Chloride (PVC)
        • Polyethylene Terephthalate (PET)
        • Polystyrene (PS)
        • Polypropylene (PP)
        • Polyamide (PA)
      • Others
    • Y-o-Y Growth Trend Analysis By Material, 2020 to 2024
    • Absolute $ Opportunity Analysis By Material, 2025 to 2035
  8. Global Market Analysis 2020 to 2024 and Forecast 2025 to 2035, By End-use Industry
    • Introduction / Key Findings
    • Historical Market Size Value (MT) & Volume (MilLion Units) Analysis By End-use Industry, 2020 to 2024
    • Current and Future Market Size Value (MT) & Volume (MilLion Units) Analysis and Forecast By End-use Industry, 2025 to 2035
      • Automotive
      • Metal working
      • Oil & Gas
      • Power Generation
      • Machine Industry
      • Chemicals
      • Other Manufacturing
    • Y-o-Y Growth Trend Analysis By End-use Industry, 2020 to 2024
    • Absolute $ Opportunity Analysis By End-use Industry, 2025 to 2035
  9. Global Market Analysis 2020 to 2024 and Forecast 2025 to 2035, By Region
    • Introduction
    • Historical Market Size Value (MT) & Volume (MilLion Units) Analysis By Region, 2020 to 2024
    • Current Market Size Value (MT) & Volume (MilLion Units) Analysis and Forecast By Region, 2025 to 2035
      • North America
      • Latin America
      • Western Europe
      • Eastern Europe
      • East Asia
      • South Asia & Pacific
      • Middle East and Africa
    • Market Attractiveness Analysis By Region
  10. North America Market Analysis 2020 to 2024 and Forecast 2025 to 2035, By Country
    • Historical Market Size Value (MT) & Volume (MilLion Units) Trend Analysis By Market Taxonomy, 2020 to 2024
    • Market Size Value (MT) & Volume (MilLion Units) Forecast By Market Taxonomy, 2025 to 2035
      • By Country
        • USA
        • Canada
        • Mexico
      • By Product
      • By Material
      • By End-use Industry
    • Market Attractiveness Analysis
      • By Country
      • By Product
      • By Material
      • By End-use Industry
    • Key Takeaways
  11. Latin America Market Analysis 2020 to 2024 and Forecast 2025 to 2035, By Country
    • Historical Market Size Value (MT) & Volume (MilLion Units) Trend Analysis By Market Taxonomy, 2020 to 2024
    • Market Size Value (MT) & Volume (MilLion Units) Forecast By Market Taxonomy, 2025 to 2035
      • By Country
        • Brazil
        • Argentina
        • Rest of LATAM
      • By Product
      • By Material
      • By End-use Industry
    • Market Attractiveness Analysis
      • By Country
      • By Product
      • By Material
      • By End-use Industry
    • Key Takeaways
  12. Western Europe Market Analysis 2020 to 2024 and Forecast 2025 to 2035, By Country
    • Historical Market Size Value (MT) & Volume (MilLion Units) Trend Analysis By Market Taxonomy, 2020 to 2024
    • Market Size Value (MT) & Volume (MilLion Units) Forecast By Market Taxonomy, 2025 to 2035
      • By Country
        • Germany
        • Italy
        • France
        • UK
        • Spain
        • BENELUX
        • Nordic
        • Rest of W.Europe
      • By Product
      • By Material
      • By End-use Industry
    • Market Attractiveness Analysis
      • By Country
      • By Product
      • By Material
      • By End-use Industry
    • Key Takeaways
  13. Eastern Europe Market Analysis 2020 to 2024 and Forecast 2025 to 2035, By Country
    • Historical Market Size Value (MT) & Volume (MilLion Units) Trend Analysis By Market Taxonomy, 2020 to 2024
    • Market Size Value (MT) & Volume (MilLion Units) Forecast By Market Taxonomy, 2025 to 2035
      • By Country
        • Russia
        • Hungary
        • Poland
        • Balkan & Baltics
        • Rest of E. Europe
      • By Product
      • By Material
      • By End-use Industry
    • Market Attractiveness Analysis
      • By Country
      • By Product
      • By Material
      • By End-use Industry
    • Key Takeaways
  14. East Asia Market Analysis 2020 to 2024 and Forecast 2025 to 2035, By Country
    • Historical Market Size Value (MT) & Volume (MilLion Units) Trend Analysis By Market Taxonomy, 2020 to 2024
    • Market Size Value (MT) & Volume (MilLion Units) Forecast By Market Taxonomy, 2025 to 2035
      • By Country
        • China
        • Japan
        • South Korea
      • By Product
      • By Material
      • By End-use Industry
    • Market Attractiveness Analysis
      • By Country
      • By Product
      • By Material
      • By End-use Industry
    • Key Takeaways
  15. South Asia & Pacific Market Analysis 2020 to 2024 and Forecast 2025 to 2035, By Country
    • Historical Market Size Value (MT) & Volume (MilLion Units) Trend Analysis By Market Taxonomy, 2020 to 2024
    • Market Size Value (MT) & Volume (MilLion Units) Forecast By Market Taxonomy, 2025 to 2035
      • By Country
        • India
        • Australia & New Zealand
        • ASEAN
        • Rest of SAP
      • By Product
      • By Material
      • By End-use Industry
    • Market Attractiveness Analysis
      • By Country
      • By Product
      • By Material
      • By End-use Industry
    • Key Takeaways
  16. Middle East and Africa Market Analysis 2020 to 2024 and Forecast 2025 to 2035, By Country
    • Historical Market Size Value (MT) & Volume (MilLion Units) Trend Analysis By Market Taxonomy, 2020 to 2024
    • Market Size Value (MT) & Volume (MilLion Units) Forecast By Market Taxonomy, 2025 to 2035
      • By Country
        • GCC Countries
        • Northern Africa
        • South Africa
        • Turkiye
        • Rest of MEA
      • By Product
      • By Material
      • By End-use Industry
    • Market Attractiveness Analysis
      • By Country
      • By Product
      • By Material
      • By End-use Industry
    • Key Takeaways
  17. Key Countries Market Analysis
    • USA
      • Pricing Analysis
      • Market Share Analysis, 2024
        • By Product
        • By Material
        • By End-use Industry
    • Canada
      • Pricing Analysis
      • Market Share Analysis, 2024
        • By Product
        • By Material
        • By End-use Industry
    • Brazil
      • Pricing Analysis
      • Market Share Analysis, 2024
        • By Product
        • By Material
        • By End-use Industry
    • Mexico
      • Pricing Analysis
      • Market Share Analysis, 2024
        • By Product
        • By Material
        • By End-use Industry
    • Argentina
      • Pricing Analysis
      • Market Share Analysis, 2024
        • By Product
        • By Material
        • By End-use Industry
  18. Market Structure Analysis
    • Competition Dashboard
    • Competition Benchmarking
    • Market Share Analysis of Top Players
      • By Regional
      • By Product
      • By Material
      • By End-use Industry
  19. Competition Analysis
    • Competition Deep Dive
      • Amcor Plc
        • Overview
        • Product Portfolio
        • Profitability by Market Segments (Product/Age /Sales Channel/Region)
        • Sales Footprint
        • Strategy Overview
          • Marketing Strategy
          • Product Strategy
          • Channel Strategy
      • Berry Global Inc.
        • Overview
        • Product Portfolio
        • Profitability by Market Segments (Product/Age /Sales Channel/Region)
        • Sales Footprint
        • Strategy Overview
          • Marketing Strategy
          • Product Strategy
          • Channel Strategy
      • Greif, Inc.
        • Overview
        • Product Portfolio
        • Profitability by Market Segments (Product/Age /Sales Channel/Region)
        • Sales Footprint
        • Strategy Overview
          • Marketing Strategy
          • Product Strategy
          • Channel Strategy
      • Scholle IPN
        • Overview
        • Product Portfolio
        • Profitability by Market Segments (Product/Age /Sales Channel/Region)
        • Sales Footprint
        • Strategy Overview
          • Marketing Strategy
          • Product Strategy
          • Channel Strategy
      • Mauser Packaging Solutions
        • Overview
        • Product Portfolio
        • Profitability by Market Segments (Product/Age /Sales Channel/Region)
        • Sales Footprint
        • Strategy Overview
          • Marketing Strategy
          • Product Strategy
          • Channel Strategy
      • Sonoco Products Company
        • Overview
        • Product Portfolio
        • Profitability by Market Segments (Product/Age /Sales Channel/Region)
        • Sales Footprint
        • Strategy Overview
          • Marketing Strategy
          • Product Strategy
          • Channel Strategy
      • Mondi Group
        • Overview
        • Product Portfolio
        • Profitability by Market Segments (Product/Age /Sales Channel/Region)
        • Sales Footprint
        • Strategy Overview
          • Marketing Strategy
          • Product Strategy
          • Channel Strategy
      • CCL Industries
        • Overview
        • Product Portfolio
        • Profitability by Market Segments (Product/Age /Sales Channel/Region)
        • Sales Footprint
        • Strategy Overview
          • Marketing Strategy
          • Product Strategy
          • Channel Strategy
      • Glenroy, Inc.
        • Overview
        • Product Portfolio
        • Profitability by Market Segments (Product/Age /Sales Channel/Region)
        • Sales Footprint
        • Strategy Overview
          • Marketing Strategy
          • Product Strategy
          • Channel Strategy
      • Uflex Ltd.
        • Overview
        • Product Portfolio
        • Profitability by Market Segments (Product/Age /Sales Channel/Region)
        • Sales Footprint
        • Strategy Overview
          • Marketing Strategy
          • Product Strategy
          • Channel Strategy
  20. Assumptions & Acronyms Used
  21. Research Methodology

List of Tables

  • Table 1: Global Market Value (MT) Forecast by Region, 2020-2035
  • Table 2: Global Market Volume (MilLion Units) Forecast by Region, 2020-2035
  • Table 3: Global Market Value (MT) Forecast by Product, 2020-2035
  • Table 4: Global Market Volume (MilLion Units) Forecast by Product, 2020-2035
  • Table 5: Global Market Value (MT) Forecast by Material, 2020-2035
  • Table 6: Global Market Volume (MilLion Units) Forecast by Material, 2020-2035
  • Table 7: Global Market Value (MT) Forecast by End-use Industry, 2020-2035
  • Table 8: Global Market Volume (MilLion Units) Forecast by End-use Industry, 2020-2035
  • Table 9: North America Market Value (MT) Forecast by Country, 2020-2035
  • Table 10: North America Market Volume (MilLion Units) Forecast by Country, 2020-2035
  • Table 11: North America Market Value (MT) Forecast by Product, 2020-2035
  • Table 12: North America Market Volume (MilLion Units) Forecast by Product, 2020-2035
  • Table 13: North America Market Value (MT) Forecast by Material, 2020-2035
  • Table 14: North America Market Volume (MilLion Units) Forecast by Material, 2020-2035
  • Table 15: North America Market Value (MT) Forecast by End-use Industry, 2020-2035
  • Table 16: North America Market Volume (MilLion Units) Forecast by End-use Industry, 2020-2035
  • Table 17: Latin America Market Value (MT) Forecast by Country, 2020-2035
  • Table 18: Latin America Market Volume (MilLion Units) Forecast by Country, 2020-2035
  • Table 19: Latin America Market Value (MT) Forecast by Product, 2020-2035
  • Table 20: Latin America Market Volume (MilLion Units) Forecast by Product, 2020-2035
  • Table 21: Latin America Market Value (MT) Forecast by Material, 2020-2035
  • Table 22: Latin America Market Volume (MilLion Units) Forecast by Material, 2020-2035
  • Table 23: Latin America Market Value (MT) Forecast by End-use Industry, 2020-2035
  • Table 24: Latin America Market Volume (MilLion Units) Forecast by End-use Industry, 2020-2035
  • Table 25: Western Europe Market Value (MT) Forecast by Country, 2020-2035
  • Table 26: Western Europe Market Volume (MilLion Units) Forecast by Country, 2020-2035
  • Table 27: Western Europe Market Value (MT) Forecast by Product, 2020-2035
  • Table 28: Western Europe Market Volume (MilLion Units) Forecast by Product, 2020-2035
  • Table 29: Western Europe Market Value (MT) Forecast by Material, 2020-2035
  • Table 30: Western Europe Market Volume (MilLion Units) Forecast by Material, 2020-2035
  • Table 31: Western Europe Market Value (MT) Forecast by End-use Industry, 2020-2035
  • Table 32: Western Europe Market Volume (MilLion Units) Forecast by End-use Industry, 2020-2035
  • Table 33: Eastern Europe Market Value (MT) Forecast by Country, 2020-2035
  • Table 34: Eastern Europe Market Volume (MilLion Units) Forecast by Country, 2020-2035
  • Table 35: Eastern Europe Market Value (MT) Forecast by Product, 2020-2035
  • Table 36: Eastern Europe Market Volume (MilLion Units) Forecast by Product, 2020-2035
  • Table 37: Eastern Europe Market Value (MT) Forecast by Material, 2020-2035
  • Table 38: Eastern Europe Market Volume (MilLion Units) Forecast by Material, 2020-2035
  • Table 39: Eastern Europe Market Value (MT) Forecast by End-use Industry, 2020-2035
  • Table 40: Eastern Europe Market Volume (MilLion Units) Forecast by End-use Industry, 2020-2035
  • Table 41: East Asia Market Value (MT) Forecast by Country, 2020-2035
  • Table 42: East Asia Market Volume (MilLion Units) Forecast by Country, 2020-2035
  • Table 43: East Asia Market Value (MT) Forecast by Product, 2020-2035
  • Table 44: East Asia Market Volume (MilLion Units) Forecast by Product, 2020-2035
  • Table 45: East Asia Market Value (MT) Forecast by Material, 2020-2035
  • Table 46: East Asia Market Volume (MilLion Units) Forecast by Material, 2020-2035
  • Table 47: East Asia Market Value (MT) Forecast by End-use Industry, 2020-2035
  • Table 48: East Asia Market Volume (MilLion Units) Forecast by End-use Industry, 2020-2035
  • Table 49: South Asia & Pacific Market Value (MT) Forecast by Country, 2020-2035
  • Table 50: South Asia & Pacific Market Volume (MilLion Units) Forecast by Country, 2020-2035
  • Table 51: South Asia & Pacific Market Value (MT) Forecast by Product, 2020-2035
  • Table 52: South Asia & Pacific Market Volume (MilLion Units) Forecast by Product, 2020-2035
  • Table 53: South Asia & Pacific Market Value (MT) Forecast by Material, 2020-2035
  • Table 54: South Asia & Pacific Market Volume (MilLion Units) Forecast by Material, 2020-2035
  • Table 55: South Asia & Pacific Market Value (MT) Forecast by End-use Industry, 2020-2035
  • Table 56: South Asia & Pacific Market Volume (MilLion Units) Forecast by End-use Industry, 2020-2035
  • Table 57: Middle East and Africa Market Value (MT) Forecast by Country, 2020-2035
  • Table 58: Middle East and Africa Market Volume (MilLion Units) Forecast by Country, 2020-2035
  • Table 59: Middle East and Africa Market Value (MT) Forecast by Product, 2020-2035
  • Table 60: Middle East and Africa Market Volume (MilLion Units) Forecast by Product, 2020-2035
  • Table 61: Middle East and Africa Market Value (MT) Forecast by Material, 2020-2035
  • Table 62: Middle East and Africa Market Volume (MilLion Units) Forecast by Material, 2020-2035
  • Table 63: Middle East and Africa Market Value (MT) Forecast by End-use Industry, 2020-2035
  • Table 64: Middle East and Africa Market Volume (MilLion Units) Forecast by End-use Industry, 2020-2035

List of Figures

  • Figure 1: Global Market Volume (MilLion Units) Forecast 2020-2035
  • Figure 2: Global Market Pricing Analysis
  • Figure 3: Global Market Value (MT) Forecast 2020-2035
  • Figure 4: Global Market Value Share and BPS Analysis by Product, 2025 and 2035
  • Figure 5: Global Market Y-o-Y Growth Comparison by Product, 2025-2035
  • Figure 6: Global Market Attractiveness Analysis by Product
  • Figure 7: Global Market Value Share and BPS Analysis by Material, 2025 and 2035
  • Figure 8: Global Market Y-o-Y Growth Comparison by Material, 2025-2035
  • Figure 9: Global Market Attractiveness Analysis by Material
  • Figure 10: Global Market Value Share and BPS Analysis by End-use Industry, 2025 and 2035
  • Figure 11: Global Market Y-o-Y Growth Comparison by End-use Industry, 2025-2035
  • Figure 12: Global Market Attractiveness Analysis by End-use Industry
  • Figure 13: Global Market Value (MT) Share and BPS Analysis by Region, 2025 and 2035
  • Figure 14: Global Market Y-o-Y Growth Comparison by Region, 2025-2035
  • Figure 15: Global Market Attractiveness Analysis by Region
  • Figure 16: North America Market Incremental $ Opportunity, 2025-2035
  • Figure 17: Latin America Market Incremental $ Opportunity, 2025-2035
  • Figure 18: Western Europe Market Incremental $ Opportunity, 2025-2035
  • Figure 19: Eastern Europe Market Incremental $ Opportunity, 2025-2035
  • Figure 20: East Asia Market Incremental $ Opportunity, 2025-2035
  • Figure 21: South Asia & Pacific Market Incremental $ Opportunity, 2025-2035
  • Figure 22: Middle East and Africa Market Incremental $ Opportunity, 2025-2035
  • Figure 23: North America Market Value Share and BPS Analysis by Country, 2025 and 2035
  • Figure 24: North America Market Value Share and BPS Analysis by Product, 2025 and 2035
  • Figure 25: North America Market Y-o-Y Growth Comparison by Product, 2025-2035
  • Figure 26: North America Market Attractiveness Analysis by Product
  • Figure 27: North America Market Value Share and BPS Analysis by Material, 2025 and 2035
  • Figure 28: North America Market Y-o-Y Growth Comparison by Material, 2025-2035
  • Figure 29: North America Market Attractiveness Analysis by Material
  • Figure 30: North America Market Value Share and BPS Analysis by End-use Industry, 2025 and 2035
  • Figure 31: North America Market Y-o-Y Growth Comparison by End-use Industry, 2025-2035
  • Figure 32: North America Market Attractiveness Analysis by End-use Industry
  • Figure 33: Latin America Market Value Share and BPS Analysis by Country, 2025 and 2035
  • Figure 34: Latin America Market Value Share and BPS Analysis by Product, 2025 and 2035
  • Figure 35: Latin America Market Y-o-Y Growth Comparison by Product, 2025-2035
  • Figure 36: Latin America Market Attractiveness Analysis by Product
  • Figure 37: Latin America Market Value Share and BPS Analysis by Material, 2025 and 2035
  • Figure 38: Latin America Market Y-o-Y Growth Comparison by Material, 2025-2035
  • Figure 39: Latin America Market Attractiveness Analysis by Material
  • Figure 40: Latin America Market Value Share and BPS Analysis by End-use Industry, 2025 and 2035
  • Figure 41: Latin America Market Y-o-Y Growth Comparison by End-use Industry, 2025-2035
  • Figure 42: Latin America Market Attractiveness Analysis by End-use Industry
  • Figure 43: Western Europe Market Value Share and BPS Analysis by Country, 2025 and 2035
  • Figure 44: Western Europe Market Value Share and BPS Analysis by Product, 2025 and 2035
  • Figure 45: Western Europe Market Y-o-Y Growth Comparison by Product, 2025-2035
  • Figure 46: Western Europe Market Attractiveness Analysis by Product
  • Figure 47: Western Europe Market Value Share and BPS Analysis by Material, 2025 and 2035
  • Figure 48: Western Europe Market Y-o-Y Growth Comparison by Material, 2025-2035
  • Figure 49: Western Europe Market Attractiveness Analysis by Material
  • Figure 50: Western Europe Market Value Share and BPS Analysis by End-use Industry, 2025 and 2035
  • Figure 51: Western Europe Market Y-o-Y Growth Comparison by End-use Industry, 2025-2035
  • Figure 52: Western Europe Market Attractiveness Analysis by End-use Industry
  • Figure 53: Eastern Europe Market Value Share and BPS Analysis by Country, 2025 and 2035
  • Figure 54: Eastern Europe Market Value Share and BPS Analysis by Product, 2025 and 2035
  • Figure 55: Eastern Europe Market Y-o-Y Growth Comparison by Product, 2025-2035
  • Figure 56: Eastern Europe Market Attractiveness Analysis by Product
  • Figure 57: Eastern Europe Market Value Share and BPS Analysis by Material, 2025 and 2035
  • Figure 58: Eastern Europe Market Y-o-Y Growth Comparison by Material, 2025-2035
  • Figure 59: Eastern Europe Market Attractiveness Analysis by Material
  • Figure 60: Eastern Europe Market Value Share and BPS Analysis by End-use Industry, 2025 and 2035
  • Figure 61: Eastern Europe Market Y-o-Y Growth Comparison by End-use Industry, 2025-2035
  • Figure 62: Eastern Europe Market Attractiveness Analysis by End-use Industry
  • Figure 63: East Asia Market Value Share and BPS Analysis by Country, 2025 and 2035
  • Figure 64: East Asia Market Value Share and BPS Analysis by Product, 2025 and 2035
  • Figure 65: East Asia Market Y-o-Y Growth Comparison by Product, 2025-2035
  • Figure 66: East Asia Market Attractiveness Analysis by Product
  • Figure 67: East Asia Market Value Share and BPS Analysis by Material, 2025 and 2035
  • Figure 68: East Asia Market Y-o-Y Growth Comparison by Material, 2025-2035
  • Figure 69: East Asia Market Attractiveness Analysis by Material
  • Figure 70: East Asia Market Value Share and BPS Analysis by End-use Industry, 2025 and 2035
  • Figure 71: East Asia Market Y-o-Y Growth Comparison by End-use Industry, 2025-2035
  • Figure 72: East Asia Market Attractiveness Analysis by End-use Industry
  • Figure 73: South Asia & Pacific Market Value Share and BPS Analysis by Country, 2025 and 2035
  • Figure 74: South Asia & Pacific Market Value Share and BPS Analysis by Product, 2025 and 2035
  • Figure 75: South Asia & Pacific Market Y-o-Y Growth Comparison by Product, 2025-2035
  • Figure 76: South Asia & Pacific Market Attractiveness Analysis by Product
  • Figure 77: South Asia & Pacific Market Value Share and BPS Analysis by Material, 2025 and 2035
  • Figure 78: South Asia & Pacific Market Y-o-Y Growth Comparison by Material, 2025-2035
  • Figure 79: South Asia & Pacific Market Attractiveness Analysis by Material
  • Figure 80: South Asia & Pacific Market Value Share and BPS Analysis by End-use Industry, 2025 and 2035
  • Figure 81: South Asia & Pacific Market Y-o-Y Growth Comparison by End-use Industry, 2025-2035
  • Figure 82: South Asia & Pacific Market Attractiveness Analysis by End-use Industry
  • Figure 83: Middle East and Africa Market Value Share and BPS Analysis by Country, 2025 and 2035
  • Figure 84: Middle East and Africa Market Value Share and BPS Analysis by Product, 2025 and 2035
  • Figure 85: Middle East and Africa Market Y-o-Y Growth Comparison by Product, 2025-2035
  • Figure 86: Middle East and Africa Market Attractiveness Analysis by Product
  • Figure 87: Middle East and Africa Market Value Share and BPS Analysis by Material, 2025 and 2035
  • Figure 88: Middle East and Africa Market Y-o-Y Growth Comparison by Material, 2025-2035
  • Figure 89: Middle East and Africa Market Attractiveness Analysis by Material
  • Figure 90: Middle East and Africa Market Value Share and BPS Analysis by End-use Industry, 2025 and 2035
  • Figure 91: Middle East and Africa Market Y-o-Y Growth Comparison by End-use Industry, 2025-2035
  • Figure 92: Middle East and Africa Market Attractiveness Analysis by End-use Industry
  • Figure 93: Global Market - Tier Structure Analysis
  • Figure 94: Global Market - Company Share Analysis

Frequently Asked Questions

What is the projected market value of the global lubricant packaging industry by 2035?

The industry is expected to grow from USD 13.4 billion in 2025 to USD 22.7 billion by 2035.

What share of lubricant packaging is expected to come from plastic materials in 2025?

Plastic packaging will account for approximately 65% of total lubricant packaging usage in 2025.

Which end-use industry will dominate lubricant packaging consumption in 2025?

The automotive industry will consume over 54% of lubricant packaging volume globally in 2025.

What is the expected product share of engine oil in lubricant packaging by 2025?

Engine oil packaging will hold a 39% share of the total lubricant packaging industry in 2025.

Who is the leading player in the global lubricant packaging market by market share?

Amcor Plc leads the market with a 14% share in the global industry.

Explore Similar Insights

Future Market Insights

Lubricant Packaging Market