Plastic Resins Market Size and Share Forecast Outlook 2025 to 2035

The plastic resins market is projected to grow from USD 662.9 billion in 2025 to USD 971.9 billion by 2035, registering a CAGR of 3.9% during the forecast period. Sales in 2024 reached USD 637.1 billion, reflecting steady growth driven by increasing demand across various end-use industries such as packaging, automotive, construction, and electronics.
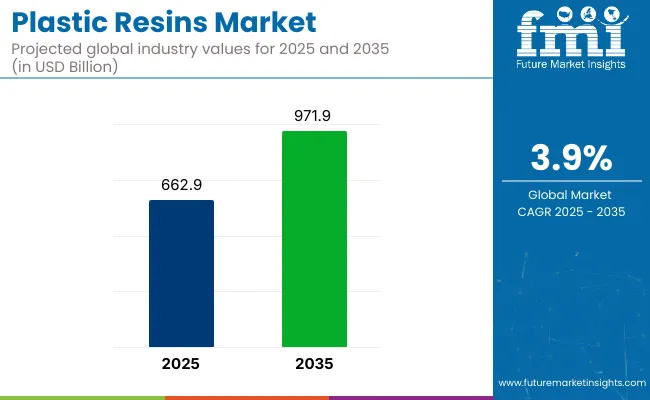
Quick Stats of Plastic Resins Market

  • Market Value (2025): USD 662.9 billion
  • Forecast Value (2035): USD 971.9 billion
  • Forecast CAGR: 3.9%
  • Product Leader in 2025: Polyethylene (PE) (29.4% market share)
  • Top Application: Food and Beverage (33.7% share)
  • Key Growth Region: Asia-Pacific (Japan is the fastest-growing market with 5.1% CAGR)

Plastic Resins Market

Metric Value
Market Size in 2025 USD 662.9 billion
Projected Market Size in 2035 USD 971.9 billion
CAGR (2025 to 2035) 3.9%

This growth is attributed to the versatility of plastic resins, which are used in manufacturing a wide range of products due to their durability, lightweight, and resistance to corrosion and chemicals. The market's expansion is further supported by innovations in plastic resin manufacturing processes and the rising demand for sustainable and eco-friendly plastics.

In October 2024, The Plastics Industry Association (PLASTICS) released its annual Global Trends report during the Association’s inaugural National Plastics Conference. “The USA plastics industry’s position as a leader in the global plastics trade underscores the essential role of plastics and its importance across multiple industries,” said PLASTICS President and CEO, Matt Seaholm. “Our members are consistently innovating and investing in new technologies to enhance sustainability and efficiency while continuing to supply critical materials that improve lives worldwide.”

The plastic resins market is increasingly shaped by sustainability, as producers emphasize the development of resins using recyclable and environmentally friendly materials. Innovations include the development of biodegradable resins, integration of smart features such as improved barrier properties, and advancements in polymer chemistry to enhance performance.

These advancements align with global sustainability goals and regulatory requirements, making plastic resins an attractive option for environmentally conscious consumers. Additionally, the development of advanced recycling technologies has enhanced efficiency and reduced environmental impact, further driving market growth.

Strong growth is anticipated in the plastic resins market, propelled by rising demand for efficient and sustainable materials in the packaging, automotive, construction, and electronics sectors. Companies investing in innovative, eco-friendly technologies are expected to gain a competitive edge.

The market's expansion is further supported by the growing emphasis on circular economy models and recycling initiatives. With continuous advancements in materials and manufacturing processes, the plastic resins market is set to offer lucrative opportunities for stakeholders over the forecast period.

Analyzing Plastic Resins Market by Top Investment Segment

The market is segmented based on resin type, end-use industry, and region. By resin type, the market includes polyethylene (PE), polypropylene (PP), polyvinyl chloride (PVC), polystyrene (PS), polyethylene terephthalate (PET), acrylonitrile butadiene styrene (ABS), and other specialty resins.

In terms of end-use industry, the market is categorized into food & beverage, healthcare & pharmaceuticals, building & construction, automotive & transportation, electrical & electronics, consumer products, agriculture, and industrial manufacturing. Regionally, the market is analyzed across North America, Latin America, East Asia, South Asia & Pacific, Eastern Europe, Western Europe, Oceania, and the Middle East & Africa.

Polyethylene Selected for Versatility Across Packaging and Consumer Applications

Polyethylene (PE) has been projected to account for 29.4% of the global plastic resins market by 2025, owing to its widespread applicability in flexible and rigid packaging, household containers, industrial films, and agricultural sheets. Both high-density polyethylene (HDPE) and low-density polyethylene (LDPE) variants have been utilized based on tensile strength, transparency, and sealing characteristics.

Process ability through blow molding, injection molding, and film extrusion has supported polyethylene's integration into cost-sensitive and high-throughput production environments. Moisture resistance, chemical inertness, and FDA compliance have made PE a preferred material for food-grade and pharmaceutical contact packaging.

Packaging manufacturers, FMCG firms, and agricultural film producers have continued to rely on polyethylene for its cost-performance balance, ease of recycling, and global availability. Developments in metallocene catalyst technologies and bio-based PE production have further extended the material's relevance in low-carbon and recyclable formats.

Global regulations promoting single-material recyclability and circular economy adoption have reinforced the dominance of polyethylene in both primary and secondary packaging formats. Investments in closed-loop systems and PCR-enhanced PE grades have aligned with brand commitments to sustainable material sourcing.
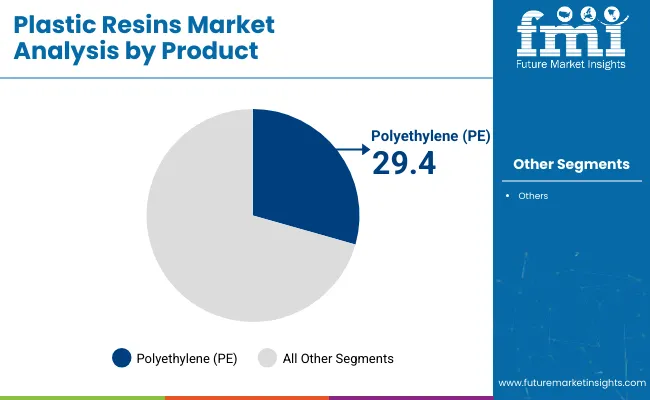
Plastic Resins Market Analysis By Product

Packaging Demand from Food & Beverage Sector Drives Resin Consumption

The food and beverage industry has been estimated to contribute 33.7% of the global plastic resins market by 2025, supported by the increasing demand for lightweight, barrier-enhanced, and tamper-evident packaging solutions. Rigid and flexible containers, closures, films, trays, and multilayer laminates have been widely manufactured using PE, PET, PP, and PS resins.

Barrier protection against moisture, oxygen, and light has been enhanced through coextrusion and multilayer resin engineering, particularly in applications involving perishable products, dairy, beverages, and frozen meals. PET and PP have been favored for hot-fill and retort packaging formats, while LDPE has been deployed for flexible wrapping and sealant layers.

Multinational food processors, dairy cooperatives, and beverage bottlers have continued to invest in resin-optimized lines to balance cost, shelf-life, and recyclability. Resin selection has been increasingly influenced by lifecycle analysis (LCA), EPR regulations, and labeling transparency for food-contact materials.

Legislation restricting single-use plastics and promoting reusable or recyclable packaging formats has driven rapid reformulation across food categories. Investment in Monomaterial resin blends and infrastructure for resin-to-resin recycling has gained momentum, particularly in Europe and North America.
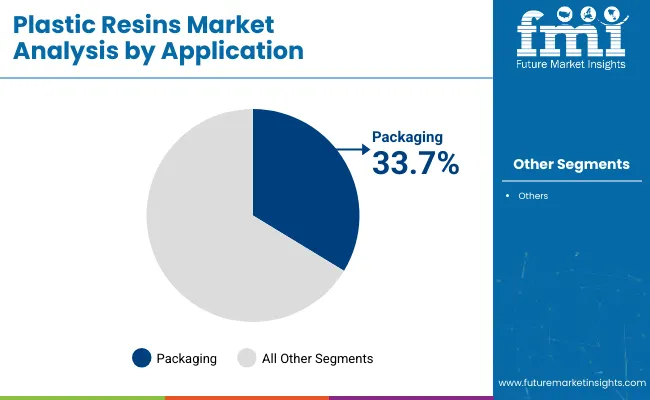
Plastic Resins Market Analysis By Application

Challenges and Opportunities

Challenges

Environmental Regulations and Petrochemical Dependency

The ever-increasing challenges for the plastic resins industry from stringent environmental regulations (such as single-use plastic restrictions), increased landfill taxes and carbon emissions limits. Most classical resins, like polyethylene (PE), polypropylene (PP), and polystyrene (PS), are petroleum-derived, which connects the market directly to volatile crude oil prices and fossil fuel dependency.

Opportunities

Rise of Bio-Based Resins, Circular Economy Models, and High-Performance Engineering Plastics

Regulatory pressures have been a challenging barrier for the plastic resins market, but strong growth potential remains in bio-based and recycled resins, especially in packaging, automotive, consumer goods, and electronics.

New closed-loop recycling technologies, biodegradable resins (such as PLA, PHA), and even post-consumer recycled (PCR) resins are transforming what sustainable plastics actually look like. At the same time, industries including electric vehicles, 5G infrastructure, and medical device printing are spurring demand for high-performance engineering resins (for example, PEEK, PA66, PC and ABS) that provide lightweighting, heat resistance and durability.

Country-wise Outlook

United States

According to forecasts, growth in the US plastic resins market will continue, driven by sustained interest from packaging, automotive, and healthcare sectors. Polyethylene (PE), polypropylene (PP) and PET are the most common and widely used in consumer goods and industrial applications.

Regulatory pressure and corporates sustainability goals are pushing more towards recycled resins and bio-based alternatives. Investments in high-performance engineering plastics for lightweighting in automotive and aerospace are increasing in the United States as well.

Country CAGR (2025 to 2035)
USA 4.1%

United Kingdom

Increasing demand from food and beverage packaging, medical devices & packaging, construction applications, among others, are driving the growth of the UK Plastic Resins market moderately. Nevertheless, growing environment-related regulations and plastic tax is leading to a shift towards recyclable and biodegradable resin types.

Indeed, the manufacturers are ramping up investments in many circular economy projects - from closed-loop recycling to the development of bio-resins. The demand for post-consumer recycled (PCR) resins is also increasing in response to sustainability commitments by retail and fast-moving consumer goods (FMCG) brands.

Country CAGR (2025 to 2035)
UK 3.7%

European Union

These trends in plastic resins market are primarily driven by EU Green Deal, Circular Economy action plan, and single-use plastics ban in the region transform the plastic resins market in Europe. Industrial and automotive remain strong areas of demand, and innovation in bio-based and compostable resins is accelerating as well.

Germany, France, and Italy are at the forefront of advanced polymer applications and plastic recycling technologies. To comply with regulatory and ESG requirements, the market is increasingly moving towards high-performance and recyclable resins.

Country CAGR (2025 to 2035)
EU 3.6%

Japan

Market of plastic resins in Japan is steadily growing on the back of electronics, automotive, and medical packaging sectors. Novus specialty materials are coveted among niche markets stemming from the trend toward miniaturization and innovation, electric vehicles and precision components are just a few high-performance resins in demand including ABS, PC, and PBT.

Big efforts are being made for sustainable materials and advanced recycling technologies, supported by R&D partnerships between government and industry wings in bio-based and ocean-degradable resins.

Country CAGR (2025 to 2035)
Japan 22.1%

South Korea

South Korea plastic resins market is growing with the supporting growth from consumer electronics, semiconductors and packaging industry. The growing demand for specialty resins in 5G infrastructure and electric vehicles will push high-value segment growth.

Sustainability initiatives are prompting local enterprises to put their money into chemical recycling, biodegradable plastics and low-carbon resin manufacturing. There is also exciting innovation happening around light-weight composite resins.

Country CAGR (2025 to 2035)
South Korea 3.8%

Competitive Outlook

Plastic resins market is growing steadily due to demand in the packaging, automotive, construction, consumer goods, electronics, and medical industries. What are the raw materials from which plastic products are made? Plastic resins are the raw materials used to manufacture most plastic products via processes such as injection molding, extrusion, blow molding, and thermoforming. Increasing demand for biodegradable plastics, sustainability of polymers, and lightweighting development projects drive market growth.

Key Players

  • ExxonMobil Chemical
  • Dow Inc.
  • BASF SE
  • Arkema
  • Chevron Phillips Chemical
  • INEOS Group
  • Mitsubishi Chemical Group Corporation
  • Eastman Chemical Company
  • Dow Inc.
  • Celanese Corporation

Top Segments Studied in the Plastic Resins Market Research Report

By Product:

  • Crystalline
    • Epoxy
    • Polyethylene
    • Polypropylene
  • Non-crystalline
    • Polyvinyl Chloride (PVC)
    • Polystyrene (PS)
    • Acrylonitrile Butadiene Styrene (ABS)
    • Polymethyl Methacrylate (PMMA)
  • Engineering Plastic
    • Nylon
    • Polybutylene Terephthalate (PBT)
    • Polycarbonate (PC)
    • Polyamide
  • Super Engineering Plastic
    • Polyphenylene Sulfide (PPS)
    • Polyether Ether Ketone (PEEK)
    • Liquid Crystal Polymer (LCP)

By Application:

  • Packaging
    • Food
    • Beverage
    • Medical
    • Retail
    • Others
  • Automotive
  • Construction
  • Electrical & Electronics
    • OA Equipment and Home Appliances
    • Electronic Materials
    • Others
  • Logistics
  • Consumer Goods
  • Textiles & Clothing
    • Clothing
    • Industrial use
    • Others
  • Furniture & Bedding
  • Agriculture
  • Medical Devices
  • Others

By Region:

  • North America
  • Latin America
  • Western Europe
  • Eastern Europe
  • Asia Pacific Excluding Japan (APEJ)
  • Japan
  • The Middle East & Africa (MEA)

Table of Content

  1. Executive Summary
    • Global Market Outlook
    • Demand-side Trends
    • Supply-side Trends
    • Technology Roadmap Analysis
    • Analysis and Recommendations
  2. Market Overview
    • Market Coverage / Taxonomy
    • Market Definition / Scope / Limitations
  3. Market Background
    • Market Dynamics
      • Drivers
      • Restraints
      • Opportunity
      • Trends
    • Scenario Forecast
      • Demand in Optimistic Scenario
      • Demand in Likely Scenario
      • Demand in Conservative Scenario
    • Opportunity Map Analysis
    • Product Life Cycle Analysis
    • Supply Chain Analysis
      • Supply Side Participants and their Roles
        • Producers
        • Mid-Level Participants (Traders/ Agents/ Brokers)
        • Wholesalers and Distributors
      • Value Added in Supply Chain
      • List of Raw Material Suppliers
      • List of Existing and Potential Buyer’s
    • Investment Feasibility Matrix
    • Value Chain Analysis
      • Profit Margin Analysis
      • Wholesalers and Distributors
      • Retailers
    • PESTLE and Porter’s Analysis
    • Regulatory Landscape
      • By Key Regions
      • By Key Countries
    • Regional Parent Market Outlook
    • Production and Consumption Statistics
    • Import and Export Statistics
  4. Global Market Analysis 2020 to 2024 and Forecast, 2025 to 2035
    • Historical Market Size Value (USD Million) & Volume (Tons) Analysis, 2020 to 2024
    • Current and Future Market Size Value (USD Million) & Volume (Tons) Projections, 2025 to 2035
      • Y-o-Y Growth Trend Analysis
      • Absolute $ Opportunity Analysis
  5. Global Market Pricing Analysis 2020 to 2024 and Forecast 2025 to 2035
  6. Global Market Analysis 2020 to 2024 and Forecast 2025 to 2035, By Resin Type
    • Introduction / Key Findings
    • Historical Market Size Value (USD Million) & Volume (Tons) Analysis By Resin Type, 2020 to 2024
    • Current and Future Market Size Value (USD Million) & Volume (Tons) Analysis and Forecast By Resin Type, 2025 to 2035
      • Polyethylene (PE)
      • Polypropylene (PP)
      • Polyvinyl Chloride (PVC)
      • Polystyrene (PS)
      • Polyethylene Terephthalate (PET)
      • Acrylonitrile Butadiene Styrene (ABS)
      • Others
    • Y-o-Y Growth Trend Analysis By Resin Type, 2020 to 2024
    • Absolute $ Opportunity Analysis By Resin Type, 2025 to 2035
  7. Global Market Analysis 2020 to 2024 and Forecast 2025 to 2035, By Application
    • Introduction / Key Findings
    • Historical Market Size Value (USD Million) & Volume (Tons) Analysis By Application, 2020 to 2024
    • Current and Future Market Size Value (USD Million) & Volume (Tons) Analysis and Forecast By Application, 2025 to 2035
      • Packaging
      • Automotive
      • Construction
      • Electrical & Electronics
      • Consumer Goods
      • Healthcare
      • Agriculture
      • Industrial
    • Y-o-Y Growth Trend Analysis By Application, 2020 to 2024
    • Absolute $ Opportunity Analysis By Application, 2025 to 2035
  8. Global Market Analysis 2020 to 2024 and Forecast 2025 to 2035, By End Use Industry
    • Introduction / Key Findings
    • Historical Market Size Value (USD Million) & Volume (Tons) Analysis By End Use Industry, 2020 to 2024
    • Current and Future Market Size Value (USD Million) & Volume (Tons) Analysis and Forecast By End Use Industry, 2025 to 2035
      • Food & Beverage
      • Healthcare & Pharmaceuticals
      • Building & Construction
      • Automotive & Transportation
      • Electrical & Electronics
      • Consumer Products
      • Agriculture
      • Industrial Manufacturing
    • Y-o-Y Growth Trend Analysis By End Use Industry, 2020 to 2024
    • Absolute $ Opportunity Analysis By End Use Industry, 2025 to 2035
  9. Global Market Analysis 2020 to 2024 and Forecast 2025 to 2035, By Region
    • Introduction
    • Historical Market Size Value (USD Million) & Volume (Tons) Analysis By Region, 2020 to 2024
    • Current Market Size Value (USD Million) & Volume (Tons) Analysis and Forecast By Region, 2025 to 2035
      • North America
      • Latin America
      • Europe
      • East Asia
      • South Asia
      • Oceania
      • MEA
    • Market Attractiveness Analysis By Region
  10. North America Market Analysis 2020 to 2024 and Forecast 2025 to 2035, By Country
    • Historical Market Size Value (USD Million) & Volume (Tons) Trend Analysis By Market Taxonomy, 2020 to 2024
    • Market Size Value (USD Million) & Volume (Tons) Forecast By Market Taxonomy, 2025 to 2035
      • By Country
        • USA
        • Canada
      • By Resin Type
      • By Application
      • By End Use Industry
    • Market Attractiveness Analysis
      • By Country
      • By Resin Type
      • By Application
      • By End Use Industry
    • Key Takeaways
  11. Latin America Market Analysis 2020 to 2024 and Forecast 2025 to 2035, By Country
    • Historical Market Size Value (USD Million) & Volume (Tons) Trend Analysis By Market Taxonomy, 2020 to 2024
    • Market Size Value (USD Million) & Volume (Tons) Forecast By Market Taxonomy, 2025 to 2035
      • By Country
        • Brazil
        • Mexico
        • Argentina
        • Chile
        • Peru
        • Rest of Latin America
      • By Resin Type
      • By Application
      • By End Use Industry
    • Market Attractiveness Analysis
      • By Country
      • By Resin Type
      • By Application
      • By End Use Industry
    • Key Takeaways
  12. Europe Market Analysis 2020 to 2024 and Forecast 2025 to 2035, By Country
    • Historical Market Size Value (USD Million) & Volume (Tons) Trend Analysis By Market Taxonomy, 2020 to 2024
    • Market Size Value (USD Million) & Volume (Tons) Forecast By Market Taxonomy, 2025 to 2035
      • By Country
        • Germany
        • Italy
        • France
        • UK
        • Spain
        • Russia
        • BENELUX
        • Rest of Europe
      • By Resin Type
      • By Application
      • By End Use Industry
    • Market Attractiveness Analysis
      • By Country
      • By Resin Type
      • By Application
      • By End Use Industry
    • Key Takeaways
  13. East Asia Market Analysis 2020 to 2024 and Forecast 2025 to 2035, By Country
    • Historical Market Size Value (USD Million) & Volume (Tons) Trend Analysis By Market Taxonomy, 2020 to 2024
    • Market Size Value (USD Million) & Volume (Tons) Forecast By Market Taxonomy, 2025 to 2035
      • By Country
        • China
        • Japan
        • South Korea
      • By Resin Type
      • By Application
      • By End Use Industry
    • Market Attractiveness Analysis
      • By Country
      • By Resin Type
      • By Application
      • By End Use Industry
    • Key Takeaways
  14. South Asia Market Analysis 2020 to 2024 and Forecast 2025 to 2035, By Country
    • Historical Market Size Value (USD Million) & Volume (Tons) Trend Analysis By Market Taxonomy, 2020 to 2024
    • Market Size Value (USD Million) & Volume (Tons) Forecast By Market Taxonomy, 2025 to 2035
      • By Country
        • India
        • Thailand
        • Malaysia
        • Indonesia
        • Rest of South Asia
      • By Resin Type
      • By Application
      • By End Use Industry
    • Market Attractiveness Analysis
      • By Country
      • By Resin Type
      • By Application
      • By End Use Industry
    • Key Takeaways
  15. Oceania Market Analysis 2020 to 2024 and Forecast 2025 to 2035, By Country
    • Historical Market Size Value (USD Million) & Volume (Tons) Trend Analysis By Market Taxonomy, 2020 to 2024
    • Market Size Value (USD Million) & Volume (Tons) Forecast By Market Taxonomy, 2025 to 2035
      • By Country
        • Australia
        • New Zealand
      • By Resin Type
      • By Application
      • By End Use Industry
    • Market Attractiveness Analysis
      • By Country
      • By Resin Type
      • By Application
      • By End Use Industry
    • Key Takeaways
  16. MEA Market Analysis 2020 to 2024 and Forecast 2025 to 2035, By Country
    • Historical Market Size Value (USD Million) & Volume (Tons) Trend Analysis By Market Taxonomy, 2020 to 2024
    • Market Size Value (USD Million) & Volume (Tons) Forecast By Market Taxonomy, 2025 to 2035
      • By Country
        • GCC
        • Rest of MEA
      • By Resin Type
      • By Application
      • By End Use Industry
    • Market Attractiveness Analysis
      • By Country
      • By Resin Type
      • By Application
      • By End Use Industry
    • Key Takeaways
  17. Key Countries Market Analysis
    • USA
      • Pricing Analysis
      • Market Share Analysis, 2024
        • By Resin Type
        • By Application
        • By End Use Industry
    • Canada
      • Pricing Analysis
      • Market Share Analysis, 2024
        • By Resin Type
        • By Application
        • By End Use Industry
    • Brazil
      • Pricing Analysis
      • Market Share Analysis, 2024
        • By Resin Type
        • By Application
        • By End Use Industry
    • Mexico
      • Pricing Analysis
      • Market Share Analysis, 2024
        • By Resin Type
        • By Application
        • By End Use Industry
    • Argentina
      • Pricing Analysis
      • Market Share Analysis, 2024
        • By Resin Type
        • By Application
        • By End Use Industry
  18. Market Structure Analysis
    • Competition Dashboard
    • Competition Benchmarking
    • Market Share Analysis of Top Players
      • By Regional
      • By Resin Type
      • By Application
      • By End Use Industry
  19. Competition Analysis
    • Competition Deep Dive
      • ExxonMobil Chemical
        • Overview
        • Product Portfolio
        • Profitability by Market Segments (Product/Age /Sales Channel/Region)
        • Sales Footprint
        • Strategy Overview
          • Marketing Strategy
          • Product Strategy
          • Channel Strategy
      • Dow Inc.
        • Overview
        • Product Portfolio
        • Profitability by Market Segments (Product/Age /Sales Channel/Region)
        • Sales Footprint
        • Strategy Overview
          • Marketing Strategy
          • Product Strategy
          • Channel Strategy
      • BASF SE
        • Overview
        • Product Portfolio
        • Profitability by Market Segments (Product/Age /Sales Channel/Region)
        • Sales Footprint
        • Strategy Overview
          • Marketing Strategy
          • Product Strategy
          • Channel Strategy
      • Arkema
        • Overview
        • Product Portfolio
        • Profitability by Market Segments (Product/Age /Sales Channel/Region)
        • Sales Footprint
        • Strategy Overview
          • Marketing Strategy
          • Product Strategy
          • Channel Strategy
      • Chevron Phillips Chemical
        • Overview
        • Product Portfolio
        • Profitability by Market Segments (Product/Age /Sales Channel/Region)
        • Sales Footprint
        • Strategy Overview
          • Marketing Strategy
          • Product Strategy
          • Channel Strategy
      • INEOS Group
        • Overview
        • Product Portfolio
        • Profitability by Market Segments (Product/Age /Sales Channel/Region)
        • Sales Footprint
        • Strategy Overview
          • Marketing Strategy
          • Product Strategy
          • Channel Strategy
      • Mitsubishi Chemical Group Corporation
        • Overview
        • Product Portfolio
        • Profitability by Market Segments (Product/Age /Sales Channel/Region)
        • Sales Footprint
        • Strategy Overview
          • Marketing Strategy
          • Product Strategy
          • Channel Strategy
      • Eastman Chemical Company
        • Overview
        • Product Portfolio
        • Profitability by Market Segments (Product/Age /Sales Channel/Region)
        • Sales Footprint
        • Strategy Overview
          • Marketing Strategy
          • Product Strategy
          • Channel Strategy
      • Dow Inc.
        • Overview
        • Product Portfolio
        • Profitability by Market Segments (Product/Age /Sales Channel/Region)
        • Sales Footprint
        • Strategy Overview
          • Marketing Strategy
          • Product Strategy
          • Channel Strategy
      • Celanese Corporation
        • Overview
        • Product Portfolio
        • Profitability by Market Segments (Product/Age /Sales Channel/Region)
        • Sales Footprint
        • Strategy Overview
          • Marketing Strategy
          • Product Strategy
          • Channel Strategy
  20. Assumptions & Acronyms Used
  21. Research Methodology

List of Tables

  • Table 1: Global Market Value (USD Million) Forecast by Region, 2020-2035
  • Table 2: Global Market Volume (Tons) Forecast by Region, 2020-2035
  • Table 3: Global Market Value (USD Million) Forecast by Resin Type, 2020-2035
  • Table 4: Global Market Volume (Tons) Forecast by Resin Type, 2020-2035
  • Table 5: Global Market Value (USD Million) Forecast by Application, 2020-2035
  • Table 6: Global Market Volume (Tons) Forecast by Application, 2020-2035
  • Table 7: Global Market Value (USD Million) Forecast by End Use Industry, 2020-2035
  • Table 8: Global Market Volume (Tons) Forecast by End Use Industry, 2020-2035
  • Table 9: North America Market Value (USD Million) Forecast by Country, 2020-2035
  • Table 10: North America Market Volume (Tons) Forecast by Country, 2020-2035
  • Table 11: North America Market Value (USD Million) Forecast by Resin Type, 2020-2035
  • Table 12: North America Market Volume (Tons) Forecast by Resin Type, 2020-2035
  • Table 13: North America Market Value (USD Million) Forecast by Application, 2020-2035
  • Table 14: North America Market Volume (Tons) Forecast by Application, 2020-2035
  • Table 15: North America Market Value (USD Million) Forecast by End Use Industry, 2020-2035
  • Table 16: North America Market Volume (Tons) Forecast by End Use Industry, 2020-2035
  • Table 17: Latin America Market Value (USD Million) Forecast by Country, 2020-2035
  • Table 18: Latin America Market Volume (Tons) Forecast by Country, 2020-2035
  • Table 19: Latin America Market Value (USD Million) Forecast by Resin Type, 2020-2035
  • Table 20: Latin America Market Volume (Tons) Forecast by Resin Type, 2020-2035
  • Table 21: Latin America Market Value (USD Million) Forecast by Application, 2020-2035
  • Table 22: Latin America Market Volume (Tons) Forecast by Application, 2020-2035
  • Table 23: Latin America Market Value (USD Million) Forecast by End Use Industry, 2020-2035
  • Table 24: Latin America Market Volume (Tons) Forecast by End Use Industry, 2020-2035
  • Table 25: Europe Market Value (USD Million) Forecast by Country, 2020-2035
  • Table 26: Europe Market Volume (Tons) Forecast by Country, 2020-2035
  • Table 27: Europe Market Value (USD Million) Forecast by Resin Type, 2020-2035
  • Table 28: Europe Market Volume (Tons) Forecast by Resin Type, 2020-2035
  • Table 29: Europe Market Value (USD Million) Forecast by Application, 2020-2035
  • Table 30: Europe Market Volume (Tons) Forecast by Application, 2020-2035
  • Table 31: Europe Market Value (USD Million) Forecast by End Use Industry, 2020-2035
  • Table 32: Europe Market Volume (Tons) Forecast by End Use Industry, 2020-2035
  • Table 33: East Asia Market Value (USD Million) Forecast by Country, 2020-2035
  • Table 34: East Asia Market Volume (Tons) Forecast by Country, 2020-2035
  • Table 35: East Asia Market Value (USD Million) Forecast by Resin Type, 2020-2035
  • Table 36: East Asia Market Volume (Tons) Forecast by Resin Type, 2020-2035
  • Table 37: East Asia Market Value (USD Million) Forecast by Application, 2020-2035
  • Table 38: East Asia Market Volume (Tons) Forecast by Application, 2020-2035
  • Table 39: East Asia Market Value (USD Million) Forecast by End Use Industry, 2020-2035
  • Table 40: East Asia Market Volume (Tons) Forecast by End Use Industry, 2020-2035
  • Table 41: South Asia Market Value (USD Million) Forecast by Country, 2020-2035
  • Table 42: South Asia Market Volume (Tons) Forecast by Country, 2020-2035
  • Table 43: South Asia Market Value (USD Million) Forecast by Resin Type, 2020-2035
  • Table 44: South Asia Market Volume (Tons) Forecast by Resin Type, 2020-2035
  • Table 45: South Asia Market Value (USD Million) Forecast by Application, 2020-2035
  • Table 46: South Asia Market Volume (Tons) Forecast by Application, 2020-2035
  • Table 47: South Asia Market Value (USD Million) Forecast by End Use Industry, 2020-2035
  • Table 48: South Asia Market Volume (Tons) Forecast by End Use Industry, 2020-2035
  • Table 49: Oceania Market Value (USD Million) Forecast by Country, 2020-2035
  • Table 50: Oceania Market Volume (Tons) Forecast by Country, 2020-2035
  • Table 51: Oceania Market Value (USD Million) Forecast by Resin Type, 2020-2035
  • Table 52: Oceania Market Volume (Tons) Forecast by Resin Type, 2020-2035
  • Table 53: Oceania Market Value (USD Million) Forecast by Application, 2020-2035
  • Table 54: Oceania Market Volume (Tons) Forecast by Application, 2020-2035
  • Table 55: Oceania Market Value (USD Million) Forecast by End Use Industry, 2020-2035
  • Table 56: Oceania Market Volume (Tons) Forecast by End Use Industry, 2020-2035
  • Table 57: MEA Market Value (USD Million) Forecast by Country, 2020-2035
  • Table 58: MEA Market Volume (Tons) Forecast by Country, 2020-2035
  • Table 59: MEA Market Value (USD Million) Forecast by Resin Type, 2020-2035
  • Table 60: MEA Market Volume (Tons) Forecast by Resin Type, 2020-2035
  • Table 61: MEA Market Value (USD Million) Forecast by Application, 2020-2035
  • Table 62: MEA Market Volume (Tons) Forecast by Application, 2020-2035
  • Table 63: MEA Market Value (USD Million) Forecast by End Use Industry, 2020-2035
  • Table 64: MEA Market Volume (Tons) Forecast by End Use Industry, 2020-2035

List of Figures

  • Figure 1: Global Market Volume (Tons) Forecast 2020-2035
  • Figure 2: Global Market Pricing Analysis
  • Figure 3: Global Market Value (USD Million) Forecast 2020-2035
  • Figure 4: Global Market Value Share and BPS Analysis by Resin Type, 2025 and 2035
  • Figure 5: Global Market Y-o-Y Growth Comparison by Resin Type, 2025-2035
  • Figure 6: Global Market Attractiveness Analysis by Resin Type
  • Figure 7: Global Market Value Share and BPS Analysis by Application, 2025 and 2035
  • Figure 8: Global Market Y-o-Y Growth Comparison by Application, 2025-2035
  • Figure 9: Global Market Attractiveness Analysis by Application
  • Figure 10: Global Market Value Share and BPS Analysis by End Use Industry, 2025 and 2035
  • Figure 11: Global Market Y-o-Y Growth Comparison by End Use Industry, 2025-2035
  • Figure 12: Global Market Attractiveness Analysis by End Use Industry
  • Figure 13: Global Market Value (USD Million) Share and BPS Analysis by Region, 2025 and 2035
  • Figure 14: Global Market Y-o-Y Growth Comparison by Region, 2025-2035
  • Figure 15: Global Market Attractiveness Analysis by Region
  • Figure 16: North America Market Incremental $ Opportunity, 2025-2035
  • Figure 17: Latin America Market Incremental $ Opportunity, 2025-2035
  • Figure 18: Europe Market Incremental $ Opportunity, 2025-2035
  • Figure 19: East Asia Market Incremental $ Opportunity, 2025-2035
  • Figure 20: South Asia Market Incremental $ Opportunity, 2025-2035
  • Figure 21: Oceania Market Incremental $ Opportunity, 2025-2035
  • Figure 22: MEA Market Incremental $ Opportunity, 2025-2035
  • Figure 23: North America Market Value Share and BPS Analysis by Country, 2025 and 2035
  • Figure 24: North America Market Value Share and BPS Analysis by Resin Type, 2025 and 2035
  • Figure 25: North America Market Y-o-Y Growth Comparison by Resin Type, 2025-2035
  • Figure 26: North America Market Attractiveness Analysis by Resin Type
  • Figure 27: North America Market Value Share and BPS Analysis by Application, 2025 and 2035
  • Figure 28: North America Market Y-o-Y Growth Comparison by Application, 2025-2035
  • Figure 29: North America Market Attractiveness Analysis by Application
  • Figure 30: North America Market Value Share and BPS Analysis by End Use Industry, 2025 and 2035
  • Figure 31: North America Market Y-o-Y Growth Comparison by End Use Industry, 2025-2035
  • Figure 32: North America Market Attractiveness Analysis by End Use Industry
  • Figure 33: Latin America Market Value Share and BPS Analysis by Country, 2025 and 2035
  • Figure 34: Latin America Market Value Share and BPS Analysis by Resin Type, 2025 and 2035
  • Figure 35: Latin America Market Y-o-Y Growth Comparison by Resin Type, 2025-2035
  • Figure 36: Latin America Market Attractiveness Analysis by Resin Type
  • Figure 37: Latin America Market Value Share and BPS Analysis by Application, 2025 and 2035
  • Figure 38: Latin America Market Y-o-Y Growth Comparison by Application, 2025-2035
  • Figure 39: Latin America Market Attractiveness Analysis by Application
  • Figure 40: Latin America Market Value Share and BPS Analysis by End Use Industry, 2025 and 2035
  • Figure 41: Latin America Market Y-o-Y Growth Comparison by End Use Industry, 2025-2035
  • Figure 42: Latin America Market Attractiveness Analysis by End Use Industry
  • Figure 43: Europe Market Value Share and BPS Analysis by Country, 2025 and 2035
  • Figure 44: Europe Market Value Share and BPS Analysis by Resin Type, 2025 and 2035
  • Figure 45: Europe Market Y-o-Y Growth Comparison by Resin Type, 2025-2035
  • Figure 46: Europe Market Attractiveness Analysis by Resin Type
  • Figure 47: Europe Market Value Share and BPS Analysis by Application, 2025 and 2035
  • Figure 48: Europe Market Y-o-Y Growth Comparison by Application, 2025-2035
  • Figure 49: Europe Market Attractiveness Analysis by Application
  • Figure 50: Europe Market Value Share and BPS Analysis by End Use Industry, 2025 and 2035
  • Figure 51: Europe Market Y-o-Y Growth Comparison by End Use Industry, 2025-2035
  • Figure 52: Europe Market Attractiveness Analysis by End Use Industry
  • Figure 53: East Asia Market Value Share and BPS Analysis by Country, 2025 and 2035
  • Figure 54: East Asia Market Value Share and BPS Analysis by Resin Type, 2025 and 2035
  • Figure 55: East Asia Market Y-o-Y Growth Comparison by Resin Type, 2025-2035
  • Figure 56: East Asia Market Attractiveness Analysis by Resin Type
  • Figure 57: East Asia Market Value Share and BPS Analysis by Application, 2025 and 2035
  • Figure 58: East Asia Market Y-o-Y Growth Comparison by Application, 2025-2035
  • Figure 59: East Asia Market Attractiveness Analysis by Application
  • Figure 60: East Asia Market Value Share and BPS Analysis by End Use Industry, 2025 and 2035
  • Figure 61: East Asia Market Y-o-Y Growth Comparison by End Use Industry, 2025-2035
  • Figure 62: East Asia Market Attractiveness Analysis by End Use Industry
  • Figure 63: South Asia Market Value Share and BPS Analysis by Country, 2025 and 2035
  • Figure 64: South Asia Market Value Share and BPS Analysis by Resin Type, 2025 and 2035
  • Figure 65: South Asia Market Y-o-Y Growth Comparison by Resin Type, 2025-2035
  • Figure 66: South Asia Market Attractiveness Analysis by Resin Type
  • Figure 67: South Asia Market Value Share and BPS Analysis by Application, 2025 and 2035
  • Figure 68: South Asia Market Y-o-Y Growth Comparison by Application, 2025-2035
  • Figure 69: South Asia Market Attractiveness Analysis by Application
  • Figure 70: South Asia Market Value Share and BPS Analysis by End Use Industry, 2025 and 2035
  • Figure 71: South Asia Market Y-o-Y Growth Comparison by End Use Industry, 2025-2035
  • Figure 72: South Asia Market Attractiveness Analysis by End Use Industry
  • Figure 73: Oceania Market Value Share and BPS Analysis by Country, 2025 and 2035
  • Figure 74: Oceania Market Value Share and BPS Analysis by Resin Type, 2025 and 2035
  • Figure 75: Oceania Market Y-o-Y Growth Comparison by Resin Type, 2025-2035
  • Figure 76: Oceania Market Attractiveness Analysis by Resin Type
  • Figure 77: Oceania Market Value Share and BPS Analysis by Application, 2025 and 2035
  • Figure 78: Oceania Market Y-o-Y Growth Comparison by Application, 2025-2035
  • Figure 79: Oceania Market Attractiveness Analysis by Application
  • Figure 80: Oceania Market Value Share and BPS Analysis by End Use Industry, 2025 and 2035
  • Figure 81: Oceania Market Y-o-Y Growth Comparison by End Use Industry, 2025-2035
  • Figure 82: Oceania Market Attractiveness Analysis by End Use Industry
  • Figure 83: MEA Market Value Share and BPS Analysis by Country, 2025 and 2035
  • Figure 84: MEA Market Value Share and BPS Analysis by Resin Type, 2025 and 2035
  • Figure 85: MEA Market Y-o-Y Growth Comparison by Resin Type, 2025-2035
  • Figure 86: MEA Market Attractiveness Analysis by Resin Type
  • Figure 87: MEA Market Value Share and BPS Analysis by Application, 2025 and 2035
  • Figure 88: MEA Market Y-o-Y Growth Comparison by Application, 2025-2035
  • Figure 89: MEA Market Attractiveness Analysis by Application
  • Figure 90: MEA Market Value Share and BPS Analysis by End Use Industry, 2025 and 2035
  • Figure 91: MEA Market Y-o-Y Growth Comparison by End Use Industry, 2025-2035
  • Figure 92: MEA Market Attractiveness Analysis by End Use Industry
  • Figure 93: Global Market - Tier Structure Analysis
  • Figure 94: Global Market - Company Share Analysis

Frequently Asked Questions

What was the overall size of the plastic resins market in 2025?

The overall market size for plastic resins market was USD 662.9 billion in 2025.

How big the plastic resins market is expected in 2035?

The plastic resins market is expected to reach USD 971.9 billion in 2035.

What will drive the demand for plastic resins market during the forecast period?

Expanding applications in packaging, automotive, and construction industries, rising demand for lightweight and durable materials, and advancements in recyclable and bio-based resins will drive market growth.

List the top 5 countries contributing in plastic resins market?

The top 5 countries which drives the development of plastic resins market are USA, European Union, Japan, South Korea and UK.

Which segment in type is expected to lead plastic resins market?

Polyethylene (PE) and polypropylene (PP) expected to grow to command significant share over the assessment period.

Explore Similar Insights

Future Market Insights

Plastic Resins Market