Plastic Fasteners Market Size and Share Forecast Outlook 2025 to 2035

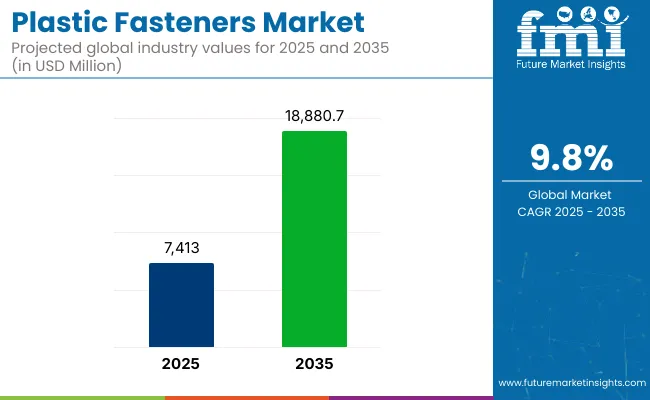
The global plastic fasteners market is projected to grow from USD 7,413.0 million in 2025 to USD 18,880.7 million by 2035, advancing at a compound annual growth rate (CAGR) of 9.8%.
Quick Stats for the Global Plastic Fasteners Market:

  • Industry Value (2025): USD 7,413.0 million
  • Forecast Value (2035): USD 18,880.7 million
  • Forecast CAGR: 9.8%
  • Leading Segment in 2025: Threaded Fasteners (58%)
  • Key Growth Region: Asia-Pacific (implied by automotive, electronics growth)
  • Top Key Players: Stanley Black & Decker, ARaymond, TR Fastenings, Bossard Group, Nifco

Plastic Fasteners Market

Metrics Value
Industry Size (2025E) USD 7,413.0 million
Industry Value (2035F) USD 18,880.7 million
CAGR (2025 to 2035) 9.8%

This growth is being supported by the increasing demand for lightweight, corrosion-resistant, and cost-effective fastening solutions across automotive, electronics, and construction sectors.

Plastic fasteners have seen rising adoption as industries prioritize materials that combine functional strength with material efficiency. High-performance polymers, such as polyamide, polypropylene, and PEEK, are being selected for their enhanced chemical resistance, thermal stability, and mechanical integrity. These materials allow for the development of fasteners that meet the demanding requirements of next-generation assemblies while reducing overall system weight.

In the automotive sector, plastic fasteners are used in interior panels, trim systems, under-hood components, and electric vehicle battery enclosures.

The shift toward electrification and vehicle light-weighting has intensified interest in polymer-based fasteners, particularly in electric vehicle (EV) platforms where reducing mass directly contributes to extended range and improved energy efficiency. Manufacturers are also focusing on fasteners that can withstand thermal cycling, vibration, and chemical exposure typically found in powertrain and underbody applications.

Within the electrical and electronics industry, plastic fasteners serve key functions in cable routing, printed circuit board (PCB) mounting, and enclosures for consumer and industrial devices. These components are chosen for their non-conductive nature and resistance to electromagnetic interference, which supports the ongoing trend toward miniaturized, high-speed electronics.

Applications in servers, communication equipment, and home appliances are increasingly using plastic clips, screws, and rivets that offer design flexibility and insulation performance.

The construction industry is also integrating plastic fasteners into wall paneling systems, cable trays, and HVAC equipment due to their ease of installation, resistance to environmental degradation, and long service life. As building codes evolve to include non-metallic components in infrastructure projects, demand for certified and flame-retardant plastic fastening systems continues to rise.
Analyzing Global Plastic Fasteners Market by Top Investing Segments

Threaded plastic fasteners are anticipated to see rising usage across industrial and consumer applications

Plastic Fasteners Market By Product Type

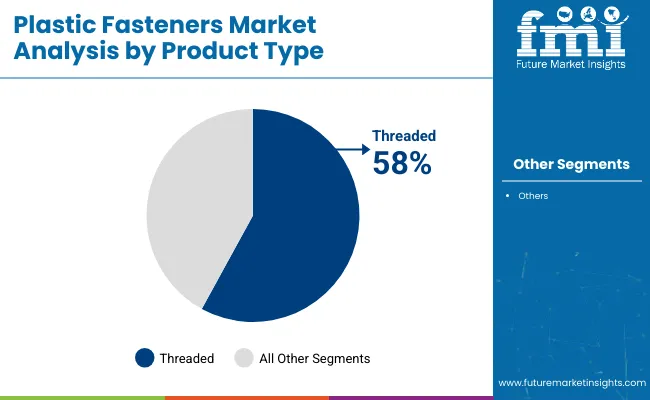
Threaded fasteners are projected to account for approximately 58% of the global plastic fasteners market share in 2025 and are expected to grow at a CAGR of 9.6% through 2035. Products such as nuts, bolts, screws, and inserts are widely used in light-duty assemblies where corrosion resistance, non-conductivity, and chemical inertness are essential. Applications span electronics, home appliances, and automotive interiors, where plastic alternatives to metal fasteners help reduce weight and cost. With growing miniaturization in consumer electronics and expansion of plastic-intensive design in automotive dashboards and under-hood components, demand for threaded plastic fasteners is expected to remain strong across diverse sectors.
Nylon is projected to remain the most widely used material due to its mechanical strength and thermal stability

Plastic Fasteners Market By Material Type

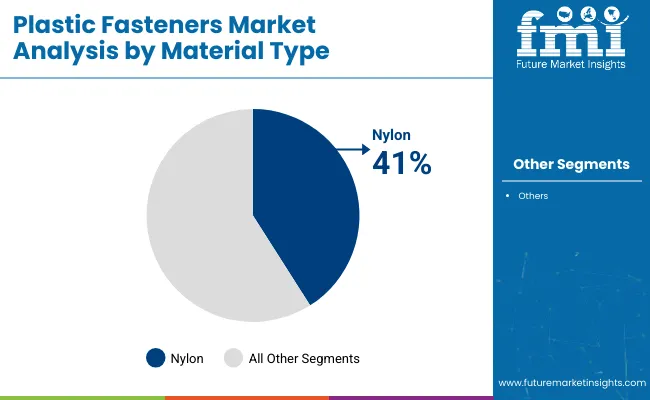
Nylon-based fasteners are estimated to hold approximately 41% of the global market share in 2025 and are projected to grow at a CAGR of 9.9% through 2035. Known for their excellent balance of tensile strength, impact resistance, and chemical durability, nylon fasteners are used extensively in electrical systems, construction fixtures, and HVAC assemblies. They perform reliably across a broad temperature range and are often specified in environments that require non-corrosive and electrically insulating components. With manufacturers prioritizing lightweight, cost-effective alternatives to metal parts, nylon continues to dominate in applications where safety, longevity, and performance under stress are key selection criteria.

Challenges & Opportunities

Challenges

Raw Material Price Volatility

Volatility affects the raw materials prices of the market, notably engineering plastics like nylon, polycarbonate, and polypropylene. The production costs and profitability may be affected by supply chain breakdowns, shortage of resins, and geopolitical tensions.

Strength & Load-Bearing Limitations

Although they provide numerous benefits, they are less mechanically strong than metal fasteners. Their application is restricted to high-load applications, including heavy machinery or aerospace components. The challenge is being met by manufacturers through the creation of reinforced composites and hybrid fastener systems.

Environmental Problems & Recycling Problems

Stricter regulations on plastic waste are pushing the industry to develop sustainable and recyclable fastening solutions. This shift toward using bio-based and recycled materials requires significant investment in research and adaptation within manufacturing processes.

Opportunities

Growth in Electric Vehicles & Light-Weight Automotive Parts

The fast expansion of electric and autonomous cars is driving huge demand for light, non-conductive fasteners that will improve battery efficiency and structural integrity. Advances in thermoplastic composites and high-performance polymers are unlocking new opportunities in automotive fastening.

The need for light, strong, and corrosion-resistant fastening solutions is increasing in different industries. With the increasing growth of smart devices, IoT applications, and wearable electronics, there is a growing demand for small and high-strength fasteners that can improve product design.

Companies also look for sustainable materials, such as bio-based and recycled substitutes, to meet environmental requirements and reduce carbon footprints. Making high-performance, eco-friendly substitutes is poised to drive future industry growth, creating new opportunities for manufacturers, material scientists, and suppliers.

Country-wise Analysis

The USA

The USA is projected to experience steady growth with 9% CAGR as industries adopt lightweight and high-performance fastening solutions to enhance efficiency and sustainability. As the fuel economy and emissions laws get tougher and tougher, manufacturers will replace these done-to-death metal parts with lighter alternatives for more efficient performance.

With the increasing production of smartphones, laptops, and other household appliances, demand for precision fastening solutions with electrical insulation and durability is also on the rise. Corrosion-resistant and quick installation solutions are being driven by the growth of prefabricated and modular construction. The shift towards bio-based and recyclable materials aligns with the corporate and government objective of sustainability and contributes to minimizing environmental footprint.

Country CAGR (2025 to 2035)
United States 9.0%

UK

Different sectors within the United Kingdom including electronics, green building, and automobile production have been continuously flourishing. According to Future Market Insights, country is expected to reflect a CAGR of 9.2% during the forecast period. Government incentives and legislation promoting the use of sustainable products have further fueled the shift to new fastening technologies. The increasing popularity of electric vehicles (EVs) is propelling demand for light-weight components, especially battery enclosures, powertrain systems, and interior fittings.

Government-led smart city projects are promoting the use of non-corrosive and durable fastening solutions in high-tech construction and modular buildings. With Stringent regulations encouraging recyclable materials and eco-friendly construction practices are accelerating the adoption of sustainable alternatives in green building projects. Aerospace and defense growth is escalating demand for high-performance fastening solutions requiring strength, heat resistance, and lightweight.

Country CAGR (2025 to 2035)
United Kingdom 9.2%

China

For several years, China was the engine of rapid industrialization that rapidly triumphed in the expansion of its manufacturing output with strong budgetary support from the government for advancing high-tech industries. The country is projected to grow at 10.5% CAGR in the assessment period. Such market growth would see an increase in the demand for fasteners that are cost-effective, efficient, and lightweight. At its peak is very much in need of plastic fasteners in electric and hybrid vehicles because the automobile manufacturers focus on light weighting with cost performance.

Increasing end-user electronics demand would definitely create opportunities in the market going through a process of rapid precision fastener adoption in smartphones, tablets, and devices for smart homes. The mega projects such as smart cities and high-speed rail networks are increasing the demand for cost-effective and long-lasting fasteners. Government Policies Supporting Plastics Innovation: New material development investments and the promotion of sustainable plastics are keeping alive potential activities in this arena with a greater focus on high-performance polymer fasteners.

Country CAGR (2025 to 2035)
China 10.5%

Japan

Emerging Technologies in Tie and Tie Construction Technology The domain is also associated with miniaturization and miniaturization trends in electronic components and precision manufacturing. Material innovation propels Japan's high demand for specialized fastening solutions, in which the country is an international leader. The demand for these tiny, tough fasteners has increased due to growth in microelectronics, wearables, and ultra-high-performance computing systems that require miniaturized electronic devices.

The automotive and aerospace sectors are adopting lightweight, heat-resistant materials to enhance performance and efficiency. There is a strong industry focus on sustainability, with a growing shift toward biodegradable and recyclable materials in line with Japan’s environmental policies. Japanese companies are at the forefront of developing innovative polymer formulations for high-strength applications.

Country CAGR (2025 to 2035)
Japan 8.8%

South Korea

South Korea is emerging as a key market, fueled by advancements in semiconductor manufacturing, smart devices, and electric vehicles. The country’s industrial landscape is shifting toward high-performance materials. Demand for high-precision plastic fasteners in chip fabrication, circuit board assembly, and cleanroom environments.

Increasing application of lightweight plastic components in battery enclosures, power electronics, and vehicle interiors. Adoption of automated and AI-driven manufacturing is increasing demand for durable fastening solutions. Developments in solar and wind energy installations are increasing the demand for high durability plastic fasteners in energy infrastructures.

Country CAGR (2025 to 2035)
South Korea 9.6%

Market Concentration

The plastic fasteners industry is driven by major manufacturers that specialize in high-performance fastening solutions for diverse applications. Companies like Illinois Tool Works Inc., Nifco Inc., and Stanley Black & Decker Inc. utilize advanced polymer technologies to produce durable, lightweight fasteners. Their expertise in precision molding and material science allows them to supply industries that require high-strength, corrosion-resistant components.

In the automotive sector, lightweight fastening solutions play a crucial role in vehicle assembly by reducing overall weight and improving fuel efficiency. Leading manufacturers design these components to withstand extreme temperatures and mechanical stress while maintaining structural integrity. As the industry transitions toward electric vehicles, the demand for advanced fastening technologies continues to grow, driving further innovation.

The electronics industry depends on non-conductive fastening solutions to prevent short circuits and electrical malfunctions. Manufacturers develop specialized components that securely hold delicate electronic parts while providing insulation from external interference. With rising demand for consumer electronics and high-performance computing devices, precision-engineered fastening solutions are becoming increasingly essential.

In construction, modern fastening systems offer significant advantages over traditional metal alternatives by resisting corrosion, lowering maintenance costs, and simplifying installation. Builders and contractors use these solutions for insulation panels, roofing systems, and modular structures. With a growing focus on sustainable building materials, manufacturers are developing eco-friendly alternatives that align with green construction initiatives and regulatory standards.

Asia-Pacific has emerged as the fastest-growing region for fastening solutions, driven by rapid industrialization and large-scale infrastructure projects. Countries like China and India are increasing production capacity to meet demand across the automotive, electronics, and construction industries. Companies in the region are investing in automation and material innovation to enhance product quality while maintaining cost efficiency in a highly competitive global market.

Competition Outlook

Manufacturers are investing in engineered fastening systems with snap-fit designs, integrated seals, and automated assembly compatibility to align with evolving manufacturing practices. This positions plastic fasteners as a critical enabler of lightweight, high-efficiency design across industries.

  • In March 2024, TR Fastenings introduced a new line of sustainable nylon fasteners, including spacers, washers, screws, nuts, and rivets. These fasteners are made from partially bio-based polymers and are targeted at applications in electronics, automotive, and general manufacturing where lightweight and corrosion-resistant components are essential. The range reflects TR’s focus on sustainable material innovation in fastening solutions.
  • In May 2024, Bossard Group unveiled its next-generation automotive fastening solutions, designed to meet evolving demands in e-mobility and lightweight vehicle assembly. While the announcement emphasized metal components, the portfolio also includes advanced engineered plastic fasteners optimized for modular assembly and material compatibility in EVs. The solutions were showcased as part of Bossard’s Smart Assembly strategy.

Companies

  • Stanley Black & Decker
  • ARaymond
  • Bulte Plastics
  • Bossard Group
  • TR Fastenings (Trifast Group)
  • Nifco
  • Penn Engineering
  • Shamrock International Fasteners
  • Craftech Industries
  • Micro Plastics

Top Segments Studied in the Plastic Fasteners Market

By Product Type:

  • Threaded
    • Nuts & Bolts
    • Screws
    • Washers
    • Studs
    • Inserts
    • Wall Plugs
    • Others
  • Non-Threaded
    • Grommets & Bushings
    • Washers & Spacers
    • Rivets & Push-in Clips
    • Cable Clips & Ties
    • Others

By Material Type:

  • Nylon
  • Polyethylene (PE)
  • Polypropylene (PP)
  • Polyoxymethylene (POM)
  • Polycarbonate (PC)
  • Polyvinyl Chloride (PVC)

By End Use:

  • Automotive
  • Electrical & Electronics
  • Building & Construction
  • Aerospace
  • Packaging
  • Renewable Energy
  • Medical Devices
  • Consumer Goods
  • Other End-Uses

By Region:

  • North America
  • Latin America
  • Eastern Europe
  • Western Europe
  • South Asia & Pacific
  • East Asia
  • Middle East & Africa

Table of Content

  1. Executive Summary
  2. Market Overview
  3. Market Background
  4. Global Market Analysis 2020 to 2024 and Forecast, 2025 to 2035
  5. Global Market Analysis 2020 to 2024 and Forecast 2025 to 2035, By Product Type
    • Threaded
      • Nuts & Bolts
      • Screws
      • Washers
      • Studs
      • Inserts
      • Wall Plugs
      • Others
    • Non-Threaded
      • Grommets & Bushings
      • Washers & Spacers
      • Rivets & Push-in Clips
      • Cable Clips & Ties
      • Others
  6. Global Market Analysis Forecast 2025 to 2035, By Material Type
    • Nylon
    • Polyethylene (PE)
    • Polypropylene (PP)
    • Polyoxymethylene (POM)
    • Polycarbonate (PC)
    • Polyvinyl Chloride (PVC)
  7. Global Market Analysis Forecast 2025 to 2035, By End Use
    • Automotive
    • Electrical & Electronics
    • Building & Construction
    • Aerospace
    • Packaging
    • Renewable Energy
    • Medical Devices
    • Consumer Goods
    • Other End-Uses
  8. Global Market Analysis Forecast 2025 to 2035, By Region
    • North America
    • Latin America
    • Eastern Europe
    • Western Europe
    • South Asia & Pacific
    • East Asia
    • Middle East & Africa
  9. North America Market Analysis 2020 to 2024 and Forecast 2025 to 2035, By Country
  10. Latin America Market Analysis 2020 to 2024 and Forecast 2025 to 2035, By Country
  11. Western Europe Market Analysis 2020 to 2024 and Forecast 2025 to 2035, By Country
  12. Eastern Europe Market Analysis 2020 to 2024 and Forecast 2025 to 2035, By Country
  13. South Asia and Pacific Market Analysis 2020 to 2024 and Forecast 2025 to 2035, By Country
  14. East Asia Market Analysis 2020 to 2024 and Forecast 2025 to 2035, By Country
  15. Middle East and Africa Market Analysis 2020 to 2024 and Forecast 2025 to 2035, By Country
  16. Key Countries Market Analysis
  17. Market Structure Analysis
  18. Competition Analysis
    • Stanley Black & Decker
    • ARaymond
    • Bulte Plastics
    • Bossard Group
    • TR Fastenings (Trifast Group)
    • Nifco
    • Penn Engineering
    • Shamrock International Fasteners
    • Craftech Industries
    • Micro Plastics
  19. Assumptions & Acronyms Used
  20. Research Methodology

List of Tables

  • Table 1: Global Market Value (USD Million/Billion) Forecast by Region, 2020 to 2035
  • Table 2: Global Market Volume (Tons) Forecast by Region, 2020 to 2035
  • Table 3: Global Market Value (USD Million/Billion) Forecast by Product Type, 2020 to 2035
  • Table 4: Global Market Volume (Tons) Forecast by Product Type, 2020 to 2035
  • Table 5: Global Market Value (USD Million/Billion) Forecast by End Use, 2020 to 2035
  • Table 6: Global Market Volume (Tons) Forecast by End Use, 2020 to 2035
  • Table 7: North America Market Value (USD Million/Billion) Forecast by Country, 2020 to 2035
  • Table 8: North America Market Volume (Tons) Forecast by Country, 2020 to 2035
  • Table 9: North America Market Value (USD Million/Billion) Forecast by Product Type, 2020 to 2035
  • Table 10: North America Market Volume (Tons) Forecast by Product Type, 2020 to 2035
  • Table 11: North America Market Value (USD Million/Billion) Forecast by End Use, 2020 to 2035
  • Table 12: North America Market Volume (Tons) Forecast by End Use, 2020 to 2035
  • Table 13: Latin America Market Value (USD Million/Billion) Forecast by Country, 2020 to 2035
  • Table 14: Latin America Market Volume (Tons) Forecast by Country, 2020 to 2035
  • Table 15: Latin America Market Value (USD Million/Billion) Forecast by Product Type, 2020 to 2035
  • Table 16: Latin America Market Volume (Tons) Forecast by Product Type, 2020 to 2035
  • Table 17: Latin America Market Value (USD Million/Billion) Forecast by End Use, 2020 to 2035
  • Table 18: Latin America Market Volume (Tons) Forecast by End Use, 2020 to 2035
  • Table 19: Western Europe Market Value (USD Million/Billion) Forecast by Country, 2020 to 2035
  • Table 20: Western Europe Market Volume (Tons) Forecast by Country, 2020 to 2035
  • Table 21: Western Europe Market Value (USD Million/Billion) Forecast by Product Type, 2020 to 2035
  • Table 22: Western Europe Market Volume (Tons) Forecast by Product Type, 2020 to 2035
  • Table 23: Western Europe Market Value (USD Million/Billion) Forecast by End Use, 2020 to 2035
  • Table 24: Western Europe Market Volume (Tons) Forecast by End Use, 2020 to 2035
  • Table 25: Eastern Europe Market Value (USD Million/Billion) Forecast by Country, 2020 to 2035
  • Table 26: Eastern Europe Market Volume (Tons) Forecast by Country, 2020 to 2035
  • Table 27: Eastern Europe Market Value (USD Million/Billion) Forecast by Product Type, 2020 to 2035
  • Table 28: Eastern Europe Market Volume (Tons) Forecast by Product Type, 2020 to 2035
  • Table 29: Eastern Europe Market Value (USD Million/Billion) Forecast by End Use, 2020 to 2035
  • Table 30: Eastern Europe Market Volume (Tons) Forecast by End Use, 2020 to 2035
  • Table 31: South Asia and Pacific Market Value (USD Million/Billion) Forecast by Country, 2020 to 2035
  • Table 32: South Asia and Pacific Market Volume (Tons) Forecast by Country, 2020 to 2035
  • Table 33: South Asia and Pacific Market Value (USD Million/Billion) Forecast by Product Type, 2020 to 2035
  • Table 34: South Asia and Pacific Market Volume (Tons) Forecast by Product Type, 2020 to 2035
  • Table 35: South Asia and Pacific Market Value (USD Million/Billion) Forecast by End Use, 2020 to 2035
  • Table 36: South Asia and Pacific Market Volume (Tons) Forecast by End Use, 2020 to 2035
  • Table 37: East Asia Market Value (USD Million/Billion) Forecast by Country, 2020 to 2035
  • Table 38: East Asia Market Volume (Tons) Forecast by Country, 2020 to 2035
  • Table 39: East Asia Market Value (USD Million/Billion) Forecast by Product Type, 2020 to 2035
  • Table 40: East Asia Market Volume (Tons) Forecast by Product Type, 2020 to 2035
  • Table 41: East Asia Market Value (USD Million/Billion) Forecast by End Use, 2020 to 2035
  • Table 42: East Asia Market Volume (Tons) Forecast by End Use, 2020 to 2035
  • Table 43: Middle East and Africa Market Value (USD Million/Billion) Forecast by Country, 2020 to 2035
  • Table 44: Middle East and Africa Market Volume (Tons) Forecast by Country, 2020 to 2035
  • Table 45: Middle East and Africa Market Value (USD Million/Billion) Forecast by Product Type, 2020 to 2035
  • Table 46: Middle East and Africa Market Volume (Tons) Forecast by Product Type, 2020 to 2035
  • Table 47: Middle East and Africa Market Value (USD Million/Billion) Forecast by End Use, 2020 to 2035
  • Table 48: Middle East and Africa Market Volume (Tons) Forecast by End Use, 2020 to 2035

List of Figures

  • Figure 1: Global Market Value (USD Million/Billion) by Product Type, 2025 to 2035
  • Figure 2: Global Market Value (USD Million/Billion) by End Use, 2025 to 2035
  • Figure 3: Global Market Value (USD Million/Billion) by Region, 2025 to 2035
  • Figure 4: Global Market Value (USD Million/Billion) Analysis by Region, 2020 to 2035
  • Figure 5: Global Market Volume (Tons) Analysis by Region, 2020 to 2035
  • Figure 6: Global Market Value Share (%) and BPS Analysis by Region, 2025 to 2035
  • Figure 7: Global Market Y-o-Y Growth (%) Projections by Region, 2025 to 2035
  • Figure 8: Global Market Value (USD Million/Billion) Analysis by Product Type, 2020 to 2035
  • Figure 9: Global Market Volume (Tons) Analysis by Product Type, 2020 to 2035
  • Figure 10: Global Market Value Share (%) and BPS Analysis by Product Type, 2025 to 2035
  • Figure 11: Global Market Y-o-Y Growth (%) Projections by Product Type, 2025 to 2035
  • Figure 12: Global Market Value (USD Million/Billion) Analysis by End Use, 2020 to 2035
  • Figure 13: Global Market Volume (Tons) Analysis by End Use, 2020 to 2035
  • Figure 14: Global Market Value Share (%) and BPS Analysis by End Use, 2025 to 2035
  • Figure 15: Global Market Y-o-Y Growth (%) Projections by End Use, 2025 to 2035
  • Figure 16: Global Market Attractiveness by Product Type, 2025 to 2035
  • Figure 17: Global Market Attractiveness by End Use, 2025 to 2035
  • Figure 18: Global Market Attractiveness by Region, 2025 to 2035
  • Figure 19: North America Market Value (USD Million/Billion) by Product Type, 2025 to 2035
  • Figure 20: North America Market Value (USD Million/Billion) by End Use, 2025 to 2035
  • Figure 21: North America Market Value (USD Million/Billion) by Country, 2025 to 2035
  • Figure 22: North America Market Value (USD Million/Billion) Analysis by Country, 2020 to 2035
  • Figure 23: North America Market Volume (Tons) Analysis by Country, 2020 to 2035
  • Figure 24: North America Market Value Share (%) and BPS Analysis by Country, 2025 to 2035
  • Figure 25: North America Market Y-o-Y Growth (%) Projections by Country, 2025 to 2035
  • Figure 26: North America Market Value (USD Million/Billion) Analysis by Product Type, 2020 to 2035
  • Figure 27: North America Market Volume (Tons) Analysis by Product Type, 2020 to 2035
  • Figure 28: North America Market Value Share (%) and BPS Analysis by Product Type, 2025 to 2035
  • Figure 29: North America Market Y-o-Y Growth (%) Projections by Product Type, 2025 to 2035
  • Figure 30: North America Market Value (USD Million/Billion) Analysis by End Use, 2020 to 2035
  • Figure 31: North America Market Volume (Tons) Analysis by End Use, 2020 to 2035
  • Figure 32: North America Market Value Share (%) and BPS Analysis by End Use, 2025 to 2035
  • Figure 33: North America Market Y-o-Y Growth (%) Projections by End Use, 2025 to 2035
  • Figure 34: North America Market Attractiveness by Product Type, 2025 to 2035
  • Figure 35: North America Market Attractiveness by End Use, 2025 to 2035
  • Figure 36: North America Market Attractiveness by Country, 2025 to 2035
  • Figure 37: Latin America Market Value (USD Million/Billion) by Product Type, 2025 to 2035
  • Figure 38: Latin America Market Value (USD Million/Billion) by End Use, 2025 to 2035
  • Figure 39: Latin America Market Value (USD Million/Billion) by Country, 2025 to 2035
  • Figure 40: Latin America Market Value (USD Million/Billion) Analysis by Country, 2020 to 2035
  • Figure 41: Latin America Market Volume (Tons) Analysis by Country, 2020 to 2035
  • Figure 42: Latin America Market Value Share (%) and BPS Analysis by Country, 2025 to 2035
  • Figure 43: Latin America Market Y-o-Y Growth (%) Projections by Country, 2025 to 2035
  • Figure 44: Latin America Market Value (USD Million/Billion) Analysis by Product Type, 2020 to 2035
  • Figure 45: Latin America Market Volume (Tons) Analysis by Product Type, 2020 to 2035
  • Figure 46: Latin America Market Value Share (%) and BPS Analysis by Product Type, 2025 to 2035
  • Figure 47: Latin America Market Y-o-Y Growth (%) Projections by Product Type, 2025 to 2035
  • Figure 48: Latin America Market Value (USD Million/Billion) Analysis by End Use, 2020 to 2035
  • Figure 49: Latin America Market Volume (Tons) Analysis by End Use, 2020 to 2035
  • Figure 50: Latin America Market Value Share (%) and BPS Analysis by End Use, 2025 to 2035
  • Figure 51: Latin America Market Y-o-Y Growth (%) Projections by End Use, 2025 to 2035
  • Figure 52: Latin America Market Attractiveness by Product Type, 2025 to 2035
  • Figure 53: Latin America Market Attractiveness by End Use, 2025 to 2035
  • Figure 54: Latin America Market Attractiveness by Country, 2025 to 2035
  • Figure 55: Western Europe Market Value (USD Million/Billion) by Product Type, 2025 to 2035
  • Figure 56: Western Europe Market Value (USD Million/Billion) by End Use, 2025 to 2035
  • Figure 57: Western Europe Market Value (USD Million/Billion) by Country, 2025 to 2035
  • Figure 58: Western Europe Market Value (USD Million/Billion) Analysis by Country, 2020 to 2035
  • Figure 59: Western Europe Market Volume (Tons) Analysis by Country, 2020 to 2035
  • Figure 60: Western Europe Market Value Share (%) and BPS Analysis by Country, 2025 to 2035
  • Figure 61: Western Europe Market Y-o-Y Growth (%) Projections by Country, 2025 to 2035
  • Figure 62: Western Europe Market Value (USD Million/Billion) Analysis by Product Type, 2020 to 2035
  • Figure 63: Western Europe Market Volume (Tons) Analysis by Product Type, 2020 to 2035
  • Figure 64: Western Europe Market Value Share (%) and BPS Analysis by Product Type, 2025 to 2035
  • Figure 65: Western Europe Market Y-o-Y Growth (%) Projections by Product Type, 2025 to 2035
  • Figure 66: Western Europe Market Value (USD Million/Billion) Analysis by End Use, 2020 to 2035
  • Figure 67: Western Europe Market Volume (Tons) Analysis by End Use, 2020 to 2035
  • Figure 68: Western Europe Market Value Share (%) and BPS Analysis by End Use, 2025 to 2035
  • Figure 69: Western Europe Market Y-o-Y Growth (%) Projections by End Use, 2025 to 2035
  • Figure 70: Western Europe Market Attractiveness by Product Type, 2025 to 2035
  • Figure 71: Western Europe Market Attractiveness by End Use, 2025 to 2035
  • Figure 72: Western Europe Market Attractiveness by Country, 2025 to 2035
  • Figure 73: Eastern Europe Market Value (USD Million/Billion) by Product Type, 2025 to 2035
  • Figure 74: Eastern Europe Market Value (USD Million/Billion) by End Use, 2025 to 2035
  • Figure 75: Eastern Europe Market Value (USD Million/Billion) by Country, 2025 to 2035
  • Figure 76: Eastern Europe Market Value (USD Million/Billion) Analysis by Country, 2020 to 2035
  • Figure 77: Eastern Europe Market Volume (Tons) Analysis by Country, 2020 to 2035
  • Figure 78: Eastern Europe Market Value Share (%) and BPS Analysis by Country, 2025 to 2035
  • Figure 79: Eastern Europe Market Y-o-Y Growth (%) Projections by Country, 2025 to 2035
  • Figure 80: Eastern Europe Market Value (USD Million/Billion) Analysis by Product Type, 2020 to 2035
  • Figure 81: Eastern Europe Market Volume (Tons) Analysis by Product Type, 2020 to 2035
  • Figure 82: Eastern Europe Market Value Share (%) and BPS Analysis by Product Type, 2025 to 2035
  • Figure 83: Eastern Europe Market Y-o-Y Growth (%) Projections by Product Type, 2025 to 2035
  • Figure 84: Eastern Europe Market Value (USD Million/Billion) Analysis by End Use, 2020 to 2035
  • Figure 85: Eastern Europe Market Volume (Tons) Analysis by End Use, 2020 to 2035
  • Figure 86: Eastern Europe Market Value Share (%) and BPS Analysis by End Use, 2025 to 2035
  • Figure 87: Eastern Europe Market Y-o-Y Growth (%) Projections by End Use, 2025 to 2035
  • Figure 88: Eastern Europe Market Attractiveness by Product Type, 2025 to 2035
  • Figure 89: Eastern Europe Market Attractiveness by End Use, 2025 to 2035
  • Figure 90: Eastern Europe Market Attractiveness by Country, 2025 to 2035
  • Figure 91: South Asia and Pacific Market Value (USD Million/Billion) by Product Type, 2025 to 2035
  • Figure 92: South Asia and Pacific Market Value (USD Million/Billion) by End Use, 2025 to 2035
  • Figure 93: South Asia and Pacific Market Value (USD Million/Billion) by Country, 2025 to 2035
  • Figure 94: South Asia and Pacific Market Value (USD Million/Billion) Analysis by Country, 2020 to 2035
  • Figure 95: South Asia and Pacific Market Volume (Tons) Analysis by Country, 2020 to 2035
  • Figure 96: South Asia and Pacific Market Value Share (%) and BPS Analysis by Country, 2025 to 2035
  • Figure 97: South Asia and Pacific Market Y-o-Y Growth (%) Projections by Country, 2025 to 2035
  • Figure 98: South Asia and Pacific Market Value (USD Million/Billion) Analysis by Product Type, 2020 to 2035
  • Figure 99: South Asia and Pacific Market Volume (Tons) Analysis by Product Type, 2020 to 2035
  • Figure 100: South Asia and Pacific Market Value Share (%) and BPS Analysis by Product Type, 2025 to 2035
  • Figure 101: South Asia and Pacific Market Y-o-Y Growth (%) Projections by Product Type, 2025 to 2035
  • Figure 102: South Asia and Pacific Market Value (USD Million/Billion) Analysis by End Use, 2020 to 2035
  • Figure 103: South Asia and Pacific Market Volume (Tons) Analysis by End Use, 2020 to 2035
  • Figure 104: South Asia and Pacific Market Value Share (%) and BPS Analysis by End Use, 2025 to 2035
  • Figure 105: South Asia and Pacific Market Y-o-Y Growth (%) Projections by End Use, 2025 to 2035
  • Figure 106: South Asia and Pacific Market Attractiveness by Product Type, 2025 to 2035
  • Figure 107: South Asia and Pacific Market Attractiveness by End Use, 2025 to 2035
  • Figure 108: South Asia and Pacific Market Attractiveness by Country, 2025 to 2035
  • Figure 109: East Asia Market Value (USD Million/Billion) by Product Type, 2025 to 2035
  • Figure 110: East Asia Market Value (USD Million/Billion) by End Use, 2025 to 2035
  • Figure 111: East Asia Market Value (USD Million/Billion) by Country, 2025 to 2035
  • Figure 112: East Asia Market Value (USD Million/Billion) Analysis by Country, 2020 to 2035
  • Figure 113: East Asia Market Volume (Tons) Analysis by Country, 2020 to 2035
  • Figure 114: East Asia Market Value Share (%) and BPS Analysis by Country, 2025 to 2035
  • Figure 115: East Asia Market Y-o-Y Growth (%) Projections by Country, 2025 to 2035
  • Figure 116: East Asia Market Value (USD Million/Billion) Analysis by Product Type, 2020 to 2035
  • Figure 117: East Asia Market Volume (Tons) Analysis by Product Type, 2020 to 2035
  • Figure 118: East Asia Market Value Share (%) and BPS Analysis by Product Type, 2025 to 2035
  • Figure 119: East Asia Market Y-o-Y Growth (%) Projections by Product Type, 2025 to 2035
  • Figure 120: East Asia Market Value (USD Million/Billion) Analysis by End Use, 2020 to 2035
  • Figure 121: East Asia Market Volume (Tons) Analysis by End Use, 2020 to 2035
  • Figure 122: East Asia Market Value Share (%) and BPS Analysis by End Use, 2025 to 2035
  • Figure 123: East Asia Market Y-o-Y Growth (%) Projections by End Use, 2025 to 2035
  • Figure 124: East Asia Market Attractiveness by Product Type, 2025 to 2035
  • Figure 125: East Asia Market Attractiveness by End Use, 2025 to 2035
  • Figure 126: East Asia Market Attractiveness by Country, 2025 to 2035
  • Figure 127: Middle East and Africa Market Value (USD Million/Billion) by Product Type, 2025 to 2035
  • Figure 128: Middle East and Africa Market Value (USD Million/Billion) by End Use, 2025 to 2035
  • Figure 129: Middle East and Africa Market Value (USD Million/Billion) by Country, 2025 to 2035
  • Figure 130: Middle East and Africa Market Value (USD Million/Billion) Analysis by Country, 2020 to 2035
  • Figure 131: Middle East and Africa Market Volume (Tons) Analysis by Country, 2020 to 2035
  • Figure 132: Middle East and Africa Market Value Share (%) and BPS Analysis by Country, 2025 to 2035
  • Figure 133: Middle East and Africa Market Y-o-Y Growth (%) Projections by Country, 2025 to 2035
  • Figure 134: Middle East and Africa Market Value (USD Million/Billion) Analysis by Product Type, 2020 to 2035
  • Figure 135: Middle East and Africa Market Volume (Tons) Analysis by Product Type, 2020 to 2035
  • Figure 136: Middle East and Africa Market Value Share (%) and BPS Analysis by Product Type, 2025 to 2035
  • Figure 137: Middle East and Africa Market Y-o-Y Growth (%) Projections by Product Type, 2025 to 2035
  • Figure 138: Middle East and Africa Market Value (USD Million/Billion) Analysis by End Use, 2020 to 2035
  • Figure 139: Middle East and Africa Market Volume (Tons) Analysis by End Use, 2020 to 2035
  • Figure 140: Middle East and Africa Market Value Share (%) and BPS Analysis by End Use, 2025 to 2035
  • Figure 141: Middle East and Africa Market Y-o-Y Growth (%) Projections by End Use, 2025 to 2035
  • Figure 142: Middle East and Africa Market Attractiveness by Product Type, 2025 to 2035
  • Figure 143: Middle East and Africa Market Attractiveness by End Use, 2025 to 2035
  • Figure 144: Middle East and Africa Market Attractiveness by Country, 2025 to 2035

Frequently Asked Questions

How big is the plastic fasteners market?

The plastic fasteners market is projected to grow from USD 7,413.0 million in 2025 to USD 18,880.7 million by 2035.

What is the outlook on plastic fasteners product sales?

The market is expected to grow at a CAGR of 9.8% from 2025 to 2035, driven by rising demand in automotive, electronics, and construction industries.

Who are the major plastic fasteners manufacturers?

Anil Plastics & Enterprises, Araymond, Arconic, Bossard Group, Bulte Plastics, Canco Fasteners, Craftech Industries, E & T Fasteners, Fontana Gruppo, Illinois Tool Works, Joxco Seals, KGS Kitagawa Industries Co., Micro Plastics, MW Industries, Nifco, Nyltite Corporation, Penn Engineering, Shamrock International Fasteners, Shanghai Yuanmao Fastener Co., and Stanley Black & Decker are the major manufacturers in the industry.

Which region is likely to create lucrative opportunities for plastic fasteners market players?

Asia-Pacific, particularly China and India, is expected to offer the most lucrative growth opportunities due to rapid industrialization and expanding manufacturing sectors.

Explore Similar Insights

Future Market Insights

Plastic Fasteners Market