Reports

- Global Locations -

Headquarters

Future Market Insights, Inc.

Christiana Corporate, 200
Continental Drive, Suite 401,
Newark, Delaware - 19713,
United States

T: +1-845-579-5705

Americas

Future Market Insights, Inc.

616 Corporate Way, Suite 2-9018,
Valley Cottage, NY 10989, United States

T: +1-347-918-3531

MEA

Future Market Insights

1602-6 Jumeirah Bay X2 Tower, Plot No: JLT-PH2-X2A,
Jumeirah Lakes Towers, Dubai,
United Arab Emirates

Europe

Future Market Insights

3rd Floor, 207 Regent Street,
W1B 3HH London
United Kingdom

T: + 44 (0) 20 8123 9659
D: +44 (0) 20 3287 4268

Asia Pacific

Future Market Insights

IndiaLand Global Tech Park, Unit UG-1, Behind Grand HighStreet, Phase 1, Hinjawadi, MH, Pune – 411057, India

Plastic Transistors Market Outlook (2022-2032)

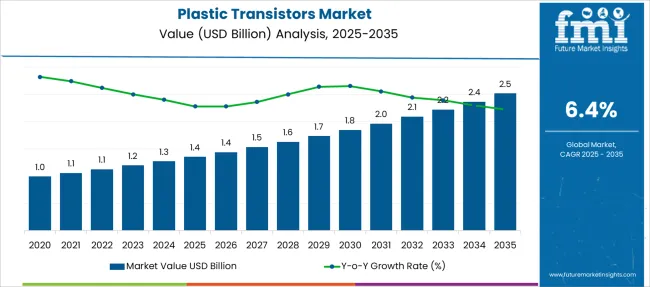
[340 Pages Report] The plastic transistors market, which is valued at US$ 1123 million as on 2022, is anticipated to be valued at US$ 2087 million by 2032 and is expected to grow at a CAGR of 6.4% during the forecast period.

Boom in the electronic industry and many other factors are anticipated to increase the demand for plastic transistors in the coming years.

Report Attribute Details
Plastic Transistors Market Valuation as on 2022 US$ 1123 million
Plastic Transistors Market Anticipated Forecast Value (2032) US$ 2087 million
Plastic Transistors Market Projected Growth Rate (2022 to 2032) 6.4%

Apart from amplification of signals, transistors also assist in rectification of signals. Because of both the benefits offered by them, it is anticipated that the adoption of plastic transistors will increase during the forecast period.

Moreover, scientists are trying to develop applications and circuits wherein the scope of the usage of these plastic transistors would broaden.

Previously, the CAGR for the plastic transistors 5.4%. But, with the increased usage and with gaining popularity across sectors, the anticipated CAGR during the forecast period (2022-2032) is 6.4%.

Don't pay for what you don't need

Customize your report by selecting specific countries or regions and save 30%!

What are the Current Market Dynamics pertaining to Plastic Transistors Market?

The demand for plastic transistors is driven by the fact that they utilise low current, as a result of which they reduce unnecessary power dissipation. Moreover, the sales of plastic transistors can also surge because by using these transistors, the efficiency of the entire circuit increases, and the system can handle complex capabilities seamlessly.

The adoption of plastic transistors is expected to increase as they operate at a much higher efficiency as compared to transistors made of organic materials, and because of this very purpose, these transistors are essentially used in circuits. These transistors can offer higher frequency capabilities as compared to bipolar transistors, which is expected to surge the demand for plastic transistors in the coming years.

The plastic transistors market share is expected to surge during the forecast period because they assist in flexible displays as well, which make them extremely popular amongst manufacturers and scientists. Apart from that, the usage of plastic to manufacture plastic transistors makes the entire process cost efficient. This is expected to further increase the adoption of plastic transistors.

In almost all the developing and developed countries across the world, there is a wave of digitalisation which is happening, and this is applied in all the sectors like mechatronics, robotics, electronics, Artificial Intelligence etc. This is expected to increase the sales of plastic transistors.

All this digitalisation is possible only because of the advancements in technology. Doesn’t matter whether it is the digital aspect or the technological aspect, the plastic transistors are put into usage in either case. This as well is expected to increase the plastic transistors market size.

However, the professionals need to take utmost care while placing the plastic transistors in the circuit board because if these are not moulded precisely, it would lead to improper display as the pixels will not be arranged effectively.

Additionally, to protect the plastic transistors certain kinds of coating has to be applied, and these have limited presence in the market. The presence of skilled professionals is limited in this niche. So, looking for a professional who can handle the activities efficiently also remains a challenge.

Moreover, improper doping can lead to ‘short channel effect’, which would make the entire transistor not worth using. The manufacturers need to certainly work on some of the points in order to ensure that the sales of plastic transistors further increase.
Regional Analysis

How is the Performance of North American Plastic Transistors Market?

North America, which currently has a market share of 32.2%, is one of the largest markets for plastic transistors, and during the forecast period as well, the region is expected to witness a surge in the market share.

With sectors like Artificial Intelligence, Electronics etc growing by leaps and bounds in the region, and people as well willing to invest for such technologies makes North America one of the hottest markets for plastic transistors.
How is the Performance of European Plastic Transistors Market?

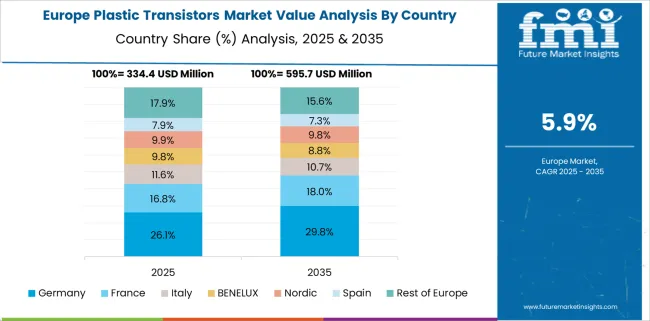
Europe, which currently has a market share of 23.6%, is expected to show significant growth during the forecast period.

Apart from being used across sectors, the manufacturers in this region are looking for ways to achieve cost cutting. The plastic transistors help them achieve that, as the power consumption is less as compared to organic transistors.
Sudip Saha
Sudip Saha

Principal Consultant

Talk to Analyst

Find your sweet spots for generating winning opportunities in this market.

How is the Start Up Ecosystem in the Plastic Transistors Market?

With surge in the electronic industry, technological developments, and many other things happening worldwide, the start up ecosystem in the plastic transistors market is active, making the possible innovations to ensure human life becomes much easier.

Some of the notable start ups are: Ayar Labs, Lightmatter, and PsiQuantum.

The aim of these start ups is to shrink the size of plastic transistors further. This is done to ensure that the computation speed further increases, and the flow of signals within the circuit remains uninterrupted and continuous.

Apart from the size, these start ups are also working on reducing the cost of the transistors, thereby making the entire process simple yet effective.

Report Scope

Report Attribute Details
Growth Rate CAGR of 6.4% from 2022 to 2032
Base Year for Estimation 2021
Historical Data 2014 to 2020
Forecast Period 2022 to 2032
Quantitative Units Revenue in USD Million and CAGR from 2022 to 2032
Report Coverage Revenue Forecast, Volume Forecast, Company Ranking, Competitive Landscape, Growth Factors, Trends and Pricing Analysis
Segments Covered
  • Type
  • Application
  • Region
Regions Covered
  • North America
  • Latin America
  • Europe
  • East Asia
  • South Asia
  • Oceania
  • Middle East and Africa
Key Countries Profiled
  • USA
  • Canada
  • Brazil
  • Argentina
  • Germany
  • UK
  • France
  • Spain
  • Italy
  • Nordics
  • BENELUX
  • Australia & New Zealand
  • China
  • India
  • ASEAN
  • GCC
  • South Africa
Key Companies Profiled
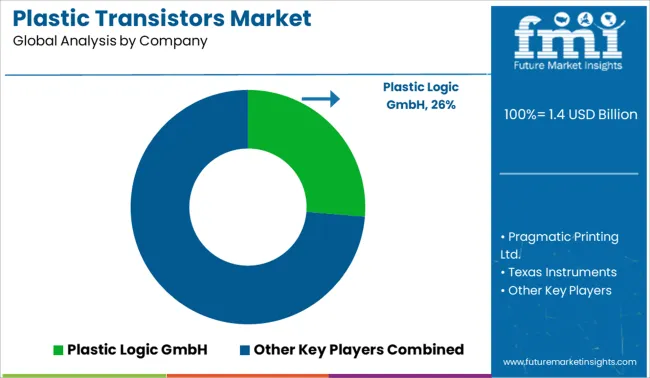
  • Plastic Logic GmbH
  • Pragmatic Printing Ltd.
  • Texas Instruments
  • Qorvo, Inc.
  • NXP Semiconductors
  • Microchip Technology.
Customization Available Upon Request

Get the data you need at a Fraction of the cost

Personalize your report by choosing insights you need
and save 40%!

Key Segments Profiled in the Plastic Transistors Market Survey

By Type:

  • 3-alkythiophene semiconducting layer
  • Polyimide dielectric layer
  • Two silver electrodes

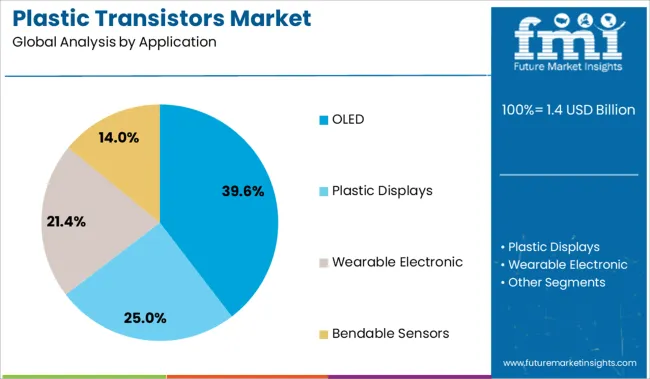
By Application:

  • Plastic Displays
  • Bendable Sensors
  • OLED
  • Wearable Electronics

By Region:

  • North America
  • Latin America
  • Europe
  • East Asia
  • South Asia
  • Oceania
  • Middle East and Africa

Frequently Asked Questions

What is the Growth Outlook for the Plastic Transistors Market?

The plastic transistors market is projected to grow at a CAGR of 6.4% during the forecast period (2022-2032).

What is the Valuation of Plastic Transistors Market as on 2022?

The plastic transistors market has a valuation of US$ 1123 million as on 2022.

What is the Expected Valuation of Plastic Transistors Market in 2032?

The plastic transistors market is expected to be valued US$ 2087 million in 2032.

Table of Content

1. Executive Summary

    1.1. Global Market Outlook

    1.2. Demand-side Trends

    1.3. Supply-side Trends

    1.4. Technology Roadmap Analysis

    1.5. Analysis and Recommendations

2. Market Overview

    2.1. Market Coverage / Taxonomy

    2.2. Market Definition / Scope / Limitations

3. Market Background

    3.1. Market Dynamics

        3.1.1. Drivers

        3.1.2. Restraints

        3.1.3. Opportunity

        3.1.4. Trends

    3.2. Scenario Forecast

        3.2.1. Demand in Optimistic Scenario

        3.2.2. Demand in Likely Scenario

        3.2.3. Demand in Conservative Scenario

    3.3. Opportunity Map Analysis

    3.4. Product Life Cycle Analysis

    3.5. Investment Feasibility Matrix

    3.6. PESTLE and Porter’s Analysis

    3.7. Regulatory Landscape

        3.7.1. By Key Regions

        3.7.2. By Key Countries

    3.8. Regional Parent Market Outlook

4. Global Plastic Transistors Market Analysis 2017-2021 and Forecast, 2022-2032

    4.1. Historical Market Size Value (US$ Mn) Analysis, 2017-2021

    4.2. Current and Future Market Size Value (US$ Mn) Projections, 2022-2032

        4.2.1. Y-o-Y Growth Trend Analysis

        4.2.2. Absolute $ Opportunity Analysis

5. Global Plastic Transistors Market Analysis 2017-2021 and Forecast 2022-2032, By Application

    5.1. Introduction / Key Findings

    5.2. Historical Market Size Value (US$ Mn) Analysis By Application, 2017-2021

    5.3. Current and Future Market Size Value (US$ Mn) Analysis and Forecast By Application, 2022-2032

        5.3.1. OLED

        5.3.2. Plastic Displays

        5.3.3. Wearable Electronic

        5.3.4. Bendable Sensors

    5.4. Y-o-Y Growth Trend Analysis By Application, 2017-2021

    5.5. Absolute $ Opportunity Analysis By Application, 2022-2032

6. Global Plastic Transistors Market Analysis 2017-2021 and Forecast 2022-2032, By Region

    6.1. Introduction

    6.2. Historical Market Size Value (US$ Mn) Analysis By Region, 2017-2021

    6.3. Current Market Size Value (US$ Mn) Analysis and Forecast By Region, 2022-2032

        6.3.1. North America

        6.3.2. Latin America

        6.3.3. Europe

        6.3.4. Asia Pacific

        6.3.5. Middle East and Africa

    6.4. Market Attractiveness Analysis By Region

7. North America Plastic Transistors Market Analysis 2017-2021 and Forecast 2022-2032, By Country

    7.1. Historical Market Size Value (US$ Mn) Trend Analysis By Market Taxonomy, 2017-2021

    7.2. Market Size Value (US$ Mn) Forecast By Market Taxonomy, 2022-2032

        7.2.1. By Country

            7.2.1.1. U.S.

            7.2.1.2. Canada

        7.2.2. By Application

    7.3. Market Attractiveness Analysis

        7.3.1. By Country

        7.3.2. By Application

    7.4. Key Takeaways

8. Latin America Plastic Transistors Market Analysis 2017-2021 and Forecast 2022-2032, By Country

    8.1. Historical Market Size Value (US$ Mn) Trend Analysis By Market Taxonomy, 2017-2021

    8.2. Market Size Value (US$ Mn) Forecast By Market Taxonomy, 2022-2032

        8.2.1. By Country

            8.2.1.1. Brazil

            8.2.1.2. Mexico

            8.2.1.3. Rest of Latin America

        8.2.2. By Application

    8.3. Market Attractiveness Analysis

        8.3.1. By Country

        8.3.2. By Application

    8.4. Key Takeaways

9. Europe Plastic Transistors Market Analysis 2017-2021 and Forecast 2022-2032, By Country

    9.1. Historical Market Size Value (US$ Mn) Trend Analysis By Market Taxonomy, 2017-2021

    9.2. Market Size Value (US$ Mn) Forecast By Market Taxonomy, 2022-2032

        9.2.1. By Country

            9.2.1.1. Germany

            9.2.1.2. U.K.

            9.2.1.3. France

            9.2.1.4. Spain

            9.2.1.5. Italy

            9.2.1.6. Russia

            9.2.1.7. Rest of Europe

        9.2.2. By Application

    9.3. Market Attractiveness Analysis

        9.3.1. By Country

        9.3.2. By Application

    9.4. Key Takeaways

10. Asia Pacific Plastic Transistors Market Analysis 2017-2021 and Forecast 2022-2032, By Country

    10.1. Historical Market Size Value (US$ Mn) Trend Analysis By Market Taxonomy, 2017-2021

    10.2. Market Size Value (US$ Mn) Forecast By Market Taxonomy, 2022-2032

        10.2.1. By Country

            10.2.1.1. China

            10.2.1.2. Japan

            10.2.1.3. India

            10.2.1.4. South Korea

            10.2.1.5. Australia

            10.2.1.6. Rest of APAC

        10.2.2. By Application

    10.3. Market Attractiveness Analysis

        10.3.1. By Country

        10.3.2. By Application

    10.4. Key Takeaways

11. Middle East and Africa Plastic Transistors Market Analysis 2017-2021 and Forecast 2022-2032, By Country

    11.1. Historical Market Size Value (US$ Mn) Trend Analysis By Market Taxonomy, 2017-2021

    11.2. Market Size Value (US$ Mn) Forecast By Market Taxonomy, 2022-2032

        11.2.1. By Country

            11.2.1.1. South Africa

            11.2.1.2. Saudi Arabia

            11.2.1.3. UAE

            11.2.1.4. Israel

            11.2.1.5. Rest of MEA

        11.2.2. By Application

    11.3. Market Attractiveness Analysis

        11.3.1. By Country

        11.3.2. By Application

    11.4. Key Takeaways

12. Key Countries Plastic Transistors Market Analysis

    12.1. U.S.

        12.1.1. Pricing Analysis

        12.1.2. Market Share Analysis, 2021

            12.1.2.1. By Application

    12.2. Canada

        12.2.1. Pricing Analysis

        12.2.2. Market Share Analysis, 2021

            12.2.2.1. By Application

    12.3. Brazil

        12.3.1. Pricing Analysis

        12.3.2. Market Share Analysis, 2021

            12.3.2.1. By Application

    12.4. Mexico

        12.4.1. Pricing Analysis

        12.4.2. Market Share Analysis, 2021

            12.4.2.1. By Application

    12.5. Germany

        12.5.1. Pricing Analysis

        12.5.2. Market Share Analysis, 2021

            12.5.2.1. By Application

    12.6. U.K.

        12.6.1. Pricing Analysis

        12.6.2. Market Share Analysis, 2021

            12.6.2.1. By Application

    12.7. France

        12.7.1. Pricing Analysis

        12.7.2. Market Share Analysis, 2021

            12.7.2.1. By Application

    12.8. Spain

        12.8.1. Pricing Analysis

        12.8.2. Market Share Analysis, 2021

            12.8.2.1. By Application

    12.9. Italy

        12.9.1. Pricing Analysis

        12.9.2. Market Share Analysis, 2021

            12.9.2.1. By Application

    12.10. Russia

        12.10.1. Pricing Analysis

        12.10.2. Market Share Analysis, 2021

            12.10.2.1. By Application

    12.11. China

        12.11.1. Pricing Analysis

        12.11.2. Market Share Analysis, 2021

            12.11.2.1. By Application

    12.12. Japan

        12.12.1. Pricing Analysis

        12.12.2. Market Share Analysis, 2021

            12.12.2.1. By Application

    12.13. India

        12.13.1. Pricing Analysis

        12.13.2. Market Share Analysis, 2021

            12.13.2.1. By Application

    12.14. South Korea

        12.14.1. Pricing Analysis

        12.14.2. Market Share Analysis, 2021

            12.14.2.1. By Application

    12.15. Australia

        12.15.1. Pricing Analysis

        12.15.2. Market Share Analysis, 2021

            12.15.2.1. By Application

    12.16. South Africa

        12.16.1. Pricing Analysis

        12.16.2. Market Share Analysis, 2021

            12.16.2.1. By Application

    12.17. Saudi Arabia

        12.17.1. Pricing Analysis

        12.17.2. Market Share Analysis, 2021

            12.17.2.1. By Application

    12.18. UAE

        12.18.1. Pricing Analysis

        12.18.2. Market Share Analysis, 2021

            12.18.2.1. By Application

    12.19. Israel

        12.19.1. Pricing Analysis

        12.19.2. Market Share Analysis, 2021

            12.19.2.1. By Application

13. Market Structure Analysis

    13.1. Competition Dashboard

    13.2. Competition Benchmarking

    13.3. Market Share Analysis of Top Players

        13.3.1. By Regional

        13.3.2. By Application

14. Competition Analysis

    14.1. Competition Deep Dive

        14.1.1. Plastic Logic GmbH

            14.1.1.1. Overview

            14.1.1.2. Product Portfolio

            14.1.1.3. Profitability by Market Segments

            14.1.1.4. Sales Footprint

            14.1.1.5. Strategy Overview

                14.1.1.5.1. Marketing Strategy

        14.1.2. Pragmatic Printing Ltd.

            14.1.2.1. Overview

            14.1.2.2. Product Portfolio

            14.1.2.3. Profitability by Market Segments

            14.1.2.4. Sales Footprint

            14.1.2.5. Strategy Overview

                14.1.2.5.1. Marketing Strategy

        14.1.3. Texas Instruments

            14.1.3.1. Overview

            14.1.3.2. Product Portfolio

            14.1.3.3. Profitability by Market Segments

            14.1.3.4. Sales Footprint

            14.1.3.5. Strategy Overview

                14.1.3.5.1. Marketing Strategy

        14.1.4. Qorvo, Inc.

            14.1.4.1. Overview

            14.1.4.2. Product Portfolio

            14.1.4.3. Profitability by Market Segments

            14.1.4.4. Sales Footprint

            14.1.4.5. Strategy Overview

                14.1.4.5.1. Marketing Strategy

        14.1.5. NXP Semiconductors

            14.1.5.1. Overview

            14.1.5.2. Product Portfolio

            14.1.5.3. Profitability by Market Segments

            14.1.5.4. Sales Footprint

            14.1.5.5. Strategy Overview

                14.1.5.5.1. Marketing Strategy

        14.1.6. Microchip Technology

            14.1.6.1. Overview

            14.1.6.2. Product Portfolio

            14.1.6.3. Profitability by Market Segments

            14.1.6.4. Sales Footprint

            14.1.6.5. Strategy Overview

                14.1.6.5.1. Marketing Strategy

15. Assumptions & Acronyms Used

16. Research Methodology

List of Tables

Table 1: Global Plastic Transistors Market Value (US$ Mn) Forecast by Region, 2017-2032

Table 2: Global Plastic Transistors Market Value (US$ Mn) Forecast by Application, 2017-2032

Table 3: North America Plastic Transistors Market Value (US$ Mn) Forecast by Country, 2017-2032

Table 4: North America Plastic Transistors Market Value (US$ Mn) Forecast by Application, 2017-2032

Table 5: Latin America Plastic Transistors Market Value (US$ Mn) Forecast by Country, 2017-2032

Table 6: Latin America Plastic Transistors Market Value (US$ Mn) Forecast by Application, 2017-2032

Table 7: Europe Plastic Transistors Market Value (US$ Mn) Forecast by Country, 2017-2032

Table 8: Europe Plastic Transistors Market Value (US$ Mn) Forecast by Application, 2017-2032

Table 9: Asia Pacific Plastic Transistors Market Value (US$ Mn) Forecast by Country, 2017-2032

Table 10: Asia Pacific Plastic Transistors Market Value (US$ Mn) Forecast by Application, 2017-2032

Table 11: Middle East and Africa Plastic Transistors Market Value (US$ Mn) Forecast by Country, 2017-2032

Table 12: Middle East and Africa Plastic Transistors Market Value (US$ Mn) Forecast by Application, 2017-2032

List of Charts

Figure 1: Global Plastic Transistors Market Value (US$ Mn) by Application, 2022-2032

Figure 2: Global Plastic Transistors Market Value (US$ Mn) by Region, 2022-2032

Figure 3: Global Plastic Transistors Market Value (US$ Mn) Analysis by Region, 2017-2032

Figure 4: Global Plastic Transistors Market Value Share (%) and BPS Analysis by Region, 2022-2032

Figure 5: Global Plastic Transistors Market Y-o-Y Growth (%) Projections by Region, 2022-2032

Figure 6: Global Plastic Transistors Market Value (US$ Mn) Analysis by Application, 2017-2032

Figure 7: Global Plastic Transistors Market Value Share (%) and BPS Analysis by Application, 2022-2032

Figure 8: Global Plastic Transistors Market Y-o-Y Growth (%) Projections by Application, 2022-2032

Figure 9: Global Plastic Transistors Market Attractiveness by Application, 2022-2032

Figure 10: Global Plastic Transistors Market Attractiveness by Region, 2022-2032

Figure 11: North America Plastic Transistors Market Value (US$ Mn) by Application, 2022-2032

Figure 12: North America Plastic Transistors Market Value (US$ Mn) by Country, 2022-2032

Figure 13: North America Plastic Transistors Market Value (US$ Mn) Analysis by Country, 2017-2032

Figure 14: North America Plastic Transistors Market Value Share (%) and BPS Analysis by Country, 2022-2032

Figure 15: North America Plastic Transistors Market Y-o-Y Growth (%) Projections by Country, 2022-2032

Figure 16: North America Plastic Transistors Market Value (US$ Mn) Analysis by Application, 2017-2032

Figure 17: North America Plastic Transistors Market Value Share (%) and BPS Analysis by Application, 2022-2032

Figure 18: North America Plastic Transistors Market Y-o-Y Growth (%) Projections by Application, 2022-2032

Figure 19: North America Plastic Transistors Market Attractiveness by Application, 2022-2032

Figure 20: North America Plastic Transistors Market Attractiveness by Country, 2022-2032

Figure 21: Latin America Plastic Transistors Market Value (US$ Mn) by Application, 2022-2032

Figure 22: Latin America Plastic Transistors Market Value (US$ Mn) by Country, 2022-2032

Figure 23: Latin America Plastic Transistors Market Value (US$ Mn) Analysis by Country, 2017-2032

Figure 24: Latin America Plastic Transistors Market Value Share (%) and BPS Analysis by Country, 2022-2032

Figure 25: Latin America Plastic Transistors Market Y-o-Y Growth (%) Projections by Country, 2022-2032

Figure 26: Latin America Plastic Transistors Market Value (US$ Mn) Analysis by Application, 2017-2032

Figure 27: Latin America Plastic Transistors Market Value Share (%) and BPS Analysis by Application, 2022-2032

Figure 28: Latin America Plastic Transistors Market Y-o-Y Growth (%) Projections by Application, 2022-2032

Figure 29: Latin America Plastic Transistors Market Attractiveness by Application, 2022-2032

Figure 30: Latin America Plastic Transistors Market Attractiveness by Country, 2022-2032

Figure 31: Europe Plastic Transistors Market Value (US$ Mn) by Application, 2022-2032

Figure 32: Europe Plastic Transistors Market Value (US$ Mn) by Country, 2022-2032

Figure 33: Europe Plastic Transistors Market Value (US$ Mn) Analysis by Country, 2017-2032

Figure 34: Europe Plastic Transistors Market Value Share (%) and BPS Analysis by Country, 2022-2032

Figure 35: Europe Plastic Transistors Market Y-o-Y Growth (%) Projections by Country, 2022-2032

Figure 36: Europe Plastic Transistors Market Value (US$ Mn) Analysis by Application, 2017-2032

Figure 37: Europe Plastic Transistors Market Value Share (%) and BPS Analysis by Application, 2022-2032

Figure 38: Europe Plastic Transistors Market Y-o-Y Growth (%) Projections by Application, 2022-2032

Figure 39: Europe Plastic Transistors Market Attractiveness by Application, 2022-2032

Figure 40: Europe Plastic Transistors Market Attractiveness by Country, 2022-2032

Figure 41: Asia Pacific Plastic Transistors Market Value (US$ Mn) by Application, 2022-2032

Figure 42: Asia Pacific Plastic Transistors Market Value (US$ Mn) by Country, 2022-2032

Figure 43: Asia Pacific Plastic Transistors Market Value (US$ Mn) Analysis by Country, 2017-2032

Figure 44: Asia Pacific Plastic Transistors Market Value Share (%) and BPS Analysis by Country, 2022-2032

Figure 45: Asia Pacific Plastic Transistors Market Y-o-Y Growth (%) Projections by Country, 2022-2032

Figure 46: Asia Pacific Plastic Transistors Market Value (US$ Mn) Analysis by Application, 2017-2032

Figure 47: Asia Pacific Plastic Transistors Market Value Share (%) and BPS Analysis by Application, 2022-2032

Figure 48: Asia Pacific Plastic Transistors Market Y-o-Y Growth (%) Projections by Application, 2022-2032

Figure 49: Asia Pacific Plastic Transistors Market Attractiveness by Application, 2022-2032

Figure 50: Asia Pacific Plastic Transistors Market Attractiveness by Country, 2022-2032

Figure 51: Middle East and Africa Plastic Transistors Market Value (US$ Mn) by Application, 2022-2032

Figure 52: Middle East and Africa Plastic Transistors Market Value (US$ Mn) by Country, 2022-2032

Figure 53: Middle East and Africa Plastic Transistors Market Value (US$ Mn) Analysis by Country, 2017-2032

Figure 54: Middle East and Africa Plastic Transistors Market Value Share (%) and BPS Analysis by Country, 2022-2032

Figure 55: Middle East and Africa Plastic Transistors Market Y-o-Y Growth (%) Projections by Country, 2022-2032

Figure 56: Middle East and Africa Plastic Transistors Market Value (US$ Mn) Analysis by Application, 2017-2032

Figure 57: Middle East and Africa Plastic Transistors Market Value Share (%) and BPS Analysis by Application, 2022-2032

Figure 58: Middle East and Africa Plastic Transistors Market Y-o-Y Growth (%) Projections by Application, 2022-2032

Figure 59: Middle East and Africa Plastic Transistors Market Attractiveness by Application, 2022-2032

Figure 60: Middle East and Africa Plastic Transistors Market Attractiveness by Country, 2022-2032

Recommendations

Technology

Fin Field Effect Transistor (FinFET) Market

Published : October 2022

Technology

Single Electron Transistor Market

Published : July 2022

Explore Technology Insights

View Reports

Plastic Transistors Market