The Plastic Vial market is experiencing significant growth driven by the rising demand for safe, durable, and lightweight packaging solutions across the healthcare and pharmaceutical industries. The future outlook for this market is shaped by increasing global requirements for injectable drugs, vaccines, and laboratory samples, which necessitate reliable and contamination-free storage. Advancements in polymer technology have improved the chemical resistance, clarity, and stability of plastic vials, enhancing their suitability for sensitive applications.
Additionally, the growing focus on single-use vials to prevent cross-contamination and maintain product integrity is fueling market adoption. The shift from glass to plastic vials is further supported by their reduced breakage risk, lighter weight, and ease of transportation, which lower overall operational costs.
Increasing investments in healthcare infrastructure, research, and laboratory facilities, particularly in emerging economies, are driving the adoption of advanced vial materials and designs As pharmaceutical and diagnostic applications expand globally, plastic vials are expected to remain a preferred choice due to their safety, versatility, and cost-effectiveness.
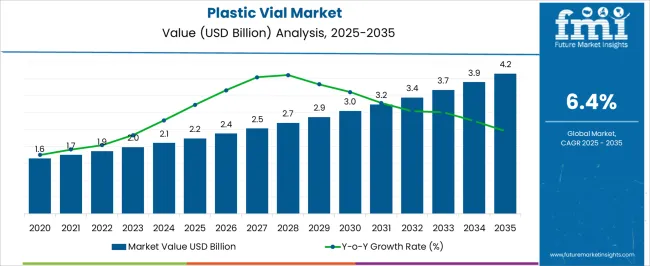
| Metric | Value |
|---|---|
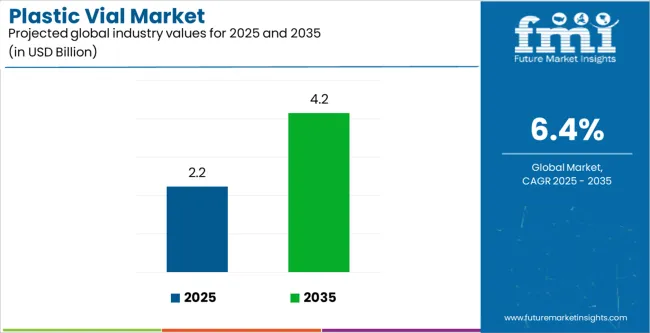
| Plastic Vial Market Estimated Value in (2025 E) | USD 2.2 billion |
| Plastic Vial Market Forecast Value in (2035 F) | USD 4.2 billion |
| Forecast CAGR (2025 to 2035) | 6.4% |
The market is segmented by Material, Capacity, and End Use and region. By Material, the market is divided into COC/COP, Polyethylene, Polypropylene, Polycarbonate, Polyvinyl Chloride (PVC), and Polystyrene. In terms of Capacity, the market is classified into Up To 2 Ml, 3 Ml To 5 Ml, 5 Ml To 7 Ml, and 8 Ml & Above. Based on End Use, the market is segmented into Healthcare, Research Laboratories, Drug Manufacturers, Hospitals And Clinical Research, Personal Care & Cosmetics, Chemical Industry, and Homecare Products. Regionally, the market is classified into North America, Latin America, Western Europe, Eastern Europe, Balkan & Baltic Countries, Russia & Belarus, Central Asia, East Asia, South Asia & Pacific, and the Middle East & Africa.
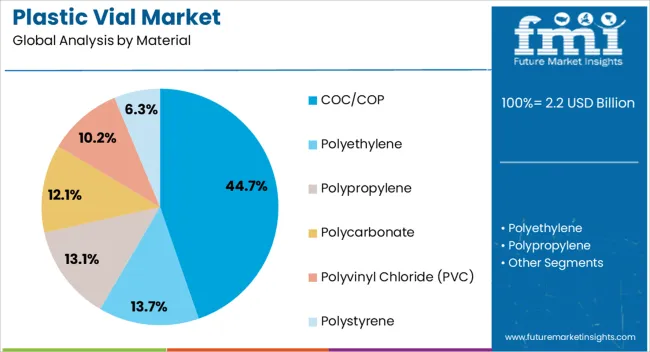
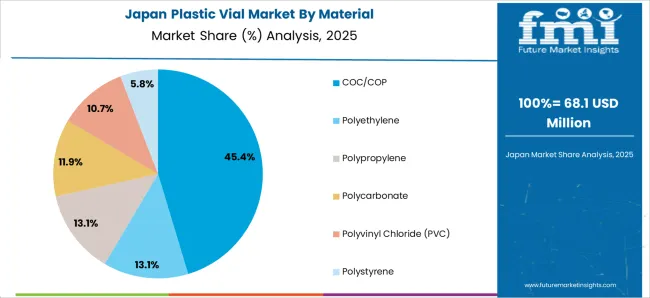
The COC/COP material segment is projected to hold 44.70% of the Plastic Vial market revenue share in 2025, establishing it as the leading material type. This dominance is attributed to the excellent chemical resistance, optical clarity, and dimensional stability offered by COC and COP polymers, which are critical for high-precision pharmaceutical and laboratory applications.
The use of these polymers ensures minimal interaction with sensitive drugs and biologics, maintaining the efficacy and safety of the stored products. Additionally, their compatibility with advanced filling and sealing technologies has enhanced operational efficiency in manufacturing and logistics.
The lightweight nature of COC/COP vials also contributes to reduced transportation costs and lower carbon footprint, supporting sustainability initiatives in healthcare supply chains The segment’s growth is further reinforced by increasing regulatory emphasis on safe and contamination-free packaging materials in pharmaceutical and diagnostic applications.
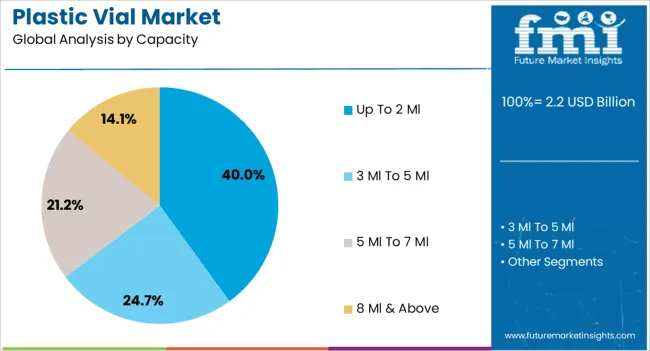
The Up To 2 Ml capacity segment is expected to account for 40.00% of the Plastic Vial market revenue share in 2025, making it the leading capacity type. The preference for this vial size has been driven by its suitability for precise dosing, single-use applications, and compatibility with high-throughput automated laboratory systems.
Small-volume vials minimize wastage and are ideal for handling expensive drugs, vaccines, and reagents, thereby enhancing cost efficiency. Their compact design also facilitates storage, transport, and integration with analytical instruments, supporting operational efficiency.
The adoption of small-capacity vials is further encouraged by the growing demand for personalized medicine and clinical trials, which often require small sample volumes The segment’s growth is strengthened by the need for safety, reliability, and accuracy in pharmaceutical and diagnostic workflows.
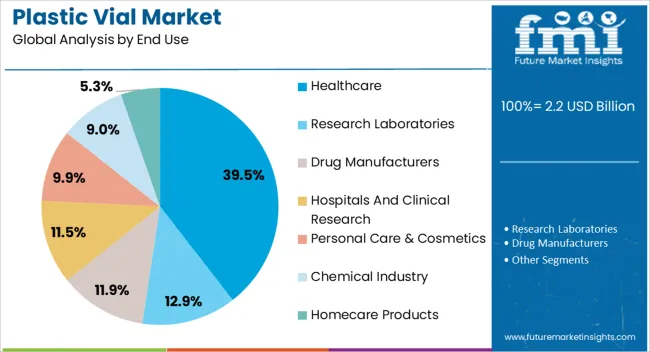
The healthcare end-use segment is anticipated to account for 39.50% of the Plastic Vial market revenue in 2025, making it the dominant end-use segment. Growth in this sector is driven by the increasing demand for injectable drugs, vaccines, and diagnostic reagents, which require high-quality vial packaging to ensure product stability and patient safety.
Plastic vials provide a reliable and contamination-free solution, which is essential for maintaining drug efficacy and compliance with strict regulatory standards. The use of lightweight, durable, and chemically resistant vials enhances operational efficiency in hospitals, laboratories, and pharmaceutical manufacturing.
Furthermore, the rising number of healthcare facilities and research centers globally has accelerated the adoption of plastic vials for routine clinical and laboratory applications The segment’s growth is supported by the ongoing trend toward single-use, disposable packaging to reduce contamination risks and optimize workflow efficiency in healthcare settings.
Pre-Filled Vials See Growing Preference in the Pharmaceutical Industry
The advent of single-dose vials filled beforehand is another major factor pushing the convenience segment in the industry, as they are finding many takers. These single-use, prime-journeyed vials take away the time of manual preparation and hence reduce any possibility for mistakes, as they permit the accurate dose to be drawn.
This is particularly applicable to high-paced clinical locations, such as the emergency room. This will ensure greater patient adherence and in turn better medication safety through the use of pre-filled vials among home caregivers.
Standardization Streamlines Global Trade
The global pharmaceutical industry is witnessing a push for standardization in vial sizes and designs. This will work toward harmonizing and smoothing international trade in drugs and the distribution of drugs across borders. It will then reduce a large number of logistical problems as regards vial compatibility with dispensing systems through the adoption of uniform standards.
The benefit of standardization accrues to the pharmaceutical firms on the one hand, for the internal efficiency it brings to their operation, and to the patients globally on the other, in the form of
Specialized Vials Protect Sensitive Drugs
Certain medications require extra protection due to their sensitivity to light or oxygen. Development of special vials with the latest barrier for the same is required. So, the development with the specialization of this need is carried out for developing special vials with advanced barrier properties.
This has now been developed as advanced innovation, material, and technology. In these modern vials, they can act as a protective barrier against external elements that might deteriorate the medication. This ensures the firmness and potency of such delicate drugs and eventually brings an improvement in the treatment results for the patients.
Vials Extend Beyond Pharmaceuticals
Plastic vials are proving their utility by emerging and getting used in many more interesting ways than just in the pharmaceutical industry. Further expanding the usage of vials, even in cosmetics, to be moving towards vials for serums and sample sizes, and in the nutraceutical industry for high-potency supplements.
Even research laboratories use vials for the storage of their biological samples. This even proves that soon there could be a big opportunity for plastic vial manufacturers to serve industries even more.
| Segment | Estimated Market Share in 2025 |
|---|---|
| COC/COP | 44.7% |
| Healthcare | 39.5% |
Material-wise, the 44.7% market share goes to COC/COP in 2025. The dominance in the material segment is due to its performance superiority. In comparison to traditional PET (polyethylene terephthalate) or PVC (polyvinyl chloride) materials, COC/COP plastics offer better barrier properties, chemical resistance, and excellent clarity.
They are good in such conditions as storing sensitive medications where they need protection from light, oxygen, and environmental conditions. With an increase in demand for high-quality and biocompatible material in pharmaceutical packaging, COC/COP plastics are finding expanded applications in the plastic vial market.
Healthcare remains the dominant end-user with a market share close to 39.5% by 2025. A large share of the healthcare sector is due to the high dependence of healthcare on plastic vials for storing and supplying a wide variety of drugs. From pharmaceuticals and vaccines to injectable medicines and biological samples, plastic vials are the sterile, cost-competitive, light, and uncomplicated packaging solution.
Moreover, the growing importance of personalized medicines and pre-filled vials for ease, convenience, and accurate dosing also continues to augment the demand for plastic vials within the healthcare sector. This segment is foreseen to have dominance sustained due to the pharmaceutical industry across the world seeing incessant growth.
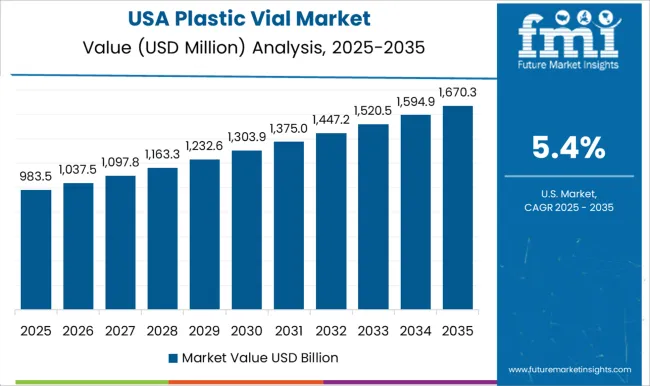
| Country | United States |
|---|---|
| CAGR till 2035 | 5.1% |
The United States is anticipated to maintain leadership in driving the development of the plastic vial market, given its forecast CAGR of 5.1% till 2035 through innovation and sustainability. Environmental concerns are very challenging, the United States is leading in the development of eco-friendly solutions with respect to vials.
The use of plastic vials is largely observed in the pharmaceutical, cosmetic, and food industries in the country. Even if these growth rates do not correspond precisely to the rates of emerging countries, the emphasized regulatory compliance and product safety ensure the steady expansion of the market.
Certainly, it would seem quite more cautious in comparison to those of China or India in their contrast with the United States. Its devotion to research and development, coupled with excellent quality standards, goes a long way toward confirming the top position in the adoption of plastic vials.
| Country | United Kingdom |
|---|---|
| CAGR till 2035 | 3.7% |
The demand for plastic vials in the United Kingdom is set to accelerate at a CAGR of 3.7% till 2035. Though not on the fast track line as much as some competitors, the United Kingdom continues to maintain better environmental possibilities with its solutions in packaging.
The use of plastic vials is found in applications related to healthcare, personal care, and also in laboratory use in the United Kingdom. Adoption would be tepid, but such commitments to cut down plastic pollution and boost material reusability point to a far-reaching vision of sustainable packaging.
While not as high as in China and India, nevertheless, the growth in the United Kingdom still remains very strong and exemplary by any standards in the plastic vial sector.
| Country | Japan |
|---|---|
| CAGR till 2035 | 5.6% |
Japan overtakes the plastic vial industry through high precision and quality, registering a CAGR of 5.6% until 2035. However, Japan is considered in a state of flux, where demographic shifts and economic fluctuations are constantly changing. Yet, the regional players manage to hold an equilibrium that propels further growth in the packaging sector.
For a country like Japan, which is home to some of the leading industries in pharmaceuticals, biotechnology, and laboratory science, plastic vials are very important. However, not at the rate with which it is accepted in growing economies, the commitment of Japan to product innovation and efficiency guarantees that there is maintained demand for quality packaging solutions.
Japan might well be relatively conservative compared to China, whose market never seems to be one such that nothing appears to remain the same for long. In fact, Japan may seem conservative when it comes to adopting plastic vials.
| Country | China |
|---|---|
| CAGR till 2035 | 6.7% |
China, exhibiting an astonishing CAGR of 6.7% till 2035, is expected to lead to an unparalleled pace of growth in the revolution of the plastic vial market. Plastic vials, over and above, have massive demand led by rapid industrialization and urbanization in the pharmaceutical, food, and cosmetic sectors.
Plastic vials are witnessing a broad penetration in China on account of the initiative by the government and infrastructure investment in the country. A huge manufacturing ability added to an exponentially increasing consumer base contributes further to this exponential growth trajectory of the country's packaging industry.
In comparison to markets that have slow progress, e.g., the United Kingdom, this new aggression of expansion by China in the adoption of plastic vials suggests its emergence towards being one of the world leaders in innovative packaging solutions.
| Country | India |
|---|---|
| CAGR till 2035 | 7.1% |
India, a rapidly emerging market, is further strengthening its leadership with sustainable packaging solutions, with an impressive CAGR of 7.1% until 2035. Rapid economic development has in part been fueled by a mushrooming middle-class population that actively takes part in increasing demand for goods and services in almost all sectors.
The use of plastic vials finds applications from pharmaceuticals to FMCG and from agrochemicals, accelerating the sector faster than glass vials. Large-scale urbanization taking place at a rapid pace and a developing environmental attitude toward the preference of using eco-friendly packaging substitutes are additional drivers for this market.
Although the plastics vial industry in India might look like it is at a budding stage in comparison to countries like Japan, its exponential growth rate talks volumes about the ambitions the country has in modernization and sustainability. India's rising domination in the plastic vial market points toward a shift to responsible packaging practices pushed by innovation for growth.
The plastic vial industry may be established, yet it is being revolutionized by startups. These young companies would take care of one or the other area to build on vial functionality and meet the needs of those who may need it now and then. The principal components relating to this is vial dimensions and performance.
From microfluidic vials with microscopic volumes created by startups which are perfect for storing and transporting highly-valued medications or personalized doses, you see the ease at which digitalization has enabled healthcare. Further to that quite several startups are manufacturing blended vial-syringe systems to reduce medication delivery complexity and enhance patient compliance, especially self-given injectable drugs.
Yet, other areas beyond size and function are where startups are seen to be excelling in sustainability. The investigations on the development of bio-based and biodegradable plastic vials are being carried out, intending not only to aid the transition but also to offer a more sustainable alternative to traditional material. Nevertheless, some ventures are exploring the field of 'smart vials' and they are providing sensors and microchips.
These smart vials enable them to monitor dosage adherence, track the temperatures during storage, and connect to healthcare platforms that may guarantee better adherence to medication and positive results in temperature-sensitive drugs. Through developing alternative solutions, particularly, startup companies have been able to alter the plastic vial industry’s future.
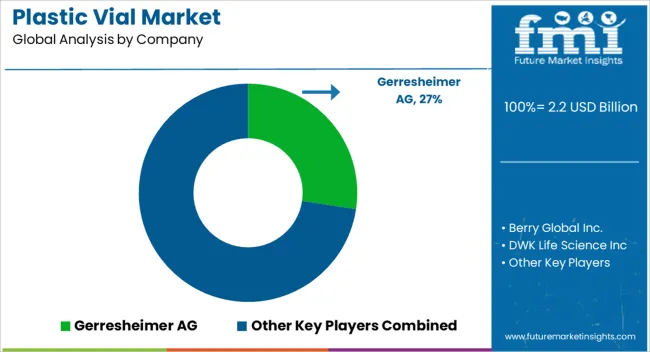
The plastic vial market is an exciting landscape where a number of long-established companies compete with newcomers. Market leaders, such as Schott AG, SGD Pharma, or Wheaton Plastic Products, with highly developed manufacturing capabilities, wide distribution networks, and large product lines, play the largest part in this field.
The veteran manufacturers strive to enhance the designs of vials, their functionality as well as the efficiency in production. Moreover, they are proactively involved in increasing the production volume to address the growing demand in the global market.
On the other hand, the competitive arena is growing with new players coming from the Asian market. These companies, in particular, usually take advantage of the low production costs to give competitive prices and thus they become the option that is preferred by cost-effective customers.
On the other hand, some other newcomers have gone into specific areas such as bio-based vials and microfluidic vials serving specialized market groups, while existing market players' market share may be threatened. The existing titans and emerging challengers that are expected to compete will consequently wake up to innovativeness, cost-effectiveness, and the meeting of specialized needs.
Recent Developments in the Plastic Vial Industry
The global plastic vial market is estimated to be valued at USD 2.2 billion in 2025.
The market size for the plastic vial market is projected to reach USD 4.2 billion by 2035.
The plastic vial market is expected to grow at a 6.4% CAGR between 2025 and 2035.
The key product types in plastic vial market are coc/cop, polyethylene, polypropylene, polycarbonate, polyvinyl chloride (PVC) and polystyrene.
In terms of capacity, up to 2 ml segment to command 40.0% share in the plastic vial market in 2025.


Our Research Products

The "Full Research Suite" delivers actionable market intel, deep dives on markets or technologies, so clients act faster, cut risk, and unlock growth.

The Leaderboard benchmarks and ranks top vendors, classifying them as Established Leaders, Leading Challengers, or Disruptors & Challengers.

Locates where complements amplify value and substitutes erode it, forecasting net impact by horizon

We deliver granular, decision-grade intel: market sizing, 5-year forecasts, pricing, adoption, usage, revenue, and operational KPIs—plus competitor tracking, regulation, and value chains—across 60 countries broadly.

Spot the shifts before they hit your P&L. We track inflection points, adoption curves, pricing moves, and ecosystem plays to show where demand is heading, why it is changing, and what to do next across high-growth markets and disruptive tech

Real-time reads of user behavior. We track shifting priorities, perceptions of today’s and next-gen services, and provider experience, then pace how fast tech moves from trial to adoption, blending buyer, consumer, and channel inputs with social signals (#WhySwitch, #UX).

Partner with our analyst team to build a custom report designed around your business priorities. From analysing market trends to assessing competitors or crafting bespoke datasets, we tailor insights to your needs.
Supplier Intelligence
Discovery & Profiling
Capacity & Footprint
Performance & Risk
Compliance & Governance
Commercial Readiness
Who Supplies Whom
Scorecards & Shortlists
Playbooks & Docs
Category Intelligence
Definition & Scope
Demand & Use Cases
Cost Drivers
Market Structure
Supply Chain Map
Trade & Policy
Operating Norms
Deliverables
Buyer Intelligence
Account Basics
Spend & Scope
Procurement Model
Vendor Requirements
Terms & Policies
Entry Strategy
Pain Points & Triggers
Outputs
Pricing Analysis
Benchmarks
Trends
Should-Cost
Indexation
Landed Cost
Commercial Terms
Deliverables
Brand Analysis
Positioning & Value Prop
Share & Presence
Customer Evidence
Go-to-Market
Digital & Reputation
Compliance & Trust
KPIs & Gaps
Outputs
Full Research Suite comprises of:
Market outlook & trends analysis
Interviews & case studies
Strategic recommendations
Vendor profiles & capabilities analysis
5-year forecasts
8 regions and 60+ country-level data splits
Market segment data splits
12 months of continuous data updates
DELIVERED AS:
PDF EXCEL ONLINE
Plastic Vials and Ampoules Market Size and Share Forecast Outlook 2025 to 2035
Leading Providers & Market Share in Plastic Vials and Ampoules Industry
Plastic Tubes for Effervescent Tablets Market Size and Share Forecast Outlook 2025 to 2035
Plastic Banding Market Size and Share Forecast Outlook 2025 to 2035
Plastic Tube Market Size and Share Forecast Outlook 2025 to 2035
Plastic Jar Packaging Market Forecast and Outlook 2025 to 2035
Plastic Cases Market Size and Share Forecast Outlook 2025 to 2035
Plastic Jar Industry Analysis in the United States Size and Share Forecast Outlook 2025 to 2035
Plastic Cutlery Market Forecast and Outlook 2025 to 2035
Plastic Hot and Cold Pipe Market Forecast and Outlook 2025 to 2035
Plastic Retort Can Market Size and Share Forecast Outlook 2025 to 2035
Plastic Gears Market Size and Share Forecast Outlook 2025 to 2035
Plastic Additive Market Size and Share Forecast Outlook 2025 to 2035
Plastic Market Size and Share Forecast Outlook 2025 to 2035
Plastic Healthcare Packaging Market Size and Share Forecast Outlook 2025 to 2035
Plastic Bottle Industry Analysis in Malaysia Size and Share Forecast Outlook 2025 to 2035
Plastic Drum Industry Analysis in Malaysia Size and Share Forecast Outlook 2025 to 2035
Plastic Healthcare Packaging Industry Analysis in Western Europe Size and Share Forecast Outlook 2025 to 2035
Plastic Healthcare Packaging Industry Analysis in Korea Size and Share Forecast Outlook 2025 to 2035
Plastic Healthcare Packaging Industry Analysis in Japan Size and Share Forecast Outlook 2025 to 2035

Thank you!
You will receive an email from our Business Development Manager. Please be sure to check your SPAM/JUNK folder too.
Chat With
MaRIA