The global plastic healthcare packaging market is projected to grow from USD 42.6 billion in 2025 to approximately USD 89.4 billion by 2035, recording an absolute increase of USD 46.7 billion over the forecast period. This translates into a total growth of 109.6%, with the market forecast to expand at a CAGR of 7.7% between 2025 and 2035. The overall market size is expected to grow by approximately 2.1X during the same period, supported by increasing demand for sterile medical packaging, growing healthcare expenditure across developing nations, and rising requirements for safe pharmaceutical delivery systems across global healthcare and medical device sectors.
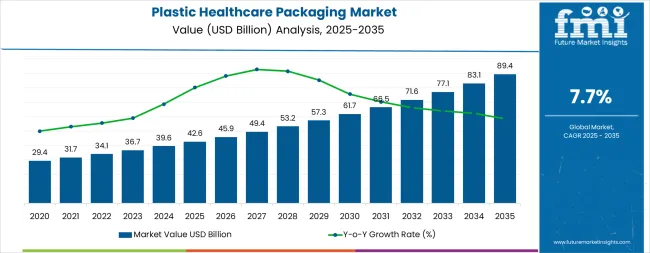
Between 2025 and 2030, the plastic healthcare packaging market is projected to grow from USD 42.6 billion to USD 61.8 billion, an increase of USD 19.2 billion, representing 41.1% of the total decade growth. This phase will be driven by rising demand for single-use medical packaging, the need for enhanced pharmaceutical protection, and growing availability of specialized packaging across hospitals and pharmaceutical distribution. From 2030 to 2035, the market is expected to expand further from USD 61.8 billion to USD 89.4 billion, adding USD 27.5 billion, making up 58.9% of the total decade growth. Key factors will include biodegradable polymers, advanced barrier technologies, and tamper-evident solutions. The focus will be on patient safety and certified sterile packaging, with improvements in contamination resistance, moisture barriers, and compliance. Between 2020 and 2024, the market grew as healthcare providers recognized plastic packaging's role in enhancing safety and reliable pharmaceutical distribution.
| Metric | Value |
|---|---|
| Estimated Value in (2025E) | USD 42.6 billion |
| Forecast Value in (2035F) | USD 89.4 billion |
| Forecast CAGR (2025 to 2035) | 7.7% |
The plastic healthcare packaging market is driven by several key parent markets, with the healthcare packaging market being the largest contributor, accounting for around 35-40%. Plastic packaging is crucial in healthcare, providing solutions for pharmaceuticals, medical devices, and diagnostic products. Plastic containers, blister packs, and pouches offer durability, protection, and sterility, which are essential for ensuring the safety and integrity of healthcare products. The pharmaceutical market, contributing about 25-30%, relies on plastic packaging for medications such as tablets, syrups, and injectables. Plastic packaging protects drugs from environmental factors like moisture and air, ensuring their effectiveness and stability. The medical devices market, which accounts for 15-20%, uses plastic for packaging a wide range of medical products like syringes, catheters, and surgical instruments, benefiting from the lightweight and protective properties of plastic.
The diagnostic equipment market contributes approximately 10-12%, where plastic packaging is used for items such as test kits, vials, and reagent bottles, ensuring they remain secure and contamination-free. The consumer healthcare market, holding around 5-8%, benefits from plastic packaging for over-the-counter medications, health supplements, and other consumer health products. Plastic packaging offers convenience, portability, and tamper-evident features, which are appealing to consumers. These parent markets demonstrate the widespread use and growing demand for plastic healthcare packaging solutions across various sectors, driven by the need for protection, convenience, and regulatory compliance in the healthcare industry.
Market expansion is being supported by the increasing global demand for pharmaceutical safety solutions and the corresponding shift toward medical-grade packaging that can provide superior protective outcomes while meeting user requirements for sterility assurance and reliable medication delivery processes. Modern healthcare providers are increasingly focused on incorporating packaging solutions that can enhance medication integrity while satisfying demands for durable, consistently performing containers and optimized dispensing practices. Plastic healthcare packaging's proven ability to deliver safety benefits, medication protection, and diverse application possibilities makes them essential products for pharmaceutical manufacturers and quality-conscious medical organizations.
The growing emphasis on patient safety and operational efficiency is driving demand for high-quality plastic packaging that can support distinctive protection outcomes and comprehensive compliance positioning across pharmaceutical packaging, medical device protection, and specialty medication categories. User preference for products that combine sterile excellence with barrier characteristics is creating opportunities for innovative implementations in both traditional and emerging healthcare applications. The rising influence of regulatory standards and medication safety initiatives is also contributing to increased adoption of plastic healthcare packaging that can provide authentic protection benefits and reliability characteristics.
The market is segmented by packaging type, material type, end-use application, and region. By packaging type, the market is divided into rigid packaging, flexible packaging, blister packaging, bottles & containers, pouches & bags, tubes, and other packaging types. Based on material type, the market is categorized into polyethylene (PE), polypropylene (PP), polyethylene terephthalate (PET), polyvinyl chloride (PVC), and other plastics. By end-use application, the market includes pharmaceutical, medical devices, diagnostic products, surgical instruments, and other applications. Regionally, the market is divided into North America, Europe, Asia Pacific, Latin America, Middle East & Africa, and other regions.
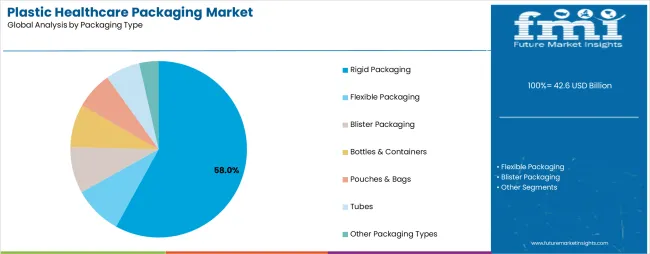
The rigid packaging segment is projected to account for 58% of the plastic healthcare packaging market in 2025, reaffirming its position as the leading product category. Pharmaceutical manufacturers and healthcare organizations increasingly utilize rigid packaging for their superior protective characteristics, established barrier resistance, and essential functionality in medication protection applications across diverse pharmaceutical categories. Rigid packaging's standardized durability characteristics and proven protective effectiveness directly address user requirements for reliable medication safety and optimal protection value in medical applications.
This product segment forms the foundation of modern pharmaceutical packaging patterns, as it represents the format with the greatest professional acceptance potential and established compatibility across multiple medication systems. Healthcare investments in medication safety optimization and compliance standardization continue to strengthen adoption among quality-conscious organizations. With users prioritizing medication security and protection reliability, rigid packaging aligns with both safety objectives and performance requirements, making them the central component of comprehensive pharmaceutical distribution strategies.
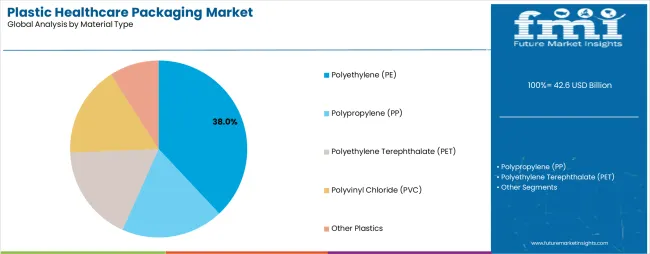
Polyethylene (PE) materials are projected to represent 38% of the plastic healthcare packaging market growth through 2035, underscoring their critical role as the primary choice for quality-focused manufacturers seeking superior barrier benefits and enhanced flexibility credentials. Pharmaceutical users and premium medication handlers prefer PE packaging for their enhanced safety standards, proven processing superiority, and ability to maintain exceptional protective profiles while supporting long-term storage during critical pharmaceutical distribution experiences. Positioned as essential products for discerning manufacturers, PE offerings provide both protective excellence and cost advantages.
The segment is supported by continuous improvement in polymer processing technology and the widespread availability of established manufacturing infrastructure that enables quality assurance and competitive positioning at the pharmaceutical level. Additionally, packaging manufacturers are optimizing PE processing methods to support market differentiation and accessible premium pricing. As materials technology continues to advance and users seek superior protection solutions, PE packaging will continue to drive market growth while supporting medication preservation and pharmaceutical handling strategies.
The plastic healthcare packaging market is advancing rapidly due to increasing medication safety consciousness and the growing need for medical-grade packaging choices that emphasize superior protective outcomes across pharmaceutical segments and healthcare applications. The market faces challenges, including regulatory complexity, material compatibility considerations for sensitive medications, and supply chain disruptions affecting raw material pricing stability. Innovation in barrier materials and specialized product development continues to influence market development and expansion patterns.
The growing adoption of plastic healthcare packaging in specialized pharmaceutical programs and medication-intensive applications is enabling users to develop distribution patterns that provide distinctive safety benefits while commanding premium positioning and enhanced sterility characteristics. Medical applications provide superior barrier density while allowing more sophisticated medication handling across various pharmaceutical categories. Users are increasingly recognizing the competitive advantages of plastic packaging positioning for premium medication protection and safety-conscious operational integration.
Modern plastic healthcare packaging manufacturers are incorporating advanced tracking systems, serialization technologies, and quality management protocols to enhance protective capabilities, improve patient outcomes, and meet regulatory demands for medication-specific tracking solutions. These systems improve packaging effectiveness while enabling new applications, including integrated authentication and specialized compliance programs. Advanced technology integration also allows manufacturers to support premium market positioning and safety leadership beyond traditional packaging operations.
| Country | CAGR (2025-2035) |
|---|---|
| USA | 7.4% |
| Germany | 7.1% |
| UK | 6.9% |
| China | 9.2% |
| Japan | 6.6% |
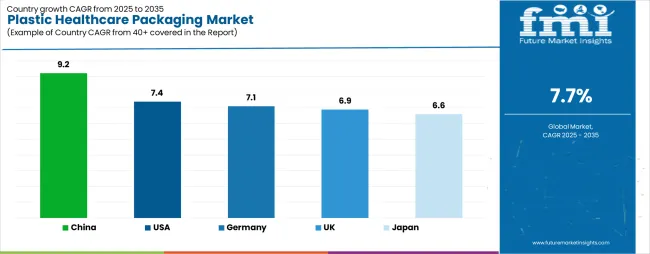
The plastic healthcare packaging market is experiencing robust growth globally, with China leading at a 9.2% CAGR through 2035, driven by the expanding pharmaceutical manufacturing sector, growing healthcare infrastructure investment, and increasing adoption of sterile medical packaging products. The USA follows at 7.4%, supported by rising pharmaceutical production, expanding healthcare facilities, and growing acceptance of advanced packaging solutions. Germany shows growth at 7.1%, emphasizing established pharmaceutical markets and comprehensive manufacturing development. The UK records 6.9%, focusing on premium medical products and pharmaceutical innovation expansion. Japan demonstrates 6.6% growth, prioritizing quality healthcare solutions and technological advancement.
The report covers an in-depth analysis of 40+ countries, with top-performing countries highlighted below.
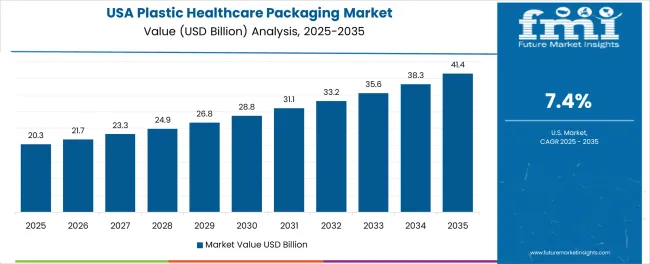
Revenue from plastic healthcare packaging consumption and sales in the USA is projected to exhibit exceptional growth with a CAGR of 7.4% through 2035, driven by the country's rapidly expanding pharmaceutical sector, favorable regulatory attitudes toward advanced packaging solutions, and initiatives promoting medication safety optimization across major healthcare regions. The USA's position as a leading pharmaceutical market and increasing focus on patient safety development are creating substantial demand for high-quality plastic healthcare packaging in both commercial and hospital markets. Major pharmaceutical suppliers and specialty medical packaging providers are establishing comprehensive distribution capabilities to serve growing healthcare demand and emerging safety opportunities.
Demand for plastic healthcare packaging products in Germany is expanding at a CAGR of 7.1%, supported by rising pharmaceutical sophistication, growing medical device precision, and expanding medication safety infrastructure. The country's developing healthcare capabilities and increasing pharmaceutical investment in quality packaging are driving demand for plastic healthcare packaging across both imported and domestically produced applications. International pharmaceutical companies and domestic manufacturers are establishing comprehensive distribution networks to address growing market demand for quality plastic packaging and sterile solutions.
Revenue from plastic healthcare packaging products in the UK is projected to grow at a CAGR of 6.9% through 2035, supported by the country's mature pharmaceutical market, established safety culture, and leadership in regulatory standards. Britain's sophisticated healthcare infrastructure and strong support for medication safety are creating steady demand for both traditional and innovative plastic packaging varieties. Leading pharmaceutical suppliers and specialty medical packaging providers are establishing comprehensive operational strategies to serve both domestic markets and growing export opportunities.
Demand for plastic healthcare packaging products in China is projected to expand at a CAGR of 9.2% through 2035, driven by the country's emphasis on pharmaceutical expansion, manufacturing leadership, and sophisticated production capabilities for medications requiring specialized sterile varieties. Chinese manufacturers and distributors consistently seek medical-grade products that enhance medication safety and support pharmaceutical operations for both traditional and innovative healthcare applications. The country's position as an Asian pharmaceutical leader continues to drive innovation in specialty plastic packaging applications and medical product standards.
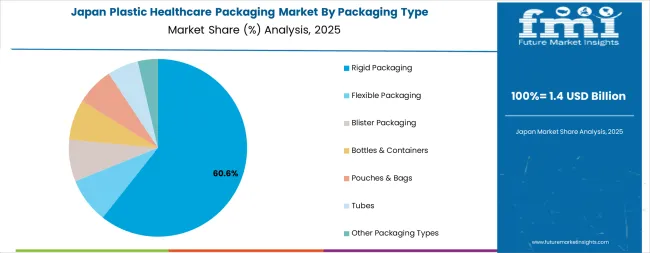
Revenue from plastic healthcare packaging products in Japan is anticipated to grow at a CAGR of 6.6% through 2035, supported by the country's emphasis on quality pharmaceutical manufacturing, medication safety standards, and advanced technology integration requiring efficient sterile solutions. Japanese pharmaceutical professionals and medication handlers prioritize quality performance and precision protection, making plastic healthcare packaging essential components for both traditional and modern medical applications. The country's comprehensive pharmaceutical excellence and advancing healthcare patterns support continued market expansion.
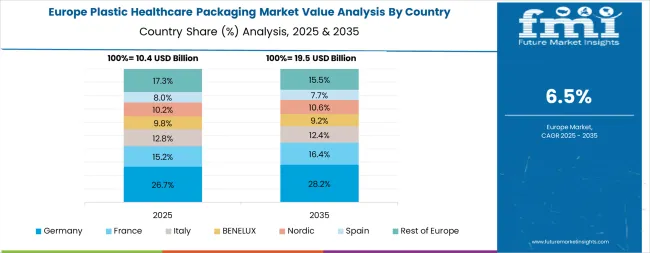
The Europe plastic healthcare packaging market is projected to grow from USD 14.2 billion in 2025 to USD 27.8 billion by 2035, recording a CAGR of 7.0% over the forecast period. Germany leads the region with a 35.0% share in 2025, moderating slightly to 34.5% by 2035, supported by its strong pharmaceutical culture and demand for premium, medically engineered plastic packaging. The United Kingdom follows with 22.0% in 2025, easing to 21.5% by 2035, driven by a sophisticated pharmaceutical market and emphasis on quality and regulatory standards. France accounts for 19.5% in 2025, rising to 20.0% by 2035, reflecting steady adoption of sterile packaging solutions and healthcare consciousness. Italy holds 10.5% in 2025, expanding to 11.2% by 2035 as pharmaceutical modernization and specialty medication applications grow. Spain contributes 6.5% in 2025, growing to 7.0% by 2035, supported by expanding healthcare facilities and pharmaceutical packaging handling. The Nordic countries rise from 4.5% in 2025 to 4.8% by 2035 on the back of strong quality adoption and advanced healthcare integration. BENELUX remains a stable 2.0% share across both 2025 and 2035, reflecting mature, premium-focused markets.
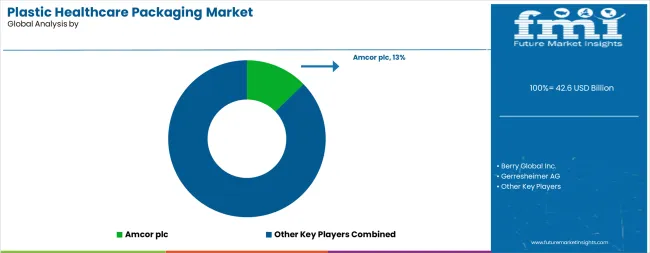
The plastic healthcare packaging market is characterized by competition among established medical packaging companies, specialized pharmaceutical packaging manufacturers, and integrated sterile solution providers. Companies are investing in material technologies, advanced sterilization systems, product innovation capabilities, and comprehensive distribution networks to deliver consistent, high-quality, and compliant plastic healthcare packaging. Innovation in barrier enhancement, tamper-evident production methods, and application-specific product development is central to strengthening market position and customer satisfaction.
Amcor plc leads the market with a strong focus on pharmaceutical innovation and comprehensive rigid packaging solutions, offering premium plastic healthcare packaging with emphasis on sterility excellence and safety heritage. Berry Global Inc. provides specialized pharmaceutical packaging capabilities with a focus on North American market applications and custom design networks. Gerresheimer AG delivers integrated medical solutions with a focus on quality positioning and operational efficiency. AptarGroup Inc. specializes in comprehensive dispensing systems with an emphasis on pharmaceutical applications. West Pharmaceutical Services focuses on comprehensive injectable solutions with advanced engineering and premium positioning capabilities.
The success of plastic healthcare packaging in meeting pharmaceutical safety demands, medication-driven protection requirements, and regulatory compliance integration will not only enhance patient outcomes but also strengthen global healthcare capabilities. It will consolidate emerging regions' positions as hubs for efficient packaging manufacturing and align advanced economies with pharmaceutical safety systems. This calls for a concerted effort by all stakeholders - governments, industry bodies, suppliers, distributors, and investors. Each can be a crucial enabler in preparing the market for its next phase of growth.
| Items | Values |
|---|---|
| Quantitative Units (2025) | USD 42.6 billion |
| Packaging Type | Rigid Packaging, Flexible Packaging, Blister Packaging, Bottles & Containers, Pouches & Bags, Tubes, Other Packaging Types |
| Material Type | Polyethylene (PE), Polypropylene (PP), Polyethylene Terephthalate (PET), Polyvinyl Chloride (PVC), Other Plastics |
| End-Use Application | Pharmaceutical, Medical Devices, Diagnostic Products, Surgical Instruments, Other Applications |
| Regions Covered | North America, Europe, Asia Pacific, Latin America, Middle East & Africa, Other Regions |
| Countries Covered | United States, Germany, United Kingdom, China, Japan, and 40+ countries |
| Key Companies Profiled | Amcor plc, Berry Global Inc., Gerresheimer AG, AptarGroup Inc., West Pharmaceutical Services, and other leading plastic healthcare packaging companies |
| Additional Attributes | Dollar sales by packaging type, material type, end-use application, and region; regional demand trends, competitive landscape, technological advancements in polymer engineering, sterile design integration initiatives, quality enhancement programs, and premium product development strategies |
The global plastic healthcare packaging market is estimated to be valued at USD 42.6 billion in 2025.
The market size for the plastic healthcare packaging market is projected to reach USD 89.4 billion by 2035.
The plastic healthcare packaging market is expected to grow at a 7.7% CAGR between 2025 and 2035.
The key product types in plastic healthcare packaging market are rigid packaging, flexible packaging, blister packaging, bottles & containers, pouches & bags, tubes and other packaging types.
In terms of material type, polyethylene (pe) segment to command 38.0% share in the plastic healthcare packaging market in 2025.


Our Research Products

The "Full Research Suite" delivers actionable market intel, deep dives on markets or technologies, so clients act faster, cut risk, and unlock growth.

The Leaderboard benchmarks and ranks top vendors, classifying them as Established Leaders, Leading Challengers, or Disruptors & Challengers.

Locates where complements amplify value and substitutes erode it, forecasting net impact by horizon

We deliver granular, decision-grade intel: market sizing, 5-year forecasts, pricing, adoption, usage, revenue, and operational KPIs—plus competitor tracking, regulation, and value chains—across 60 countries broadly.

Spot the shifts before they hit your P&L. We track inflection points, adoption curves, pricing moves, and ecosystem plays to show where demand is heading, why it is changing, and what to do next across high-growth markets and disruptive tech

Real-time reads of user behavior. We track shifting priorities, perceptions of today’s and next-gen services, and provider experience, then pace how fast tech moves from trial to adoption, blending buyer, consumer, and channel inputs with social signals (#WhySwitch, #UX).

Partner with our analyst team to build a custom report designed around your business priorities. From analysing market trends to assessing competitors or crafting bespoke datasets, we tailor insights to your needs.
Supplier Intelligence
Discovery & Profiling
Capacity & Footprint
Performance & Risk
Compliance & Governance
Commercial Readiness
Who Supplies Whom
Scorecards & Shortlists
Playbooks & Docs
Category Intelligence
Definition & Scope
Demand & Use Cases
Cost Drivers
Market Structure
Supply Chain Map
Trade & Policy
Operating Norms
Deliverables
Buyer Intelligence
Account Basics
Spend & Scope
Procurement Model
Vendor Requirements
Terms & Policies
Entry Strategy
Pain Points & Triggers
Outputs
Pricing Analysis
Benchmarks
Trends
Should-Cost
Indexation
Landed Cost
Commercial Terms
Deliverables
Brand Analysis
Positioning & Value Prop
Share & Presence
Customer Evidence
Go-to-Market
Digital & Reputation
Compliance & Trust
KPIs & Gaps
Outputs
Full Research Suite comprises of:
Market outlook & trends analysis
Interviews & case studies
Strategic recommendations
Vendor profiles & capabilities analysis
5-year forecasts
8 regions and 60+ country-level data splits
Market segment data splits
12 months of continuous data updates
DELIVERED AS:
PDF EXCEL ONLINE
Plastic Healthcare Packaging Industry Analysis in Western Europe Size and Share Forecast Outlook 2025 to 2035
Plastic Healthcare Packaging Industry Analysis in Korea Size and Share Forecast Outlook 2025 to 2035
Plastic Healthcare Packaging Industry Analysis in Japan Size and Share Forecast Outlook 2025 to 2035
Competitive Overview of Plastic Healthcare Packaging Providers
Europe Healthcare Rigid Plastic Packaging Market Trends – 2024-2034
Plastic Packaging For Food and Beverage Market Size and Share Forecast Outlook 2025 to 2035
Plastic Packaging Market Size and Share Forecast Outlook 2025 to 2035
Plastic Jar Packaging Market Forecast and Outlook 2025 to 2035
Competitive Overview of Plastic Jar Packaging Companies
Plastic-free Packaging Market Size and Share Forecast Outlook 2025 to 2035
Plastic Tube Packaging Market Size and Share Forecast Outlook 2025 to 2035
Bioplastic Packaging Bag Market Growth – Demand & Forecast 2025 to 2035
PCR Plastic Packaging Market Size and Share Forecast Outlook 2025 to 2035
Plastic Aerosol Packaging Market
Bioplastics For Packaging Market Size and Share Forecast Outlook 2025 to 2035
Animal Healthcare Packaging Market Size and Share Forecast Outlook 2025 to 2035
Flexible Plastic Packaging Market Size and Share Forecast Outlook 2025 to 2035
Recycled Plastic Packaging Market Size and Share Forecast Outlook 2025 to 2035
Cosmetic Plastic Packaging Market Size and Share Forecast Outlook 2025 to 2035
Flexible Plastic Packaging Industry Analysis in United States Size and Share Forecast Outlook 2025 to 2035

Thank you!
You will receive an email from our Business Development Manager. Please be sure to check your SPAM/JUNK folder too.
Chat With
MaRIA