Plastic Healthcare Packaging Market Size and Share Forecast Outlook in Japan (2024 to 2034)

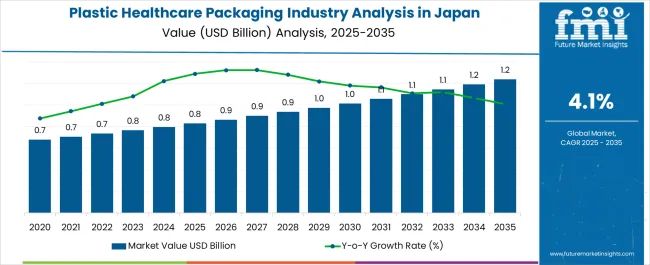
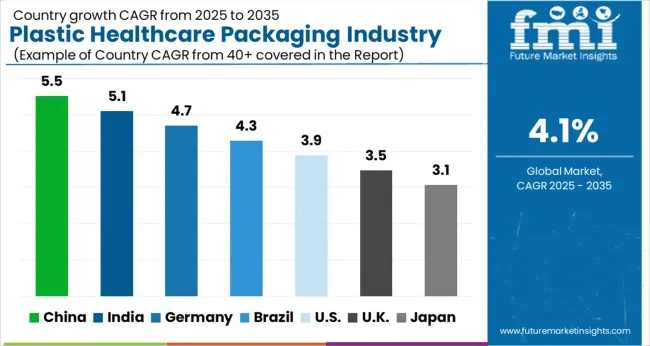
In Japan, demand for plastic healthcare packaging is likely to exhibit a CAGR of 4.30% through 2034. The plastic healthcare packaging industry in Japan is poised to reach USD 796.3 million in 2024.

Attributes Details
Expected Value in 2024 USD 796.3 million
Projected Value in 2034 USD 1,213.20 million
CAGR Estimation from 2024 to 2034 4.30%

Increased collaboration between packaging manufacturers, pharmaceutical companies, and research institutions drives innovation in packaging design, materials, and technologies for better healthcare outcomes in Japan. By 2034, the plastic healthcare packaging in Japan will likely secure USD 1,213.20 million.

Key Insights on Emerging and Fast-Growing Opportunities in Japan’s Plastic Healthcare Packaging Sector

  • A growing demand for healthcare products and medicines drives the need for efficient, durable, and safe packaging solutions in healthcare.
  • The growing innovations in plastic materials and packaging technologies have improved the quality and functionality of healthcare packaging.
  • Increasing stringent regulations driving the need for packaging that ensures safety, tamper resistance, and proper labeling for pharmaceuticals and medical devices.

Trends Influencing Demand for Plastic Healthcare Packaging in Japan

  • The rising integration of smart features in packaging, such as QR codes, RFID tags, or NFC technology, allows for better tracking.
  • There is a growing emphasis on tamper-evident and child-resistant packaging to ensure the safety and integrity of pharmaceuticals and medical devices, aligning with stringent regulatory requirements.

Analysis of Top Regions Manufacturing and Certifying Plastic Healthcare Packaging in Japan

Increased Sustainability Initiatives in Kanto Drive Industry Growth

Technological advancements in various industries, including healthcare packaging. Research and development centers in the region contribute to developing cutting-edge materials, designs, and technologies for packaging.

Kanto, being a highly populated and urbanized area, often experiences more acute environmental concerns. This may lead to a stronger push for sustainable packaging solutions and greater consumer awareness and demand for eco-friendly options.

Focus on Technology Makes the Chubu Region a Significant Contributor to the Plastic Healthcare Packaging Industry in Japan

The high presence of the pharmaceutical industry contributes to producing high-quality plastic healthcare packaging materials and solutions in Chubu. The growing technological advancement and emphasis on innovation in the healthcare sector drive the industry demand.

Increased research and development facilities within Chubu drive advancements in packaging materials, designs, and production techniques for pharmaceuticals and medical devices are the key factors supporting demand.

Plastic Healthcare Packaging Industry Analysis by Top Investment Segments in Japan

Polypropylene Materials are Highly Preferred in Plastic Healthcare Packaging in Japan

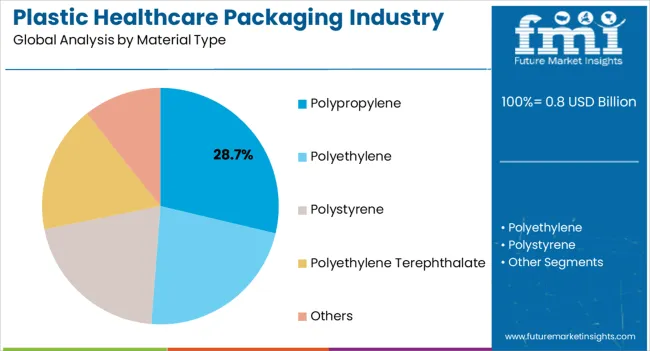
Based on the material, plastic healthcare packaging in Japan will likely be dominated by the polypropylene segment, with a share of 34.50%.

Polypropylene is a versatile material that can be molded into various forms, making it suitable for different types of healthcare packaging, including bottles, containers, closures, and blister packs. Polypropylene has excellent chemical resistance, ensuring that it maintains the integrity of pharmaceuticals and medical devices by protecting them from potential contamination or interaction with the packaging material.

Polypropylene can be made transparent, allowing for easy visibility of the packaged product. This is advantageous for pharmaceuticals where visual inspection is necessary. Polypropylene is recyclable, aligning with the growing focus on sustainability. With increased emphasis on eco-friendly packaging, the recyclability of PP makes it an attractive choice for healthcare packaging.

Attribute Details
Material Polypropylene
Value Share 34.50%

The Medical Devices Segment is Gaining Popularity

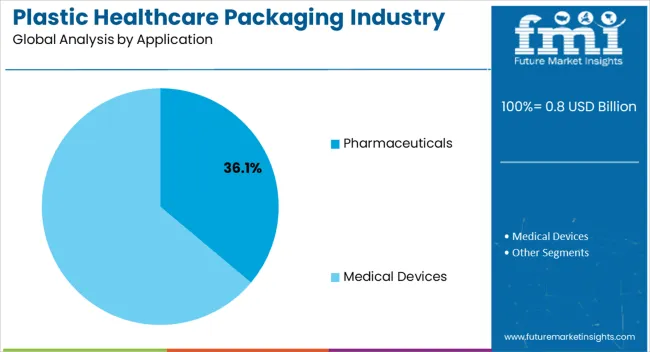
Based on application, plastic healthcare packaging in Japan is likely to be dominated by the fixed segment, with a share of 58.40%.

Different medical devices require tailored packaging solutions to ensure proper protection and ease of use. Plastic packaging allows for customizable designs that cater to the specific requirements of various medical devices, from surgical instruments to diagnostic tools.

As new medical devices are developed, there is a parallel need for packaging solutions that ensure the safety, sterility, and functionality of these devices. Plastic packaging materials, including specialized films and containers, play a crucial role in ensuring the sterility of these devices throughout transportation and until their use.

Attribute Details
Application Medical Devices
Value Share 58.40%

Competitive Landscape of the Plastic Healthcare Packaging Market in Japan

Companies operating in Japan's plastic healthcare packaging industry are aiming for strategic collaborations and partnerships with other manufacturers to expand their product portfolio and invest in capacity expansions. Industry players are also investing in expanding their production capacities. These initiatives are aimed at enhancing their product portfolios and increasing their capability to meet the evolving demands of the healthcare sector.
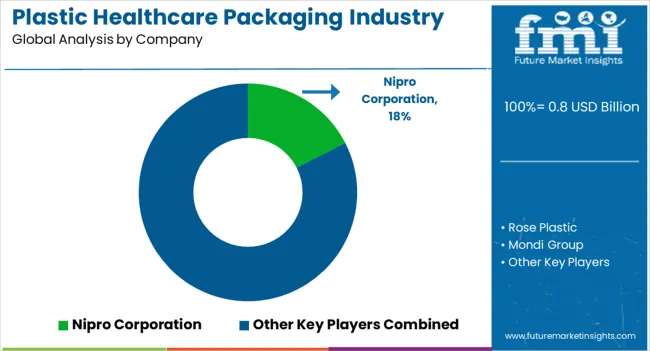
Leading Companies in Japan’s Plastic Healthcare Packaging Industry

  • Rose Plastic
  • Nipro Corporation
  • Mondi Group
  • Adelphi Healthcare Packaging
  • Wipak Ltd
  • Aptar Group
  • West Rock Company
  • West Pharmaceutical Services
  • McKesson Corporation
  • Novio Packaging

Product Offering

  • Nipro is involved in producing packaging solutions for its line of medical devices and pharmaceutical products. This includes various types of packaging, such as blister packs, containers, vials, and bags designed to ensure the safety, sterility, and integrity of their medical products.

Scope and Coverage of the Plastic Healthcare Packaging Market Report in Japan

Attribute Details
Estimated Industry Size in 2024 USD 796.3 million
Projected Industry Size in 2034 USD 1,213.20 million
Anticipated CAGR between 2024 to 2034 4.30% CAGR
Historical Analysis of Plastic Healthcare Packaging in Japan 2019 to 2023
Forecast for Deployment of Plastic Healthcare Packaging in Japan 2024 to 2034
Report Coverage Industry Size, Industry Trends, Analysis of key factors influencing Deployment of Plastic Healthcare Packaging in Japan, Insights on Global Players and their Industry Strategy in Japan, Ecosystem Analysis of Local Providers in Japan.
Key Region Analyzed While Studying Opportunities in the Plastic Healthcare Packaging in Japan Kanto Region; Chubu Region; Kinki (Kansai); Kyushu and Okinawa; Tohoku
Key Companies Profiled Rose Plastic; Nipro Corporation; Mondi Group; Adelphi Healthcare Packaging; Wipak Ltd; Aptar Group; West Rock Company; West Pharmaceutical Services; McKesson Corporation; Novio Packaging

Top Segments Studied in the Japan Plastic Healthcare Packaging Market Report

By Product Type:

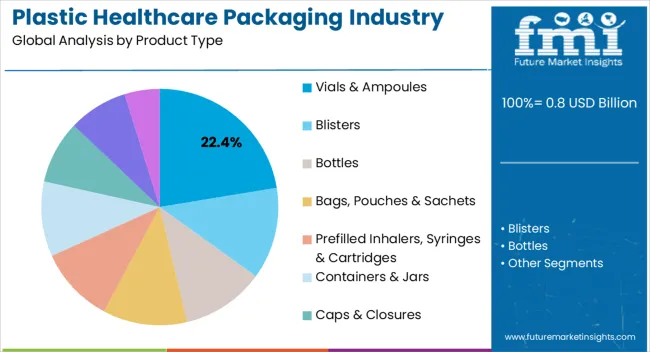
  • Vials & Ampoules
  • Blisters
  • Bottles
    • Dropper Bottles
    • Nasal Spray Bottles
    • Liquid Bottles
  • Bags, Pouches & Sachets
    • IV Bags
    • Medical Specialty Bags
  • Prefilled Inhalers, Syringes & Cartridges
  • Containers & Jars
  • Caps & Closures
  • Trays
  • Medication Tubes

By Material Type:

  • Polyethylene
    • Low Density Polyethylene (LDPE)
    • High Density Polyethylene (HDPE)
    • Linear Low Density Polyethylene (LLDPE)
    • Polyvinyl Chloride
  • Polystyrene
  • Polypropylene
    • Bi-axially Oriented Polypropylene
    • Cast Polypropylene
  • Polyethylene Terephthalate
    • Bi-axially oriented Polyethylene Terephthalate
    • Metallized PET
  • Others

By Application:

  • Medical Devices
    • Sterile packaging
    • Non-sterile packaging
  • Pharmaceuticals

By Region:

  • Kanto Region
  • Chubu Region
  • Kinki (Kansai)
  • Kyushu and Okinawa
  • Tohoku

Table of Content

  • 1. Executive Summary
  • 2. Market Overview
  • 3. Market Background
  • 4. Industry Analysis and Outlook 2019 to 2023 and Forecast, 2024 to 2034
  • 5. Industry Analysis and Outlook 2019 to 2023 and Forecast 2024 to 2034, By Product Type
    • 5.1. Vials & Ampoules
    • 5.2. Blisters
    • 5.3. Bottles
      • 5.3.1. Dropper Bottles
      • 5.3.2. Nasal Spray Bottles
      • 5.3.3. Liquid Bottles
    • 5.4. Bags, Pouches & Sachets
      • 5.4.1. IV Bags
      • 5.4.2. Medical Specialty Bags
    • 5.5. Prefilled Inhalers, Syringes & Cartridges
    • 5.6. Containers & Jars
    • 5.7. Caps & Closures
    • 5.8. Trays
    • 5.9. Medication Tubes
  • 6. Industry Analysis and Outlook 2019 to 2023 and Forecast 2024 to 2034, By Material Type
    • 6.1. Polyethylene
      • 6.1.1. Low Density Polyethylene (LDPE)
      • 6.1.2. High Density Polyethylene (HDPE)
      • 6.1.3. Linear Low Density Polyethylene (LLDPE)
    • 6.2. Polyvinyl Chloride
    • 6.3. Polystyrene
    • 6.4. Polypropylene
      • 6.4.1. Bi-axially Oriented Polypropylene
      • 6.4.2. Cast Polypropylene
    • 6.5. Polyethylene Terephthalate
      • 6.5.1. Bi-axially Oriented Polyethylene Terephthalate
      • 6.5.2. Metallized PET
    • 6.6. Others
  • 7. Industry Analysis and Outlook 2019 to 2023 and Forecast 2024 to 2034, By Application
    • 7.1. Medical devices
      • 7.1.1. Sterile packaging
      • 7.1.2. Non sterile packaging
    • 7.2. Pharmaceuticals
  • 8. Industry Analysis and Outlook 2019 to 2023 and Forecast 2024 to 2034, By Region
    • 8.1. Kanto
    • 8.2. Chubu
    • 8.3. Kinki
    • 8.4. Kyushu & Okinawa
    • 8.5. Tohoku
    • 8.6. Rest of Japan
  • 9. Kanto Industry Analysis and Outlook 2019 to 2023 and Forecast 2024 to 2034
  • 10. Chubu Industry Analysis and Outlook 2019 to 2023 and Forecast 2024 to 2034
  • 11. Kinki Industry Analysis and Outlook 2019 to 2023 and Forecast 2024 to 2034
  • 12. Kyushu & Okinawa Industry Analysis and Outlook 2019 to 2023 and Forecast 2024 to 2034
  • 13. Tohoku Industry Analysis and Outlook 2019 to 2023 and Forecast 2024 to 2034
  • 14. Rest of Industry Analysis and Outlook 2019 to 2023 and Forecast 2024 to 2034
  • 15. Market Structure Analysis
  • 16. Competition Analysis
    • 16.1. Rose Plastic
    • 16.2. Nipro Corporation
    • 16.3. Mondi Group
    • 16.4. Adelphi Healthcare Packaging
    • 16.5. Wipak Ltd
    • 16.6. Aptar Group
    • 16.7. West Rock Company
    • 16.8. West Pharmaceutical Services
    • 16.9. McKesson Corporation
    • 16.10. Novio Packaging
  • 17. Assumptions & Acronyms Used
  • 18. Research Methodology

List of Tables

Table 1: Industry Analysis and Outlook Value (US$ Million) Forecast by Region, 2019 to 2034

Table 2: Industry Analysis and Outlook Volume (Units) Forecast by Region, 2019 to 2034

Table 3: Industry Analysis and Outlook Value (US$ Million) Forecast by Product Type, 2019 to 2034

Table 4: Industry Analysis and Outlook Volume (Units) Forecast by Product Type, 2019 to 2034

Table 5: Industry Analysis and Outlook Value (US$ Million) Forecast by Material Type, 2019 to 2034

Table 6: Industry Analysis and Outlook Volume (Units) Forecast by Material Type, 2019 to 2034

Table 7: Industry Analysis and Outlook Value (US$ Million) Forecast by Application, 2019 to 2034

Table 8: Industry Analysis and Outlook Volume (Units) Forecast by Application, 2019 to 2034

Table 9: Kanto Industry Analysis and Outlook Value (US$ Million) Forecast by Product Type, 2019 to 2034

Table 10: Kanto Industry Analysis and Outlook Volume (Units) Forecast by Product Type, 2019 to 2034

Table 11: Kanto Industry Analysis and Outlook Value (US$ Million) Forecast by Material Type, 2019 to 2034

Table 12: Kanto Industry Analysis and Outlook Volume (Units) Forecast by Material Type, 2019 to 2034

Table 13: Kanto Industry Analysis and Outlook Value (US$ Million) Forecast by Application, 2019 to 2034

Table 14: Kanto Industry Analysis and Outlook Volume (Units) Forecast by Application, 2019 to 2034

Table 15: Chubu Industry Analysis and Outlook Value (US$ Million) Forecast by Product Type, 2019 to 2034

Table 16: Chubu Industry Analysis and Outlook Volume (Units) Forecast by Product Type, 2019 to 2034

Table 17: Chubu Industry Analysis and Outlook Value (US$ Million) Forecast by Material Type, 2019 to 2034

Table 18: Chubu Industry Analysis and Outlook Volume (Units) Forecast by Material Type, 2019 to 2034

Table 19: Chubu Industry Analysis and Outlook Value (US$ Million) Forecast by Application, 2019 to 2034

Table 20: Chubu Industry Analysis and Outlook Volume (Units) Forecast by Application, 2019 to 2034

Table 21: Kinki Industry Analysis and Outlook Value (US$ Million) Forecast by Product Type, 2019 to 2034

Table 22: Kinki Industry Analysis and Outlook Volume (Units) Forecast by Product Type, 2019 to 2034

Table 23: Kinki Industry Analysis and Outlook Value (US$ Million) Forecast by Material Type, 2019 to 2034

Table 24: Kinki Industry Analysis and Outlook Volume (Units) Forecast by Material Type, 2019 to 2034

Table 25: Kinki Industry Analysis and Outlook Value (US$ Million) Forecast by Application, 2019 to 2034

Table 26: Kinki Industry Analysis and Outlook Volume (Units) Forecast by Application, 2019 to 2034

Table 27: Kyushu & Okinawa Industry Analysis and Outlook Value (US$ Million) Forecast by Product Type, 2019 to 2034

Table 28: Kyushu & Okinawa Industry Analysis and Outlook Volume (Units) Forecast by Product Type, 2019 to 2034

Table 29: Kyushu & Okinawa Industry Analysis and Outlook Value (US$ Million) Forecast by Material Type, 2019 to 2034

Table 30: Kyushu & Okinawa Industry Analysis and Outlook Volume (Units) Forecast by Material Type, 2019 to 2034

Table 31: Kyushu & Okinawa Industry Analysis and Outlook Value (US$ Million) Forecast by Application, 2019 to 2034

Table 32: Kyushu & Okinawa Industry Analysis and Outlook Volume (Units) Forecast by Application, 2019 to 2034

Table 33: Tohoku Industry Analysis and Outlook Value (US$ Million) Forecast by Product Type, 2019 to 2034

Table 34: Tohoku Industry Analysis and Outlook Volume (Units) Forecast by Product Type, 2019 to 2034

Table 35: Tohoku Industry Analysis and Outlook Value (US$ Million) Forecast by Material Type, 2019 to 2034

Table 36: Tohoku Industry Analysis and Outlook Volume (Units) Forecast by Material Type, 2019 to 2034

Table 37: Tohoku Industry Analysis and Outlook Value (US$ Million) Forecast by Application, 2019 to 2034

Table 38: Tohoku Industry Analysis and Outlook Volume (Units) Forecast by Application, 2019 to 2034

Table 39: Rest of Industry Analysis and Outlook Value (US$ Million) Forecast by Product Type, 2019 to 2034

Table 40: Rest of Industry Analysis and Outlook Volume (Units) Forecast by Product Type, 2019 to 2034

Table 41: Rest of Industry Analysis and Outlook Value (US$ Million) Forecast by Material Type, 2019 to 2034

Table 42: Rest of Industry Analysis and Outlook Volume (Units) Forecast by Material Type, 2019 to 2034

Table 43: Rest of Industry Analysis and Outlook Value (US$ Million) Forecast by Application, 2019 to 2034

Table 44: Rest of Industry Analysis and Outlook Volume (Units) Forecast by Application, 2019 to 2034

List of Figures

Figure 1: Industry Analysis and Outlook Value (US$ Million) by Product Type, 2024 to 2034

Figure 2: Industry Analysis and Outlook Value (US$ Million) by Material Type, 2024 to 2034

Figure 3: Industry Analysis and Outlook Value (US$ Million) by Application, 2024 to 2034

Figure 4: Industry Analysis and Outlook Value (US$ Million) by Region, 2024 to 2034

Figure 5: Industry Analysis and Outlook Value (US$ Million) Analysis by Region, 2019 to 2034

Figure 6: Industry Analysis and Outlook Volume (Units) Analysis by Region, 2019 to 2034

Figure 7: Industry Analysis and Outlook Value Share (%) and BPS Analysis by Region, 2024 to 2034

Figure 8: Industry Analysis and Outlook Y-o-Y Growth (%) Projections by Region, 2024 to 2034

Figure 9: Industry Analysis and Outlook Value (US$ Million) Analysis by Product Type, 2019 to 2034

Figure 10: Industry Analysis and Outlook Volume (Units) Analysis by Product Type, 2019 to 2034

Figure 11: Industry Analysis and Outlook Value Share (%) and BPS Analysis by Product Type, 2024 to 2034

Figure 12: Industry Analysis and Outlook Y-o-Y Growth (%) Projections by Product Type, 2024 to 2034

Figure 13: Industry Analysis and Outlook Value (US$ Million) Analysis by Material Type, 2019 to 2034

Figure 14: Industry Analysis and Outlook Volume (Units) Analysis by Material Type, 2019 to 2034

Figure 15: Industry Analysis and Outlook Value Share (%) and BPS Analysis by Material Type, 2024 to 2034

Figure 16: Industry Analysis and Outlook Y-o-Y Growth (%) Projections by Material Type, 2024 to 2034

Figure 17: Industry Analysis and Outlook Value (US$ Million) Analysis by Application, 2019 to 2034

Figure 18: Industry Analysis and Outlook Volume (Units) Analysis by Application, 2019 to 2034

Figure 19: Industry Analysis and Outlook Value Share (%) and BPS Analysis by Application, 2024 to 2034

Figure 20: Industry Analysis and Outlook Y-o-Y Growth (%) Projections by Application, 2024 to 2034

Figure 21: Industry Analysis and Outlook Attractiveness by Product Type, 2024 to 2034

Figure 22: Industry Analysis and Outlook Attractiveness by Material Type, 2024 to 2034

Figure 23: Industry Analysis and Outlook Attractiveness by Application, 2024 to 2034

Figure 24: Industry Analysis and Outlook Attractiveness by Region, 2024 to 2034

Figure 25: Kanto Industry Analysis and Outlook Value (US$ Million) by Product Type, 2024 to 2034

Figure 26: Kanto Industry Analysis and Outlook Value (US$ Million) by Material Type, 2024 to 2034

Figure 27: Kanto Industry Analysis and Outlook Value (US$ Million) by Application, 2024 to 2034

Figure 28: Kanto Industry Analysis and Outlook Value (US$ Million) Analysis by Product Type, 2019 to 2034

Figure 29: Kanto Industry Analysis and Outlook Volume (Units) Analysis by Product Type, 2019 to 2034

Figure 30: Kanto Industry Analysis and Outlook Value Share (%) and BPS Analysis by Product Type, 2024 to 2034

Figure 31: Kanto Industry Analysis and Outlook Y-o-Y Growth (%) Projections by Product Type, 2024 to 2034

Figure 32: Kanto Industry Analysis and Outlook Value (US$ Million) Analysis by Material Type, 2019 to 2034

Figure 33: Kanto Industry Analysis and Outlook Volume (Units) Analysis by Material Type, 2019 to 2034

Figure 34: Kanto Industry Analysis and Outlook Value Share (%) and BPS Analysis by Material Type, 2024 to 2034

Figure 35: Kanto Industry Analysis and Outlook Y-o-Y Growth (%) Projections by Material Type, 2024 to 2034

Figure 36: Kanto Industry Analysis and Outlook Value (US$ Million) Analysis by Application, 2019 to 2034

Figure 37: Kanto Industry Analysis and Outlook Volume (Units) Analysis by Application, 2019 to 2034

Figure 38: Kanto Industry Analysis and Outlook Value Share (%) and BPS Analysis by Application, 2024 to 2034

Figure 39: Kanto Industry Analysis and Outlook Y-o-Y Growth (%) Projections by Application, 2024 to 2034

Figure 40: Kanto Industry Analysis and Outlook Attractiveness by Product Type, 2024 to 2034

Figure 41: Kanto Industry Analysis and Outlook Attractiveness by Material Type, 2024 to 2034

Figure 42: Kanto Industry Analysis and Outlook Attractiveness by Application, 2024 to 2034

Figure 43: Chubu Industry Analysis and Outlook Value (US$ Million) by Product Type, 2024 to 2034

Figure 44: Chubu Industry Analysis and Outlook Value (US$ Million) by Material Type, 2024 to 2034

Figure 45: Chubu Industry Analysis and Outlook Value (US$ Million) by Application, 2024 to 2034

Figure 46: Chubu Industry Analysis and Outlook Value (US$ Million) Analysis by Product Type, 2019 to 2034

Figure 47: Chubu Industry Analysis and Outlook Volume (Units) Analysis by Product Type, 2019 to 2034

Figure 48: Chubu Industry Analysis and Outlook Value Share (%) and BPS Analysis by Product Type, 2024 to 2034

Figure 49: Chubu Industry Analysis and Outlook Y-o-Y Growth (%) Projections by Product Type, 2024 to 2034

Figure 50: Chubu Industry Analysis and Outlook Value (US$ Million) Analysis by Material Type, 2019 to 2034

Figure 51: Chubu Industry Analysis and Outlook Volume (Units) Analysis by Material Type, 2019 to 2034

Figure 52: Chubu Industry Analysis and Outlook Value Share (%) and BPS Analysis by Material Type, 2024 to 2034

Figure 53: Chubu Industry Analysis and Outlook Y-o-Y Growth (%) Projections by Material Type, 2024 to 2034

Figure 54: Chubu Industry Analysis and Outlook Value (US$ Million) Analysis by Application, 2019 to 2034

Figure 55: Chubu Industry Analysis and Outlook Volume (Units) Analysis by Application, 2019 to 2034

Figure 56: Chubu Industry Analysis and Outlook Value Share (%) and BPS Analysis by Application, 2024 to 2034

Figure 57: Chubu Industry Analysis and Outlook Y-o-Y Growth (%) Projections by Application, 2024 to 2034

Figure 58: Chubu Industry Analysis and Outlook Attractiveness by Product Type, 2024 to 2034

Figure 59: Chubu Industry Analysis and Outlook Attractiveness by Material Type, 2024 to 2034

Figure 60: Chubu Industry Analysis and Outlook Attractiveness by Application, 2024 to 2034

Figure 61: Kinki Industry Analysis and Outlook Value (US$ Million) by Product Type, 2024 to 2034

Figure 62: Kinki Industry Analysis and Outlook Value (US$ Million) by Material Type, 2024 to 2034

Figure 63: Kinki Industry Analysis and Outlook Value (US$ Million) by Application, 2024 to 2034

Figure 64: Kinki Industry Analysis and Outlook Value (US$ Million) Analysis by Product Type, 2019 to 2034

Figure 65: Kinki Industry Analysis and Outlook Volume (Units) Analysis by Product Type, 2019 to 2034

Figure 66: Kinki Industry Analysis and Outlook Value Share (%) and BPS Analysis by Product Type, 2024 to 2034

Figure 67: Kinki Industry Analysis and Outlook Y-o-Y Growth (%) Projections by Product Type, 2024 to 2034

Figure 68: Kinki Industry Analysis and Outlook Value (US$ Million) Analysis by Material Type, 2019 to 2034

Figure 69: Kinki Industry Analysis and Outlook Volume (Units) Analysis by Material Type, 2019 to 2034

Figure 70: Kinki Industry Analysis and Outlook Value Share (%) and BPS Analysis by Material Type, 2024 to 2034

Figure 71: Kinki Industry Analysis and Outlook Y-o-Y Growth (%) Projections by Material Type, 2024 to 2034

Figure 72: Kinki Industry Analysis and Outlook Value (US$ Million) Analysis by Application, 2019 to 2034

Figure 73: Kinki Industry Analysis and Outlook Volume (Units) Analysis by Application, 2019 to 2034

Figure 74: Kinki Industry Analysis and Outlook Value Share (%) and BPS Analysis by Application, 2024 to 2034

Figure 75: Kinki Industry Analysis and Outlook Y-o-Y Growth (%) Projections by Application, 2024 to 2034

Figure 76: Kinki Industry Analysis and Outlook Attractiveness by Product Type, 2024 to 2034

Figure 77: Kinki Industry Analysis and Outlook Attractiveness by Material Type, 2024 to 2034

Figure 78: Kinki Industry Analysis and Outlook Attractiveness by Application, 2024 to 2034

Figure 79: Kyushu & Okinawa Industry Analysis and Outlook Value (US$ Million) by Product Type, 2024 to 2034

Figure 80: Kyushu & Okinawa Industry Analysis and Outlook Value (US$ Million) by Material Type, 2024 to 2034

Figure 81: Kyushu & Okinawa Industry Analysis and Outlook Value (US$ Million) by Application, 2024 to 2034

Figure 82: Kyushu & Okinawa Industry Analysis and Outlook Value (US$ Million) Analysis by Product Type, 2019 to 2034

Figure 83: Kyushu & Okinawa Industry Analysis and Outlook Volume (Units) Analysis by Product Type, 2019 to 2034

Figure 84: Kyushu & Okinawa Industry Analysis and Outlook Value Share (%) and BPS Analysis by Product Type, 2024 to 2034

Figure 85: Kyushu & Okinawa Industry Analysis and Outlook Y-o-Y Growth (%) Projections by Product Type, 2024 to 2034

Figure 86: Kyushu & Okinawa Industry Analysis and Outlook Value (US$ Million) Analysis by Material Type, 2019 to 2034

Figure 87: Kyushu & Okinawa Industry Analysis and Outlook Volume (Units) Analysis by Material Type, 2019 to 2034

Figure 88: Kyushu & Okinawa Industry Analysis and Outlook Value Share (%) and BPS Analysis by Material Type, 2024 to 2034

Figure 89: Kyushu & Okinawa Industry Analysis and Outlook Y-o-Y Growth (%) Projections by Material Type, 2024 to 2034

Figure 90: Kyushu & Okinawa Industry Analysis and Outlook Value (US$ Million) Analysis by Application, 2019 to 2034

Figure 91: Kyushu & Okinawa Industry Analysis and Outlook Volume (Units) Analysis by Application, 2019 to 2034

Figure 92: Kyushu & Okinawa Industry Analysis and Outlook Value Share (%) and BPS Analysis by Application, 2024 to 2034

Figure 93: Kyushu & Okinawa Industry Analysis and Outlook Y-o-Y Growth (%) Projections by Application, 2024 to 2034

Figure 94: Kyushu & Okinawa Industry Analysis and Outlook Attractiveness by Product Type, 2024 to 2034

Figure 95: Kyushu & Okinawa Industry Analysis and Outlook Attractiveness by Material Type, 2024 to 2034

Figure 96: Kyushu & Okinawa Industry Analysis and Outlook Attractiveness by Application, 2024 to 2034

Figure 97: Tohoku Industry Analysis and Outlook Value (US$ Million) by Product Type, 2024 to 2034

Figure 98: Tohoku Industry Analysis and Outlook Value (US$ Million) by Material Type, 2024 to 2034

Figure 99: Tohoku Industry Analysis and Outlook Value (US$ Million) by Application, 2024 to 2034

Figure 100: Tohoku Industry Analysis and Outlook Value (US$ Million) Analysis by Product Type, 2019 to 2034

Figure 101: Tohoku Industry Analysis and Outlook Volume (Units) Analysis by Product Type, 2019 to 2034

Figure 102: Tohoku Industry Analysis and Outlook Value Share (%) and BPS Analysis by Product Type, 2024 to 2034

Figure 103: Tohoku Industry Analysis and Outlook Y-o-Y Growth (%) Projections by Product Type, 2024 to 2034

Figure 104: Tohoku Industry Analysis and Outlook Value (US$ Million) Analysis by Material Type, 2019 to 2034

Figure 105: Tohoku Industry Analysis and Outlook Volume (Units) Analysis by Material Type, 2019 to 2034

Figure 106: Tohoku Industry Analysis and Outlook Value Share (%) and BPS Analysis by Material Type, 2024 to 2034

Figure 107: Tohoku Industry Analysis and Outlook Y-o-Y Growth (%) Projections by Material Type, 2024 to 2034

Figure 108: Tohoku Industry Analysis and Outlook Value (US$ Million) Analysis by Application, 2019 to 2034

Figure 109: Tohoku Industry Analysis and Outlook Volume (Units) Analysis by Application, 2019 to 2034

Figure 110: Tohoku Industry Analysis and Outlook Value Share (%) and BPS Analysis by Application, 2024 to 2034

Figure 111: Tohoku Industry Analysis and Outlook Y-o-Y Growth (%) Projections by Application, 2024 to 2034

Figure 112: Tohoku Industry Analysis and Outlook Attractiveness by Product Type, 2024 to 2034

Figure 113: Tohoku Industry Analysis and Outlook Attractiveness by Material Type, 2024 to 2034

Figure 114: Tohoku Industry Analysis and Outlook Attractiveness by Application, 2024 to 2034

Figure 115: Rest of Industry Analysis and Outlook Value (US$ Million) by Product Type, 2024 to 2034

Figure 116: Rest of Industry Analysis and Outlook Value (US$ Million) by Material Type, 2024 to 2034

Figure 117: Rest of Industry Analysis and Outlook Value (US$ Million) by Application, 2024 to 2034

Figure 118: Rest of Industry Analysis and Outlook Value (US$ Million) Analysis by Product Type, 2019 to 2034

Figure 119: Rest of Industry Analysis and Outlook Volume (Units) Analysis by Product Type, 2019 to 2034

Figure 120: Rest of Industry Analysis and Outlook Value Share (%) and BPS Analysis by Product Type, 2024 to 2034

Figure 121: Rest of Industry Analysis and Outlook Y-o-Y Growth (%) Projections by Product Type, 2024 to 2034

Figure 122: Rest of Industry Analysis and Outlook Value (US$ Million) Analysis by Material Type, 2019 to 2034

Figure 123: Rest of Industry Analysis and Outlook Volume (Units) Analysis by Material Type, 2019 to 2034

Figure 124: Rest of Industry Analysis and Outlook Value Share (%) and BPS Analysis by Material Type, 2024 to 2034

Figure 125: Rest of Industry Analysis and Outlook Y-o-Y Growth (%) Projections by Material Type, 2024 to 2034

Figure 126: Rest of Industry Analysis and Outlook Value (US$ Million) Analysis by Application, 2019 to 2034

Figure 127: Rest of Industry Analysis and Outlook Volume (Units) Analysis by Application, 2019 to 2034

Figure 128: Rest of Industry Analysis and Outlook Value Share (%) and BPS Analysis by Application, 2024 to 2034

Figure 129: Rest of Industry Analysis and Outlook Y-o-Y Growth (%) Projections by Application, 2024 to 2034

Figure 130: Rest of Industry Analysis and Outlook Attractiveness by Product Type, 2024 to 2034

Figure 131: Rest of Industry Analysis and Outlook Attractiveness by Material Type, 2024 to 2034

Figure 132: Rest of Industry Analysis and Outlook Attractiveness by Application, 2024 to 2034

Frequently Asked Questions

What is the forecasted value for the plastic healthcare packaging industry in Japan in 2024?

The plastic healthcare packaging industry in Japan is poised to be valued at USD 796.3 million in 2024.

At What rate is the plastic healthcare packaging industry growing in Japan?

The anticipated CAGR for plastic healthcare packaging through 2034 is 4.30%.

How big will the plastic healthcare packaging industry be in Japan?

Demand for plastic healthcare packaging in Japan will be USD 1,213.20 million by 2034.

Based on material, which segment drives the plastic healthcare packaging in Japan?

Polypropylene material remains the top segment in the plastic healthcare packaging industry in Japan

Explore Healthcare Packaging Insights

Future Market Insights

Plastic Healthcare Packaging Industry Analysis in Japan