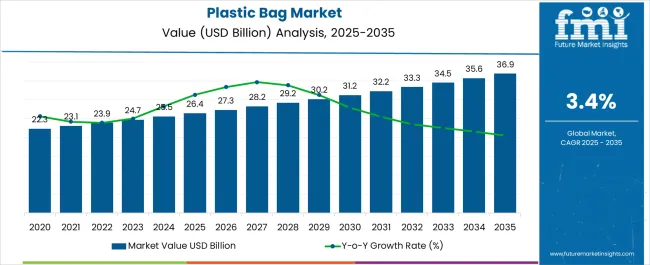
The Plastic Bag Market is estimated to be valued at USD 26.4 billion in 2025 and is projected to reach USD 36.9 billion by 2035, registering a compound annual growth rate (CAGR) of 3.4% over the forecast period.
| Metric | Value |
|---|---|
| Plastic Bag Market Estimated Value in (2025 E) | USD 26.4 billion |
| Plastic Bag Market Forecast Value in (2035 F) | USD 36.9 billion |
| Forecast CAGR (2025 to 2035) | 3.4% |
The plastic bag market is witnessing consistent demand across retail, foodservice, and household applications. Current dynamics are being shaped by cost efficiency, widespread availability, and adaptability of plastic bags to diverse usage requirements. Regulatory pressures regarding sustainability and waste management are influencing product innovations and recycling initiatives, while consumer awareness of eco-friendly practices is prompting shifts in material selection.
Polyethylene-based bags continue to dominate due to their durability and affordability, though alternative materials are being explored to align with environmental targets. The future outlook is supported by steady consumption in emerging economies where retail and packaged food penetration is rising, alongside modernization of supply chains.
Growth rationale is founded on the scalability of production, logistical convenience, and the ability of manufacturers to align product offerings with both mass-market affordability and sustainability-driven reforms This balance between operational efficiency and regulatory compliance is expected to underpin stable growth and maintain the market’s relevance in both developed and developing regions.
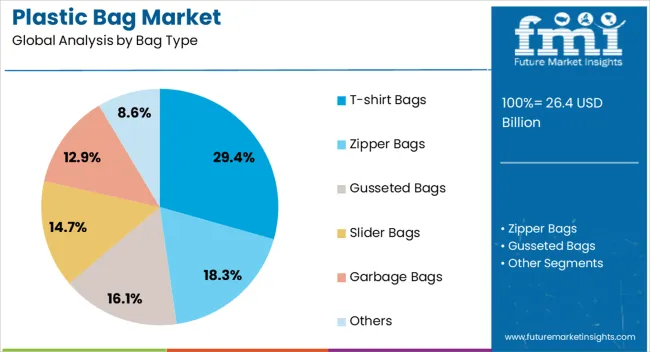
The T-shirt bags segment, representing 29.40% of the bag type category, has maintained its leadership due to high-volume consumption in retail and grocery formats. Its dominance is supported by low production cost, ease of manufacturing, and functional advantages such as portability and load-bearing capacity.
Retailers and distributors continue to favor T-shirt bags due to their flexibility in size and thickness customization. Widespread adoption in emerging markets, combined with large-scale procurement by organized retail, is sustaining demand.
Despite rising environmental scrutiny, recycling initiatives and biodegradable variants have provided resilience to the segment Ongoing demand in both traditional and modern trade is expected to maintain its share, while incremental innovations in eco-friendly designs are anticipated to reinforce long-term adoption.
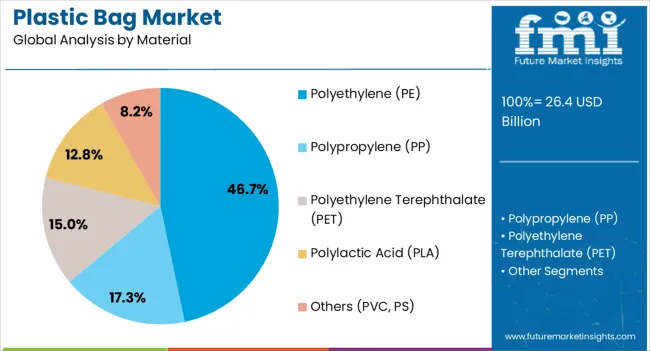
The polyethylene segment, holding 46.70% of the material category, has emerged as the leading choice owing to its durability, versatility, and cost-effectiveness. Its continued usage is supported by high adaptability in manufacturing processes and compatibility with multiple printing and packaging requirements.
Polyethylene bags provide advantages in terms of strength-to-weight ratio and moisture resistance, making them suitable across diverse end-use industries. The segment’s growth has been stabilized by strong global supply chains for raw materials and established processing technologies.
Increasing regulatory frameworks have pushed for recycling and waste reduction, prompting the development of high-recycled-content PE bags This transition is reinforcing consumer and retailer acceptance while maintaining cost competitiveness, ensuring polyethylene remains central to market dynamics.
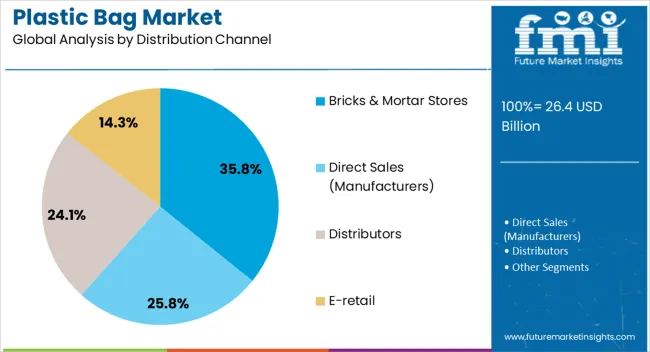
The bricks and mortar stores segment, accounting for 35.80% of the distribution channel category, has sustained its lead due to the direct consumption of plastic bags in physical retail outlets. Supermarkets, convenience stores, and local retailers continue to rely on bulk procurement of plastic bags to meet daily customer requirements.
The segment’s prominence is reinforced by stable consumer footfall in offline retail and the integral role of bags as point-of-sale packaging solutions. Retailers favor plastic bags for their cost-efficiency, immediate availability, and ease of storage.
While digital commerce is expanding, the physical retail channel remains a key demand driver, especially in urban and semi-urban regions Continued growth in organized retail chains and sustained reliance on offline shopping in emerging markets are expected to support the segment’s share over the forecast period.
Market to Expand Around 1.4X through 2035
The global market for plastic bags is forecast to expand around 1.4X through 2035, amid a 0.7% increase in estimated CAGR compared to the historical one. This is due to the robust growth of the retail sector, the high popularity of biodegradable plastic bags, and the increasing usage of plastic bags in households.
Other Factors Expected to Drive Demand for Plastic Bags Include
Key Trends in the Plastic Bag Market Include-
North America and East Asia Remain Leading Markets
North America and East Asia are projected to remain the leading consumers of plastic bags globally. As per the latest analysis, East and North America are set to cumulatively hold around 39.4% share of the global plastic bag industry in 2035.
It is due to factors such as the exponential growth of end-use industries, including retail, pharmaceutical, and food & beverage. The growing demand for eco-friendly plastic bags and the increasing usage of retail packaging bags are also projected to aid sales.
The United States is expected to dominate the global plastic bag market. On the other hand, countries such as India and China are set to emerge as highly lucrative markets for plastic bag manufacturers. This is owing to rapid population growth, urbanization, surging demand for packaged food, and rising disposable income.
Key Manufacturers Utilize Eco-friendly Materials to Cope with Regulations
Both manufacturers and consumers are becoming more aware of the environmental impact of plastic bags. This has prompted them to look for eco-friendly alternatives. To walk with this trend, key manufacturers are utilizing sustainable materials to develop eco-friendly and biodegradable plastic bags.
Several countries are also implementing initiatives and regulations to promote sustainability and reduce plastic waste. This is projected to create a high demand for biodegradable plastic bags.
The global plastic bag market is set to register a CAGR of 3.4% from 2025 to 2035. This will represent a significant acceleration from the 2.7% CAGR seen during the 2020 to 2025 period.
| Historical CAGR (2020 to 2025) | 2.7% |
|---|---|
| Forecast CAGR (2025 to 2035) | 3.4% |
Over the years, plastic bags have evolved tremendously and have widespread use in everyday life. They are convenient, cost-effective, and one of the most reliable options for packaging across several end-use industries.
According to Plastic Oceans International, each year, it is estimated that around 500 billion plastic bags are used globally, and over one million bags are used every minute. This is providing a strong impetus for the growth of the global plastic bag market.
With less than 9% of plastic being recycled, plastic bags have a tremendous negative impact on the environment. Due to this, over the past two decades, manufacturers and end users have increasingly shifted to biodegradable plastics. Moreover, the packaging sector has seen continuous innovation in terms of plastic biodegradability.
New innovations are being developed to cope with the plastic problem. For instance, in April 2024, the University of California invented a way to make compostable plastics break down more easily using only heat and water through the incorporation of polyester-eating enzymes in the plastic.
Technological advancements in part, processing, and materials have also facilitated the creation of environmentally friendly and biodegradable bags. To this end, manufacturers of plastic bags are also taking initiatives to promote this trend.
There has been an upward trend in the consumption of fast food in recent years owing to several factors, such as changing lifestyles and transforming demographic structure. Several fast-food chains are consistently recording growth in revenue owing to this trend. This rising demand for fast food, especially in takeaway format, is expected to push the market for plastic bags forward.
The burgeoning e-commerce and online grocery delivery sector is another key factor driving demand for plastic bags. Several delivery platforms are sticking with recyclable plastic bags owing to the additional cost associated with reusable and paper bags. All these factors will boost the market in the forecast period.
Semi-annual Market Update
| Particular | Value CAGR |
|---|---|
| H1 | 3.2% (2025 to 2035) |
| H2 | 3.0% (2025 to 2035) |
| H1 | 3.7% (2025 to 2035) |
| H2 | 3.5% (2025 to 2035) |
Rising Convenience Packaging Demand to Boost Growth
The demand for convenience packaging, characterized by user-friendly design and easy accessibility, has surged in recent years. This is benefitting the business landscape across several industries, including plastic packaging since it is a key raw material for the manufacturing of lightweight and easy-to-use bags.
Increasing population and urbanization, rising disposable income, and improving standards of living in developing countries are factors contributing significantly to the growing demand for convenience packaging. This is consequently impacting plastic bag sales.
For instance, as per the Organization for Economic Co-operation and Development (OECD), real household income increased by 0.2% across the OECD countries in the third quarter of 2025.
Similarly, the world population is experiencing rapid growth and is expected to rise by over 20% in the next 30 years, as per data from the United Nations (UN). This growth is expected to drive consumption and consequently push the demand for plastic bags.
Outline of Key Trends in the Plastic Bag Market Shaping Growth
Several manufacturers are actively incorporating post-consumer resin (PCR) materials to produce different types of products. The integration of PCR into plastic bags, whether for applications involving food or non-food items, is slowly taking shape as several manufacturers are utilizing this material to achieve sustainability goals.
For instance,
The table below shows the anticipated growth rates of the top countries. India, China, and Japan are set to record lucrative CAGRs of 4.3%, 3.5%, and 3.9%, respectively, through 2035.
| Countries | Value CAGR |
|---|---|
| United States | 2.3% |
| Germany | 2.0% |
| United Kingdom | 2.4% |
| Japan | 3.9% |
| China | 3.5% |
| India | 4.3% |
India’s plastic bag market value is estimated to reach USD 2,853.5 million by 2035. Demand for plastic bags in the country is predicted to rise at a CAGR of 4.3% during the forecast period. This is attributable to the rising usage of plastic bags across India’s thriving retail sector.
According to the India Brand Equity Foundation (IBEF), India’s retail industry is projected to surge by 9% from 2020 to 2035. It will attain a valuation of USD 1,407 million in 2029 and over USD 1.8 trillion by 2035. This will create growth opportunities for plastic bag manufacturers as these bags are often utilized for packaging products in the retail sector.
India has the third-leading number of e-retail shoppers. The retail industry in India will be supported by increasing urbanization, rising income, and favorable demographics, thereby expanding sales of plastic bags in the country.
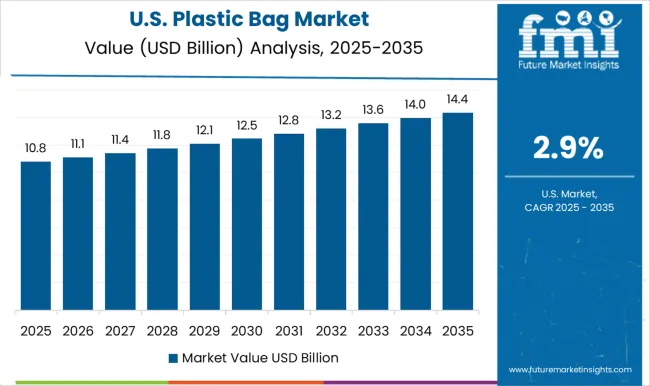
The United States plastic bag market size is predicted to reach USD 4,215.7 million by 2035. Over the projection period, sales of plastic bags in the United States are likely to soar at a 2.3% CAGR. This is due to the growing demand for convenience and the expansion of e-commerce.
Plastic bags are an affordable and convenient packaging solution used for applications such as food, waste disposal, and retail. This convenience is leading to a rising demand for plastic bags from businesses and consumers in the United States.
Another prominent factor expected to boost sales and improve the United States plastic bag market share is the innovations in materials. Continuous research in material science is leading to the development of novel biodegradable and compostable plastics. The rising adoption of these eco-friendly materials could affect the market landscape in the United States.
Japan’s plastic bag market revenue is projected to increase at a 3.9% CAGR, totaling USD 2,857.5 million by 2035. This can be attributed to the rising preference for sustainable plastic bags and increasing government initiatives to promote sustainability.
The government of Japan is launching several initiatives to promote sustainable packaging solutions, including compostable and biodegradable plastic bags. This is expected to boost the plastic bag industry in the country during the forecast period.
The increasing popularity of online grocery is another key factor impacting sales of plastic bags in Japan. People in the country are showing an inclination toward purchasing products through online grocery stores.
This will likely fuel the demand for grocery bags or plastic carry bags as they are widely used for packaging and shipping groceries.
China is anticipated to dominate the East Asia plastic bag market during the forecast period. It is expected to attain a valuation of USD 3,687.6 million in 2035. Over the assessment period, the demand for plastic bags in China is slated to surge at a 3.5% CAGR.
Several factors are expected to drive the demand for plastic bags in the country. These include rapid growth of the food & beverage industry, surging demand for packaged food items, and increasing import/export business.
In China, the food & beverage industry is the leading consumer of plastic bags. Rapid urbanization, changing eating habits, and economic growth are creating a high demand for packaged foods and beverages in China. This is anticipated to fuel sales of plastic bags.
The United Kingdom’s plastic bag industry is projected to thrive at a steady CAGR of 2.4% during the assessment period. Plastic bag sales in the country are predicted to total USD 902.7 million in 2035.
The growing usage of plastic bags in households, hotels, and restaurants is expected to boost the United Kingdom’s plastic bag market growth. Similarly, the rising popularity of biodegradable, compostable, and recyclable plastic bags is set to fuel sales in the country through 2035.
Based on material, the polyethylene segment is anticipated to retain its dominance through 2035. It will likely exhibit a CAGR of 3.1% between 2025 and 2035. The retail segment is expected to hold a prominent value share by 2035. It is poised to exhibit a CAGR of 2.8% during the assessment period.
| Material | Value CAGR |
|---|---|
| Polyethylene (PE) | 3.1% |
| Polyethylene Terephthalate (PET) | 4.3% |
As per the latest plastic bag market analysis, polyethylene remains the most widely used material by manufacturers for producing plastic bags. This is due to its flexibility, water resistance, high strength, durability, and low cost.
Polyethylene (PE) is a versatile material that can be molded into multiple sizes and shapes. Polyethylene bags do not break or tear easily and can withstand the weight of groceries and other products. These bags are set to witness high demand due to their cost-effectiveness and lightweight nature.
The growing inclination of end users toward using polyethylene bags will further boost the target segment. As a result, the polyethylene segment is set to thrive at a 3.1% CAGR, reaching USD 21,137 million by 2035.
| End-use | Value CAGR |
|---|---|
| Retail | 2.8% |
| Household | 5.2% |
Plastic bags are popular in the retail sector, providing a cost-effective and convenient packaging solution. The ongoing expansion of the food service and e-commerce sectors is expected to push up the consumption of plastic bags, thereby fostering growth.
Plastic bags can also be customized with the retailer’s logo and promotional messages, which will help to increase brand visibility and enable companies to stand out among their competitors.
The retail segment is estimated to account for a share of 42.4% in 2035. It will likely expand at a 2.8% CAGR, totaling USD 14,598.1 million by 2035.
The household segment, on the other hand, is anticipated to witness a higher CAGR of 5.2% throughout the forecast period. This is attributable to the rising usage of plastic bags in households for different purposes.
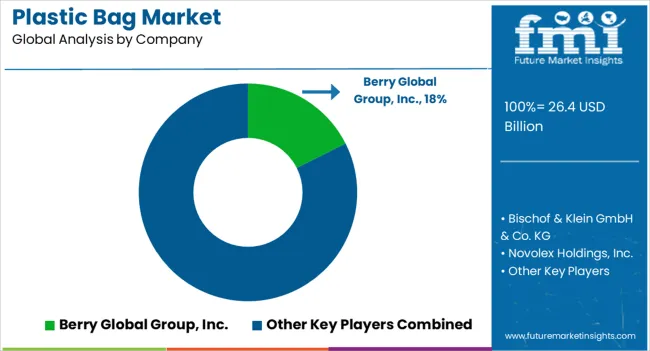
Top manufacturers of plastic bags are focusing on developing innovations and advancements to stay relevant in the market. They are implementing strategies such as mergers, acquisitions, partnerships, collaborations, and price reductions to boost their revenue and strengthen their presence.
Recent Developments in the Plastic Bag Market
| Attribute | Details |
|---|---|
| Estimated Market Value (20253) | USD 26.4 billion |
| Projected Market Size (2035) | USD 36.9 billion |
| Anticipated Growth Rate (2025 to 2035) | 3.4% CAGR |
| Historical Data | 2020 to 2025 |
| Forecast Period | 2025 to 2035 |
| Quantitative Units | Value (USD million) |
| Report Coverage | Revenue Forecast, Volume Forecast, Company Ranking, Competitive Landscape, Growth Factors, Trends and Pricing Analysis |
| Segments Covered | By Bag Type, By Material, By Distribution Channel, By End-use, By Region |
| Key Companies Profiled | Berry Global Group, Inc.; Bischof & Klein GmbH & Co. KG; Novolex Holdings, Inc.; International Plastic Inc.; AEP Industries Inc.; ProAmpac LLC; CeDo Ltd.; Amcor Plc; Sonoco Products Company; Mondi Plc; Reynolds Consumer Products Inc.; Transcontinental Inc.; RKW Group; 3M; Thantawan Industry Plc.; Flair Flexible Packaging Corporation; Inteplast Group; Dagöplast AS; Allstate Plastics LLC; Novplasta s.r.o. |
The global plastic bag market is estimated to be valued at USD 26.4 billion in 2025.
The market size for the plastic bag market is projected to reach USD 36.9 billion by 2035.
The plastic bag market is expected to grow at a 3.4% CAGR between 2025 and 2035.
The key product types in plastic bag market are t-shirt bags, zipper bags, gusseted bags, slider bags, garbage bags and others.
In terms of material, polyethylene (pe) segment to command 46.7% share in the plastic bag market in 2025.


Full Research Suite comprises of:
Market outlook & trends analysis
Interviews & case studies
Strategic recommendations
Vendor profiles & capabilities analysis
5-year forecasts
8 regions and 60+ country-level data splits
Market segment data splits
12 months of continuous data updates
DELIVERED AS:
PDF EXCEL ONLINE
Plastic Blood Bags Market
Bioplastic Packaging Bag Market Growth – Demand & Forecast 2025 to 2035
Industrial Plastic Bags Market from 2025 to 2035
Plastic Tubes for Effervescent Tablets Market Size and Share Forecast Outlook 2025 to 2035
Plastic Banding Market Size and Share Forecast Outlook 2025 to 2035
Plastic Tube Market Size and Share Forecast Outlook 2025 to 2035
Plastic Jar Packaging Market Forecast and Outlook 2025 to 2035
Plastic Cases Market Size and Share Forecast Outlook 2025 to 2035
Plastic Jar Industry Analysis in the United States Size and Share Forecast Outlook 2025 to 2035
Plastic Cutlery Market Forecast and Outlook 2025 to 2035
Plastic Vial Market Forecast and Outlook 2025 to 2035
Plastic Hot and Cold Pipe Market Forecast and Outlook 2025 to 2035
Plastic Retort Can Market Size and Share Forecast Outlook 2025 to 2035
Plastic Gears Market Size and Share Forecast Outlook 2025 to 2035
Plastic Additive Market Size and Share Forecast Outlook 2025 to 2035
Plastic Market Size and Share Forecast Outlook 2025 to 2035
Plastic Vials and Ampoules Market Size and Share Forecast Outlook 2025 to 2035
Plastic Healthcare Packaging Market Size and Share Forecast Outlook 2025 to 2035
Plastic Bottle Industry Analysis in Malaysia Size and Share Forecast Outlook 2025 to 2035
Plastic Drum Industry Analysis in Malaysia Size and Share Forecast Outlook 2025 to 2035

Thank you!
You will receive an email from our Business Development Manager. Please be sure to check your SPAM/JUNK folder too.
Chat With
MaRIA