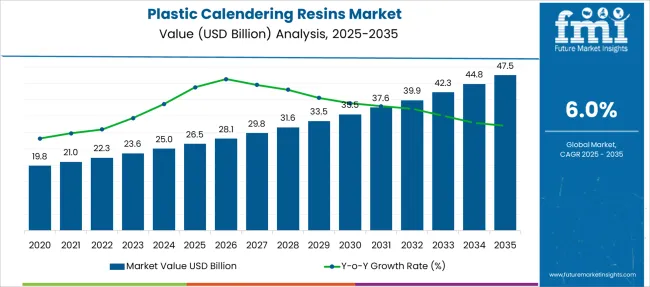
The Plastic Calendering Resins Market is estimated to be valued at USD 26.5 billion in 2025 and is projected to reach USD 47.5 billion by 2035, registering a compound annual growth rate (CAGR) of 6.0% over the forecast period.
| Metric | Value |
|---|---|
| Plastic Calendering Resins Market Estimated Value in (2025 E) | USD 26.5 billion |
| Plastic Calendering Resins Market Forecast Value in (2035 F) | USD 47.5 billion |
| Forecast CAGR (2025 to 2035) | 6.0% |
The plastic calendering resins market is experiencing consistent growth driven by the rising demand for high-performance, cost-effective, and durable plastic materials across packaging, construction, and consumer goods industries. Increasing reliance on flexible and semi-rigid plastic films in food safety, hygiene products, and interior automotive components is propelling market interest in calendering processes.
Manufacturers are favoring calendered resins for their excellent dimensional stability, optical clarity, and controlled thickness. Technological advancements in plastic formulation and calendering equipment are enabling higher production efficiency and improved product characteristics.
Regulatory developments encouraging phthalate-free and food-contact-compliant materials are influencing innovation in this space. The market outlook remains positive, supported by global trends in sustainable packaging, product standardization, and downstream processing flexibility.
The market is segmented by Type and End Use and region. By Type, the market is divided into Polyvinyl Chloride (PVC), Polyethylene Terephthalate (PET), Polypropylene (PP), Polyethylene Terephthalate Glycol (PETG), and Others. In terms of End Use, the market is classified into Food & Beverages, Automotive, Healthcare & Medical, Electrical & Electronics, Construction & Buildings, Furniture & Furniture Trim, and Others. Regionally, the market is classified into North America, Latin America, Western Europe, Eastern Europe, Balkan & Baltic Countries, Russia & Belarus, Central Asia, East Asia, South Asia & Pacific, and the Middle East & Africa.
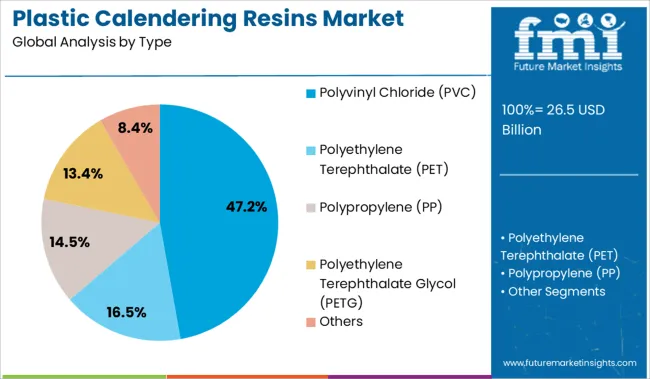
The polyvinyl chloride type segment is projected to account for 47.20% of total market revenue by 2025, making it the dominant material used in calendering applications. Its leading position is driven by exceptional flexibility, chemical resistance, and ease of processing, which make it highly suitable for flooring, wall coverings, and protective films.
The material’s compatibility with plasticizers and stabilizers allows manufacturers to tailor products for diverse industrial needs. Moreover, the cost-effectiveness of PVC combined with its recyclability has increased its adoption across both developed and emerging markets.
As industries prioritize durability and versatility in plastic films and sheets, the use of PVC in calendered resin applications continues to expand, reinforcing its role as the leading type.
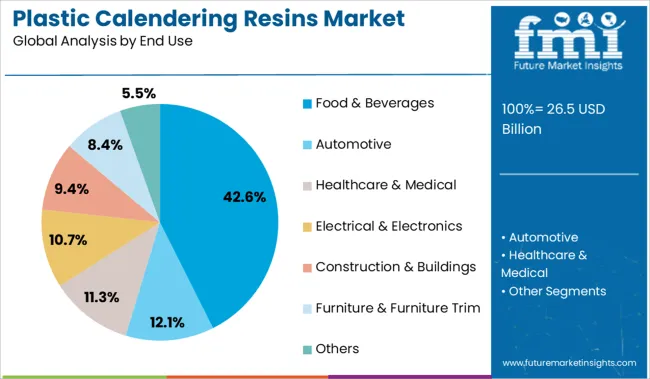
The food and beverages segment is expected to capture 42.60% of the total market revenue by 2025 under the end use category, establishing it as the foremost application. Growth in this segment is attributed to the rising global demand for hygienic, flexible packaging materials that ensure product integrity and extend shelf life.
Calendered plastic films are widely used for food wraps, container linings, and sealing layers due to their clarity, barrier properties, and compliance with food safety standards. The segment is also benefiting from the expansion of ready-to-eat meal formats, online grocery platforms, and sustainability initiatives that promote the use of lightweight yet durable packaging.
This convergence of consumer trends, regulatory pressure, and technological progress has positioned food and beverages as the primary end use sector in the plastic calendering resins market.
The global Plastic Calendering Resins market garnered USD 26.5 Billion in 2025, expanding at a historical CAGR of 4%. The COVID-19 pandemic had a negative impact on the market for plastic calendering resins.
The pandemic led to the sealing of national borders and the temporary shutdown of industries and markets in 2024. There was a huge spike in the demand from the medical industry, which turned out to be positive for this industry.
The disruption in global supply chains negatively impacted the sales of other plastic products, transportation, and supply of raw materials, which led to a drop in sales of construction and automotive products, thereby leading to a reduction of plastic calendering resins demand from these sectors.
However, plastic calendering resins witnessed a recovery in demand in 2025, and the market is expected to witness significant growth over the forecast period. The estimation reveals that the industry is projected to secure a market value of USD 47.5 Billion by 2035.
Growing Technological Advancements and Financial Investments to Aid Market Growth
The ongoing Research and Development and technological developments in the field of plastic calendering resins and the widespread adoption of and need for calendered resins across various sectors are expected to drive the market in the coming future.
Moreover, there is an increasing need for lightweight, durable, flexible, high abrasion resistance, and easily recyclable material, which is one of the major factors driving the demand for plastic calendering resins.
The fluctuating crude oil prices also have an impact on the plastic calendering resins industry. The cost of plastic calendering resin manufacturing is high because of the process involved in converting crude oil into plastic resins with the help of additives. Furthermore, rising awareness regarding sustainable living has forced manufacturers to develop recycled plastic resins and focus on Research and Development activities.
In November 2024, SK Chemicals began mass production of its first chemical recycling copolyester, named ECOTRIA CR, with the help of plastic waste recycling technology. The new technology is expected to help the company to be ahead of its competitors and capture market share.
Regulations Pertaining to Plastic Usage to Hinder Market Growth
The volatile raw material prices and easy availability of various packaging materials used in the packaging sector are expected to act as major restraining factors towards the growth of the market. In addition to this, strict regulatory policies pertaining to plastic usage and the pressure of cutting prices can challenge market growth over the forecast period.
Presence of Key Players in the Region to Increase Consumer Demand
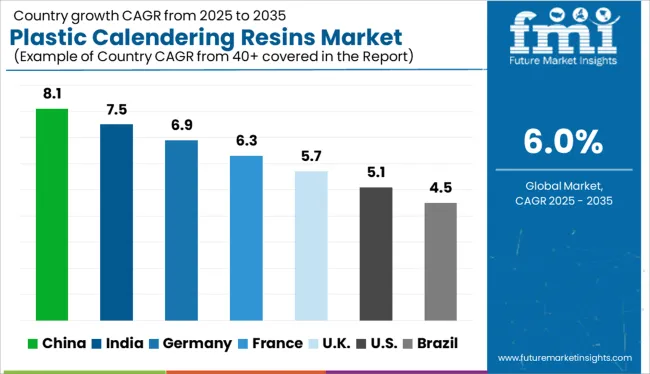
North America is expected to grow over the forecast period owing to the use of plastic in End-uses and plastic waste generation in the region. Factors such as the presence of major market players, the availability of raw materials, and the high adoption of advanced technologies are the key factors driving the market in the region.
Increasing Investments to Develop Packaging to Boost Regional Market
Asia Pacific accounted for the largest revenue share of over 30.0% in 2025 and is anticipated to expand at the highest CAGR over the forecast period. The region is expected to dominate the packaging segment in the coming years. The packaging industry’s growth is primarily driven by the food & beverage segment due to the rising population in the country, significant disposable incomes, and changes in food habits.
Food & Beverage Segment to Dominate the Category
The food & beverages segment accounted for the largest share of over 30.0% in 2025 and is expected to retain its position in the market over the forecast period. This can be attributed to the usage of calendering resins in food packaging as it improves shelf life, is easy to store, and can be re-sealed. Flexible packaging is a better packaging alternative to traditional packaging, which, in turn, will boost the demand in the food industry.
The healthcare segment is expected to expand at a CAGR of 4.3% over the forecast period. The use of plastic calendering resins in manufacturing medical products and their packaging is growing owing to the recent Covid-19 outbreak in 2024. It helps in providing hygienic and non-contaminated packaging alternatives. In 2024, Vynova Group launched a bio-attributed PVC calendering resin, which can be used in healthcare and medical End-uses.
PVC Resins Segment Leads the Type Segment and is Projected to Dominate the Market
The PVC resins segment accounted for the largest share of over 55.0% in 2025 and is expected to retain its dominance over the forecast period. This can be attributed to the increasing demand for and use of PVC resin across various industries, especially the food & beverage industry. In addition, healthcare packaging and medical products require calendered plastic, which will further drive the segment.
The PET resin segment is expected to expand at a CAGR of 3.8% over the forecast period. This can be attributed to unique properties such as flexibility, heat and impact resistance, and recyclability. The food and cosmetic industries are the biggest consumers of PET resin products owing to their heat resistance and toughness. The products made from PET are excellent for cosmetic packaging, food trays, and rigid food packaging.
Some of the start-ups in the market include-
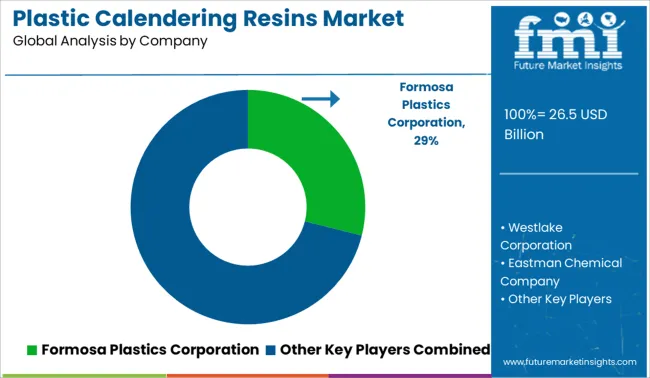
The players in the market are focusing to increase their global influence and adopt strategies such as; acquisition, collaboration, and partnerships. Key players in the market include Formosa Plastics Corporation; Westlake Corporation; Occidental Petroleum Corporation; Eastman Chemical Company; Avery Dennison Corporation; Covestro AG; China Petrochemical Corporation; Shin-Etsu Chemical Co., Ltd.; Reliance Industries Limited; SK Chemicals; LG Chem; LOTTE Chemical Corporation; SABIC; and Indorama Ventures Public Company Limited; Orbia. Some of the recent key developments among key players are:
| Report Attributes | Details |
|---|---|
| Forecast Period | 2025 to 2035 |
| Historical Data | 2020 to 2025 |
| Key Regions Covered | North America; Latin America; Europe; Asia Pacific; Middle East & Africa |
| Key Countries Covered | USA, Canada, Brazil, Mexico, Germany, United Kingdom, France, Spain, Italy, India, Indonesia, Singapore, Thailand, China, Japan, South Korea, Australia, New Zealand, GCC Countries, South Africa, Israel |
| Key Segments Covered | Type, End Use, Region |
| Key Players | Formosa Plastics Corporation, Westlake Corporation, Eastman Chemical Company, Occidental Petroleum Corporation, Shin-Etsu Chemical Co. Ltd., Avery Dennison Corporation, Covestro AG, Reliance Industries Limited, LG Chem, China Petrochemical Corporation, SK Chemicals, LOTTE Chemical Corporation, Indorama Ventures Public Company Limited, SABIC, Orbia |
| Pricing | Available upon Request |
The global plastic calendering resins market is estimated to be valued at USD 26.5 billion in 2025.
The market size for the plastic calendering resins market is projected to reach USD 47.5 billion by 2035.
The plastic calendering resins market is expected to grow at a 6.0% CAGR between 2025 and 2035.
The key product types in plastic calendering resins market are polyvinyl chloride (pvc), polyethylene terephthalate (pet), polypropylene (pp), polyethylene terephthalate glycol (petg) and others.
In terms of end use, food & beverages segment to command 42.6% share in the plastic calendering resins market in 2025.


Our Research Products

The "Full Research Suite" delivers actionable market intel, deep dives on markets or technologies, so clients act faster, cut risk, and unlock growth.

The Leaderboard benchmarks and ranks top vendors, classifying them as Established Leaders, Leading Challengers, or Disruptors & Challengers.

Locates where complements amplify value and substitutes erode it, forecasting net impact by horizon

We deliver granular, decision-grade intel: market sizing, 5-year forecasts, pricing, adoption, usage, revenue, and operational KPIs—plus competitor tracking, regulation, and value chains—across 60 countries broadly.

Spot the shifts before they hit your P&L. We track inflection points, adoption curves, pricing moves, and ecosystem plays to show where demand is heading, why it is changing, and what to do next across high-growth markets and disruptive tech

Real-time reads of user behavior. We track shifting priorities, perceptions of today’s and next-gen services, and provider experience, then pace how fast tech moves from trial to adoption, blending buyer, consumer, and channel inputs with social signals (#WhySwitch, #UX).

Partner with our analyst team to build a custom report designed around your business priorities. From analysing market trends to assessing competitors or crafting bespoke datasets, we tailor insights to your needs.
Supplier Intelligence
Discovery & Profiling
Capacity & Footprint
Performance & Risk
Compliance & Governance
Commercial Readiness
Who Supplies Whom
Scorecards & Shortlists
Playbooks & Docs
Category Intelligence
Definition & Scope
Demand & Use Cases
Cost Drivers
Market Structure
Supply Chain Map
Trade & Policy
Operating Norms
Deliverables
Buyer Intelligence
Account Basics
Spend & Scope
Procurement Model
Vendor Requirements
Terms & Policies
Entry Strategy
Pain Points & Triggers
Outputs
Pricing Analysis
Benchmarks
Trends
Should-Cost
Indexation
Landed Cost
Commercial Terms
Deliverables
Brand Analysis
Positioning & Value Prop
Share & Presence
Customer Evidence
Go-to-Market
Digital & Reputation
Compliance & Trust
KPIs & Gaps
Outputs
Full Research Suite comprises of:
Market outlook & trends analysis
Interviews & case studies
Strategic recommendations
Vendor profiles & capabilities analysis
5-year forecasts
8 regions and 60+ country-level data splits
Market segment data splits
12 months of continuous data updates
DELIVERED AS:
PDF EXCEL ONLINE
Plastic Resins Market Size, Share & Forecast 2025 to 2035
Plastic Tubes for Effervescent Tablets Market Size and Share Forecast Outlook 2025 to 2035
Plastic Banding Market Size and Share Forecast Outlook 2025 to 2035
Plastic Tube Market Size and Share Forecast Outlook 2025 to 2035
Plastic Jar Packaging Market Forecast and Outlook 2025 to 2035
Plastic Cases Market Size and Share Forecast Outlook 2025 to 2035
Plastic Jar Industry Analysis in the United States Size and Share Forecast Outlook 2025 to 2035
Plastic Cutlery Market Forecast and Outlook 2025 to 2035
Plastic Vial Market Forecast and Outlook 2025 to 2035
Plastic Hot and Cold Pipe Market Forecast and Outlook 2025 to 2035
Plastic Retort Can Market Size and Share Forecast Outlook 2025 to 2035
Plastic Gears Market Size and Share Forecast Outlook 2025 to 2035
Plastic Additive Market Size and Share Forecast Outlook 2025 to 2035
Plastic Market Size and Share Forecast Outlook 2025 to 2035
Plastic Vials and Ampoules Market Size and Share Forecast Outlook 2025 to 2035
Plastic Healthcare Packaging Market Size and Share Forecast Outlook 2025 to 2035
Plastic Bottle Industry Analysis in Malaysia Size and Share Forecast Outlook 2025 to 2035
Plastic Drum Industry Analysis in Malaysia Size and Share Forecast Outlook 2025 to 2035
Plastic Healthcare Packaging Industry Analysis in Western Europe Size and Share Forecast Outlook 2025 to 2035
Plastic Healthcare Packaging Industry Analysis in Korea Size and Share Forecast Outlook 2025 to 2035

Thank you!
You will receive an email from our Business Development Manager. Please be sure to check your SPAM/JUNK folder too.
Chat With
MaRIA