The global plastic additive market is projected to reach USD 74.8 billion by 2035, recording an absolute increase of USD 27.1 billion over the forecast period. The market is valued at USD 47.7 billion in 2025 and is set to rise at a CAGR of 4.6% during the assessment period. The overall market size is expected to grow by nearly 1.6 times during the same period, supported by increasing demand for flexible packaging and e-commerce logistics solutions worldwide, rising automotive light-weighting requirements, driving demand for advanced impact modifiers and heat stabilizers and increasing investments in construction infrastructure, recycled plastics processing, and high-performance polymer applications globally. However, regulatory restrictions on certain phthalate plasticizers and volatile raw material costs may pose challenges to market expansion.
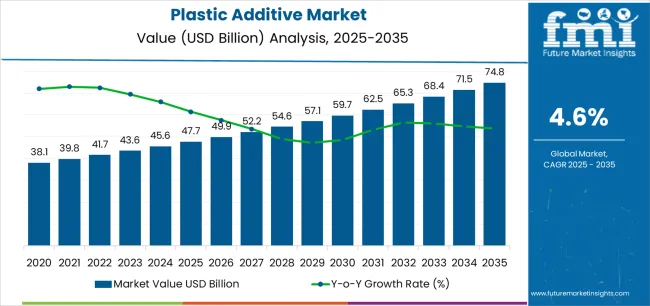
Between 2025 and 2030, the plastic additive market is projected to expand from USD 47.7 billion to USD 58.7 billion, resulting in a value increase of USD 11.0 billion, which represents 40.6% of the total forecast growth for the decade. This phase of development will be shaped by rising demand for sustainable packaging and recycled plastic processing, product innovation in bio-based plasticizers and recycling-compatible stabilizers, as well as expanding integration with electric vehicle manufacturing and lightweight automotive components. Companies are establishing competitive positions through investment in non-phthalate plasticizer technologies, advanced flame retardant formulations, and strategic market expansion across packaging, construction, and automotive applications.
From 2030 to 2035, the market is forecast to grow from USD 58.7 billion to USD 74.8 billion, adding another USD 16.1 billion, which constitutes 59.4% of the overall ten-year expansion. This period is expected to be characterized by the expansion of specialized additive systems, including recycling-enabler packages and circular economy solutions, strategic collaborations between additive producers and polymer manufacturers, and an enhanced focus on REACH compliance and low-emission additive technologies. The growing emphasis on mechanical recycling optimization and bio-based feedstock integration will drive demand for advanced, high-performance plastic additive solutions across diverse industrial applications.
| Metric | Value |
|---|---|
| Market Value (2025) | USD 47.7 billion |
| Market Forecast Value (2035) | USD 74.8 billion |
| Forecast CAGR (2025-2035) | 4.6% |
The plastic additive market grows by enabling polymer manufacturers to enhance material properties including flexibility, thermal stability, impact resistance, and flame retardancy essential for packaging, construction, and automotive applications. Packaging industry expansion driven by e-commerce growth and food safety requirements creates demand for antioxidants, slip agents, and UV stabilizers that extend shelf life and maintain product integrity during distribution. Automotive light-weighting initiatives require impact modifiers and heat stabilizers supporting polypropylene and polyethylene component adoption, reducing vehicle weight by 10-15% while maintaining safety standards and durability performance.
Construction sector growth in emerging markets drives demand for PVC stabilizers, plasticizers, and flame retardants supporting building profiles, cables, and pipe systems meeting fire safety and weather resistance specifications. Circular economy initiatives and mechanical recycling expansion encourage adoption of recycling-compatible stabilizer packages that restore degraded polymer properties, enabling multiple-use cycles and supporting sustainability commitments. However, regulatory restrictions on certain phthalate plasticizers in food-contact and medical applications may limit market growth in sensitive end-use segments.
The market is segmented by product type, application, plastic type, and region. By product type, the market is divided into plasticizers, stabilizers, flame retardants, impact modifiers, antioxidants, fillers & thickeners, nucleating agents, and others. Based on application, the market is categorized into packaging, construction, automotive, consumer goods, and others. By plastic type, the market includes polypropylene, polyethylene, PVC, PET, polystyrene, EVA, engineering plastics, and thermosets & others. Regionally, the market is divided into Asia Pacific, North America, Europe, and other key regions.
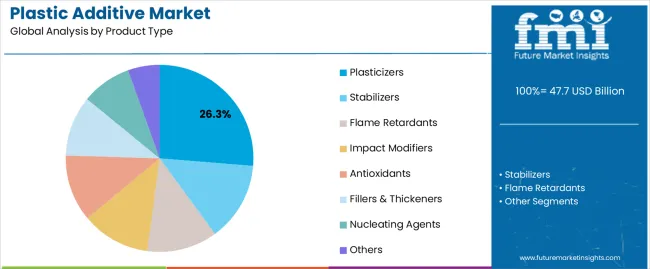
The plasticizers segment represents the dominant force in the plastic additive market, capturing approximately 26.3% of total market share in 2025. This category encompasses phthalate and non-phthalate plasticizers including DINP, DEHP alternatives, citrate esters, and bio-based options that impart flexibility to PVC and other polymers for wire insulation, flooring, and flexible packaging applications. The plasticizers segment's market leadership stems from extensive PVC processing requirements where plasticizer content reaches 30-60% by weight, creating substantial volume consumption across construction cables, automotive interiors, and medical tubing.
The stabilizers segment maintains 21.0% market share through heat and UV stabilization requirements, while flame retardants capture 15.2% serving fire safety regulations. Impact modifiers account for 11.6% market share supporting toughness enhancement in rigid plastics.
Key factors driving the plasticizers segment include:
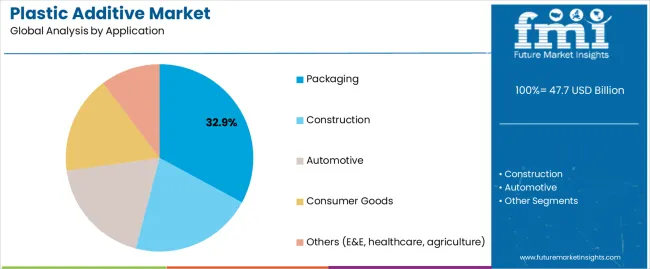
Packaging applications dominate the plastic additive market with approximately 32.9% market share in 2025, reflecting critical roles of slip agents, antioxidants, UV stabilizers, and processing aids in flexible films, rigid containers, and protective packaging supporting food safety, product protection, and logistics efficiency. The packaging segment's market leadership is reinforced by e-commerce expansion, fresh food distribution requirements, and convenience packaging trends requiring barrier properties, clarity enhancement, and extended shelf-life performance.
Construction applications represent the second-largest category, capturing 23.4% market share through PVC profiles, pipes, and cable insulation requiring heat stabilizers and plasticizers. Automotive applications account for 17.6% market share serving under-hood components, interior trim, and exterior panels requiring heat resistance and impact modification.
Key market dynamics supporting application growth include:
The market is driven by three concrete demand factors tied to polymer processing requirements. First, packaging industry expansion driven by e-commerce growth and food distribution modernization creates increasing demand for antioxidants and slip agents, with global flexible packaging production projected to grow 5-7% annually, requiring specialized additive formulations for barrier films, stand-up pouches, and protective packaging maintaining product freshness and mechanical integrity. Second, automotive light-weighting initiatives and electric vehicle component adoption drive impact modifier and heat stabilizer consumption, with automotive plastic content reaching 15-20% of vehicle weight, requiring additive systems supporting under-hood thermal resistance and exterior panel impact performance. Third, mechanical recycling expansion and circular economy commitments create demand for recycling-compatible stabilizer packages, with rPE and rPP processing requiring specialized antioxidants restoring degraded polymer properties and enabling multi-cycle material utilization.
Market restraints include regulatory restrictions on certain phthalate plasticizers particularly DEHP, DBP, and BBP in food-contact and children's products, creating substitution pressures and reformulation costs for manufacturers serving sensitive applications. Raw material price volatility affects production economics, particularly for petroleum-derived base chemicals including adipic acid, phthalic anhydride, and phenolic compounds that impact plasticizer and antioxidant pricing during commodity cycle fluctuations. Performance trade-offs in alternative formulations pose challenges, as non-phthalate plasticizers and halogen-free flame retardants may require higher loading levels or compromise processing characteristics compared to traditional systems.
Key trends indicate accelerated adoption of bio-based and biomass-balance additive systems utilizing renewable feedstocks through mass-balance certification, enabling partial fossil carbon substitution while maintaining identical technical performance. Recycling-enabler additive packages intensify development as mechanical recycling scales, with specialized stabilizer combinations addressing odor control, color improvement, and mechanical property restoration in recycled polyolefins. REACH compliance and low-emission formulations drive innovation toward non-classified substances and reduced volatile organic compounds, particularly in European markets where stringent chemical regulations and food-contact requirements favor premium additive systems. However, the market thesis could face disruption if alternative polymer chemistries or additive-free processing technologies achieve commercial viability, potentially reducing dependence on traditional additive systems for certain applications.
| Country | CAGR (2025-2035) |
|---|---|
| India | 6.9% |
| China | 5.2% |
| Brazil | 3.6% |
| USA | 3.4% |
| Saudi Arabia | 3.3% |
| Germany | 3.1% |
| UK | 3.0% |
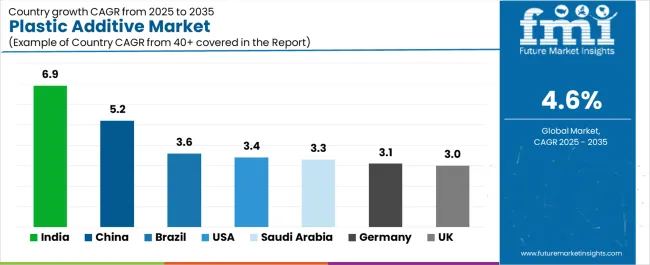
The market is gaining momentum worldwide, with India taking the lead thanks to e-commerce packaging growth, rapid FMCG capacity additions, and shift to non-phthalate systems in wires and cables. Close behind, China benefits from advanced packaging for consumer goods, electric vehicle supply chain expansion, and local capacity for high-performance stabilizers and flame retardants, positioning itself as the dominant manufacturing hub. Brazil shows steady advancement, where construction recovery, agripack films, and flexible packaging demand strengthen its role in Latin American polymer markets. The United States stands out for automotive light-weighting initiatives, and recycled polyethylene and polypropylene compatibilizer demand supporting circular economy goals. Meanwhile, Saudi Arabia focuses on resin downstreaming and masterbatch integration, Germany maintains progress through engineering plastics additives, and the United Kingdom continues consistent growth in healthcare and pharma packaging applications. Together, India and China anchor the global expansion story, while the rest build stability and diversity into the market's growth path.
The report covers an in-depth analysis of 40+ countries, top-performing countries are highlighted below.
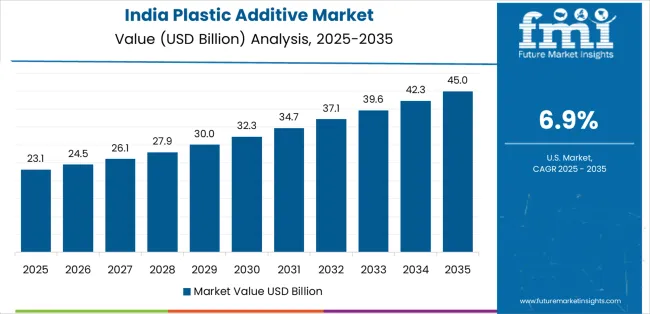
India demonstrates the strongest growth potential in the Plastic Additive Market with a CAGR of 6.9% through 2035. The country's leadership position stems from explosive e-commerce packaging expansion requiring slip agents and antistatic additives, rapid FMCG manufacturing capacity additions in Gujarat and Maharashtra demanding antioxidants and UV stabilizers, and accelerating transition to non-phthalate plasticizer systems in electrical cables and consumer products driven by regulatory compliance. Growth is concentrated in major polymer processing clusters including Gujarat, Maharashtra, Tamil Nadu, and Uttar Pradesh, where packaging converters, cable manufacturers, and automotive component suppliers are implementing modern additive systems. Distribution channels through established chemical supply networks, masterbatch producers, and compounding facilities expand deployment across film extrusion operations, pipe manufacturers, and injection molding plants serving domestic and export markets in Middle East and Africa. The country's Make in India initiatives and Production Linked Incentive schemes provide policy support for polymer processing and specialty chemical production.
Key market factors:
In Jiangsu, Zhejiang, Guangdong, and Shandong provinces, adoption of advanced plastic additive technologies is accelerating across integrated polymer complexes, packaging film producers, and automotive component manufacturers, driven by quality upgrading initiatives and electric vehicle supply chain expansion. The market demonstrates strong growth momentum with a CAGR of 5.2% through 2035, linked to domestic consumption growth in premium packaging applications and increasing focus on high-performance stabilizers and flame retardants meeting international automotive and electronics standards. Chinese manufacturers are implementing advanced antioxidant systems, recycling-compatible stabilizers, and halogen-free flame retardants to enhance product quality while serving growing demand for packaging materials, automotive interior and under-hood components, and consumer electronics housings in both domestic and export markets. The country's 14th Five-Year Plan emphasizes chemical industry upgrading, new energy vehicle development, and circular economy implementation, creating sustained demand for specialty additives.
Brazil's market expansion is driven by construction sector recovery requiring PVC stabilizers and plasticizers for profiles, pipes, and cable insulation, agricultural packaging film requirements demanding UV stabilizers for crop protection and silage applications, and flexible packaging demand supporting food and beverage distribution across expanding retail networks. The country demonstrates promising growth potential with a CAGR of 3.6% through 2035, supported by federal infrastructure investment programs, agricultural modernization initiatives, and growing consumer goods manufacturing capacity in São Paulo, Paraná, and Santa Catarina industrial regions. Brazilian polymer processors are implementing cost-effective additive solutions balancing performance requirements with economic constraints, while reducing import dependencies through regional production expansion and technology partnerships. However, currency volatility and economic cycles create implementation challenges requiring flexible sourcing strategies and local manufacturing approaches.
Market characteristics:
The USA market leads in advanced additive applications with a CAGR of 3.4% through 2035, driven by automotive light-weighting initiatives requiring impact modifiers and nucleating agents for polypropylene components, mechanical recycling capacity expansion demanding specialized antioxidant and stabilizer packages for rPE and rPP reprocessing, and high-performance packaging requirements for healthcare, pharmaceutical, and food applications across major polymer processing regions including Midwest, Southeast, and Texas Gulf Coast. American manufacturers are adopting recycling-compatible stabilizer systems addressing odor control and mechanical property restoration in post-consumer recycled content, bio-based additive alternatives supporting corporate sustainability commitments, and FDA-compliant formulations for direct food-contact and medical applications. Technology deployment channels through established chemical distributors, masterbatch suppliers, and technical service centers expand coverage across automotive tier suppliers, packaging converters, and construction product manufacturers.
Leading market segments:
Saudi Arabia's market expansion demonstrates promising growth potential with a CAGR of 3.3% through 2035, driven by petrochemical downstream development with integrated polyethylene and polypropylene complexes implementing captive masterbatch and additive production supporting resin value-chain integration, regional export orientation serving polymer processors across GCC countries and North Africa requiring cost-competitive additive solutions, and government Vision 2030 industrial diversification programs encouraging specialty chemical manufacturing capacity development. Saudi manufacturers are establishing additive production capabilities leveraging feedstock cost advantages from integrated ethylene and propylene crackers, serving domestic polymer producers including SABIC, SIPCHEM, and emerging petrochemical ventures while targeting export growth. The country's strategic location and port infrastructure enable efficient distribution to high-growth markets in Middle East, Africa, and South Asia regions.
Market characteristics:
In North Rhine-Westphalia, Bavaria, and Baden-Württemberg, chemical manufacturing facilities are implementing advanced plastic additives with a CAGR of 3.1% through 2035, driven by automotive supplier networks requiring engineering plastics additives for under-hood, structural, and exterior applications, REACH-compliant formulation requirements accelerating transition to non-classified substances and low-VOC systems, and export-oriented specialty additive production serving premium quality segments across European and global markets. German manufacturers maintain competitive advantages through technical excellence, comprehensive regulatory documentation, and application development expertise, creating sustained demand for premium stabilizers, impact modifiers, and flame retardants supporting automotive OEM approvals, electronics industry specifications, and construction material certifications. The country's established automotive and chemical industry infrastructure creates integrated supply chains linking additive producers, compounders, and end-product manufacturers.
Market development factors:
The UK market demonstrates moderate growth potential with a CAGR of 3.0% through 2035, focused on healthcare and pharmaceutical packaging requiring specialized antioxidants and migration-compliant stabilizers, stringent food-contact and VOC compliance requirements driving additive technology upgrades across packaging and consumer goods applications, and sustainability initiatives encouraging adoption of bio-based and recycling-compatible additive formulations meeting corporate environmental commitments. British polymer processors are implementing low-migration antioxidant systems for direct food-contact applications, pharmaceutical-grade stabilizers for medical device and drug packaging, and REACH-registered formulations ensuring regulatory compliance across UK and EU markets. The country's pharmaceutical industry strength, specialty packaging expertise, and quality-focused manufacturing culture support premium additive demand despite mature market conditions.
Leading market segments:
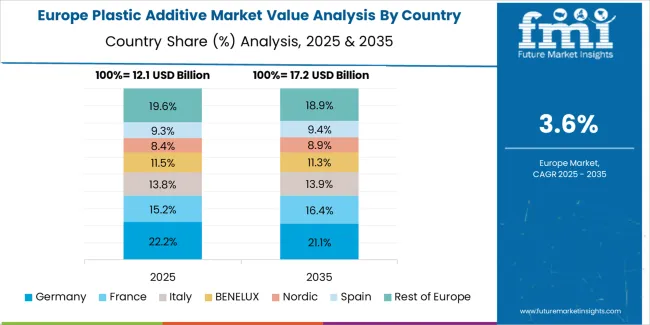
Europe represents an estimated 26.5% of global plastic additive demand in 2025 at approximately USD 12.6 billion, anchored by packaging, construction profiles, automotive light-weighting, and stringent REACH and food-contact compliance that favors higher-value stabilizers, non-phthalate plasticizers, and recycling-enabling additives.
Within Europe, Germany is expected to maintain its leadership position with a 22.0% market share at USD 2.8 billion, supported by automotive supplier networks, chemical manufacturing infrastructure, and engineering plastics processing capabilities. France follows with a 14.0% share at USD 1.8 billion, driven by packaging, construction, and automotive applications. The United Kingdom holds a 12.0% share at USD 1.5 billion through pharmaceutical packaging and food-contact applications, while Italy commands 12.0% at USD 1.5 billion with building profiles, cables, and appliance production. Spain accounts for 9.0% at USD 1.1 billion serving construction and consumer goods markets. Nordics & Benelux capture 13.0% at USD 1.6 billion through food-contact and medical-grade stabilizer applications, while Rest of Europe represents 18.0% at USD 2.3 billion. Packaging-led demand dominates in Germany, France, and UK, while Italy and Spain emphasize building profiles, cables, and appliances, with Northern clusters over-indexing in food-contact and medical-grade stabilizers.
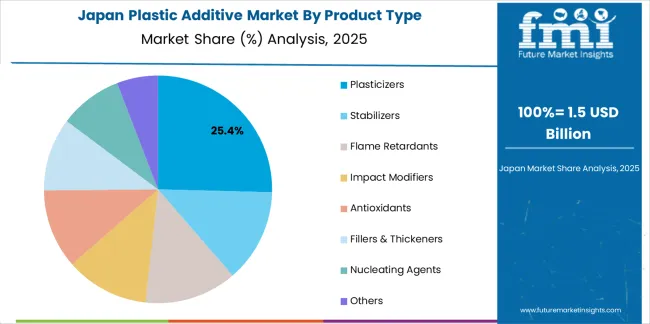
The Japanese Plastic Additive Market demonstrates a mature and quality-focused landscape, characterized by sophisticated implementation of high-performance additive systems supporting automotive components, electronics housings, and precision consumer goods manufacturing. Japan's emphasis on material performance and reliability drives demand for specialty impact modifiers, heat stabilizers, and flame retardants supporting domestic manufacturers including Toyota, Honda, Panasonic, and Sony in maintaining strict quality standards and automotive safety requirements. The market benefits from strong partnerships between international additive providers like BASF, Clariant, and domestic specialty chemical leaders including Kaneka Corporation, Adeka Corporation, and Sakai Chemical Industry, creating comprehensive technical service ecosystems that prioritize performance consistency and automotive approval programs. Manufacturing centers in Kanto, Kansai, and Tokai regions showcase advanced compounding implementations where additive systems achieve precise performance targets through integrated quality control programs.
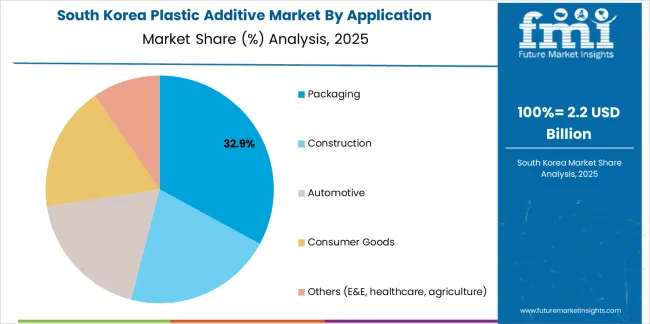
The South Korean Plastic Additive Market is characterized by strong international additive provider presence, with companies like BASF SE, Dow, and specialty chemical suppliers maintaining significant positions through comprehensive technical support for automotive and electronics applications. The market demonstrates growing emphasis on electric vehicle component requirements and advanced packaging technologies, as Korean manufacturers increasingly demand specialized flame retardants for battery systems, heat stabilizers for under-hood applications, and food-contact compliant additives integrating with domestic automotive and consumer electronics infrastructure operated across Hyundai, Kia, Samsung, and LG industrial complexes. Local chemical companies and regional specialty producers are gaining market share through strategic partnerships with global additive suppliers, offering specialized services including Korean automotive approval support and technical application programs for engineering plastics. The competitive landscape shows increasing collaboration between multinational chemical companies and Korean automotive specialists, creating hybrid service models that combine international additive expertise with local manufacturing capabilities and quality management systems.
Plastic additives represent specialized chemical formulations that enable polymer manufacturers to achieve enhanced material properties including flexibility, thermal stability, impact resistance, and flame retardancy, delivering superior performance characteristics essential for packaging protection, automotive durability, and construction longevity across demanding applications. With the market projected to grow from USD 47.7 billion in 2025 to USD 74.8 billion by 2035 at a 4.6% CAGR, these additive systems offer compelling advantages - performance optimization, processing efficiency improvements, and regulatory compliance enablement - making them essential for packaging applications (32.9% market share), construction (23.4% share), and automotive seeking alternatives to heavier materials and legacy formulations that compromise sustainability and regulatory acceptance. Scaling market adoption and sustainable formulation development requires coordinated action across polymer industry policy, environmental regulations, specialty chemical manufacturers, polymer processors, and circular economy investment capital.
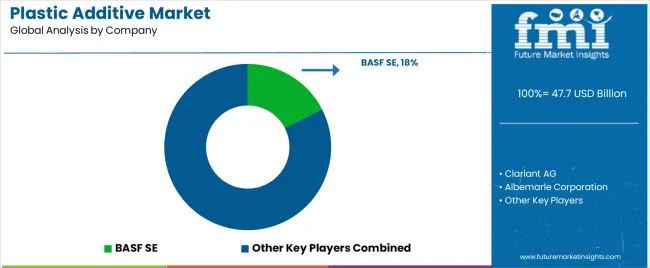
The market features approximately 30-40 meaningful players with moderate concentration, where the top three companies control roughly 22-25% of global market share through established technology platforms, comprehensive product portfolios, and extensive polymer industry relationships. The leading company, BASF SE, commands approximately 8.5% market share through integrated chemical production, diversified additive portfolios, and global technical service networks. Competition centers on formulation performance, regulatory compliance support, technical service capabilities, and sustainable product development rather than price competition alone.
Market leaders include BASF SE, Clariant AG, and Albemarle Corporation, which maintain competitive advantages through research and development capabilities, global manufacturing networks, and deep expertise in plasticizer chemistry, stabilizer technologies, and flame retardant formulations, creating high switching costs for customers relying on validated formulations and technical support. These companies leverage innovation pipelines, application development expertise, and regulatory compliance resources to defend market positions while expanding into bio-based additives and recycling-enabler formulations.
Challengers encompass Songwon Industrial Co. Ltd., Nouryon, and LANXESS AG, which compete through specialized additive platforms and regional market presence. Chemical conglomerates including Evonik Industries AG, Dow, and ExxonMobil focus on integrated production or specific additive categories, offering differentiated capabilities in antioxidants, processing aids, and polyolefin additives.
Regional players create competitive pressure through cost-effective formulations and localized technical service, particularly in high-growth markets including India and China where proximity to polymer processors provides advantages in application development and customer responsiveness. Market dynamics favor companies combining advanced formulation technologies with comprehensive technical support addressing complete polymer processing requirements from development through production optimization.
| Item | Value |
|---|---|
| Quantitative Units | USD 47.7 billion |
| Product Type | Plasticizers, Stabilizers, Flame Retardants, Impact Modifiers, Antioxidants, Fillers & Thickeners, Nucleating Agents, Others |
| Application | Packaging, Construction, Automotive, Consumer Goods, Others (E&E, healthcare, agriculture) |
| Plastic Type | Polypropylene, Polyethylene, PVC, PET, Polystyrene, EVA, Engineering Plastics, Thermosets & Others |
| Regions Covered | Asia Pacific, North America, Europe, Latin America, Middle East & Africa |
| Country Covered | India, China, Brazil, United States, Saudi Arabia, Germany, United Kingdom, and 40+ countries |
| Key Companies Profiled | BASF SE, Clariant AG, Albemarle Corporation, Songwon Industrial Co. Ltd., Nouryon, LANXESS AG, Evonik Industries AG, Kaneka Corporation, Dow, ExxonMobil |
| Additional Attributes | Dollar sales by product type, application, and plastic type categories, regional adoption trends across Asia Pacific, North America, and Europe, competitive landscape with specialty chemical producers and integrated polymer companies, formulation requirements and performance specifications, applications in packaging films, automotive components, and construction materials, innovations in bio-based additives and recycling-compatible systems, and development of sustainable formulations with enhanced regulatory compliance characteristics. |
The global plastic additive market is estimated to be valued at USD 47.7 billion in 2025.
The market size for the plastic additive market is projected to reach USD 74.8 billion by 2035.
The plastic additive market is expected to grow at a 4.6% CAGR between 2025 and 2035.
The key product types in plastic additive market are plasticizers, stabilizers, flame retardants, impact modifiers, antioxidants, fillers & thickeners, nucleating agents and others.
In terms of application, packaging segment to command 32.9% share in the plastic additive market in 2025.


Our Research Products

The "Full Research Suite" delivers actionable market intel, deep dives on markets or technologies, so clients act faster, cut risk, and unlock growth.

The Leaderboard benchmarks and ranks top vendors, classifying them as Established Leaders, Leading Challengers, or Disruptors & Challengers.

Locates where complements amplify value and substitutes erode it, forecasting net impact by horizon

We deliver granular, decision-grade intel: market sizing, 5-year forecasts, pricing, adoption, usage, revenue, and operational KPIs—plus competitor tracking, regulation, and value chains—across 60 countries broadly.

Spot the shifts before they hit your P&L. We track inflection points, adoption curves, pricing moves, and ecosystem plays to show where demand is heading, why it is changing, and what to do next across high-growth markets and disruptive tech

Real-time reads of user behavior. We track shifting priorities, perceptions of today’s and next-gen services, and provider experience, then pace how fast tech moves from trial to adoption, blending buyer, consumer, and channel inputs with social signals (#WhySwitch, #UX).

Partner with our analyst team to build a custom report designed around your business priorities. From analysing market trends to assessing competitors or crafting bespoke datasets, we tailor insights to your needs.
Supplier Intelligence
Discovery & Profiling
Capacity & Footprint
Performance & Risk
Compliance & Governance
Commercial Readiness
Who Supplies Whom
Scorecards & Shortlists
Playbooks & Docs
Category Intelligence
Definition & Scope
Demand & Use Cases
Cost Drivers
Market Structure
Supply Chain Map
Trade & Policy
Operating Norms
Deliverables
Buyer Intelligence
Account Basics
Spend & Scope
Procurement Model
Vendor Requirements
Terms & Policies
Entry Strategy
Pain Points & Triggers
Outputs
Pricing Analysis
Benchmarks
Trends
Should-Cost
Indexation
Landed Cost
Commercial Terms
Deliverables
Brand Analysis
Positioning & Value Prop
Share & Presence
Customer Evidence
Go-to-Market
Digital & Reputation
Compliance & Trust
KPIs & Gaps
Outputs
Full Research Suite comprises of:
Market outlook & trends analysis
Interviews & case studies
Strategic recommendations
Vendor profiles & capabilities analysis
5-year forecasts
8 regions and 60+ country-level data splits
Market segment data splits
12 months of continuous data updates
DELIVERED AS:
PDF EXCEL ONLINE
Asia Pacific Plastic Additives Market Size and Share Forecast Outlook 2025 to 2035
Plastic Tubes for Effervescent Tablets Market Size and Share Forecast Outlook 2025 to 2035
Plastic Banding Market Size and Share Forecast Outlook 2025 to 2035
Plastic Tube Market Size and Share Forecast Outlook 2025 to 2035
Plastic Jar Packaging Market Forecast and Outlook 2025 to 2035
Plastic Cases Market Size and Share Forecast Outlook 2025 to 2035
Plastic Jar Industry Analysis in the United States Size and Share Forecast Outlook 2025 to 2035
Plastic Cutlery Market Forecast and Outlook 2025 to 2035
Plastic Vial Market Forecast and Outlook 2025 to 2035
Plastic Hot and Cold Pipe Market Forecast and Outlook 2025 to 2035
Plastic Retort Can Market Size and Share Forecast Outlook 2025 to 2035
Plastic Gears Market Size and Share Forecast Outlook 2025 to 2035
Plastic Market Size and Share Forecast Outlook 2025 to 2035
Plastic Vials and Ampoules Market Size and Share Forecast Outlook 2025 to 2035
Plastic Healthcare Packaging Market Size and Share Forecast Outlook 2025 to 2035
Plastic Bottle Industry Analysis in Malaysia Size and Share Forecast Outlook 2025 to 2035
Plastic Drum Industry Analysis in Malaysia Size and Share Forecast Outlook 2025 to 2035
Additives for Metalworking Fluids Market Size and Share Forecast Outlook 2025 to 2035
Plastic Healthcare Packaging Industry Analysis in Western Europe Size and Share Forecast Outlook 2025 to 2035
Plastic Healthcare Packaging Industry Analysis in Korea Size and Share Forecast Outlook 2025 to 2035

Thank you!
You will receive an email from our Business Development Manager. Please be sure to check your SPAM/JUNK folder too.
Chat With
MaRIA