The global plastic market is projected to reach USD 1,138.2 billion by 2035, recording an absolute increase of USD 370.0 billion over the forecast period. The market is valued at USD 768.9 billion in 2025 and is set to rise at a CAGR of 4.0% during the assessment period.
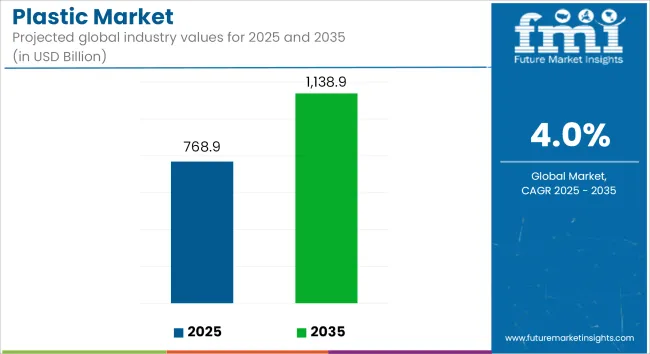
The overall market size is expected to grow by nearly 1.5 times during the same period, supported by consistent demand across sectors including packaging, automotive, construction, electronics, and healthcare, where plastics are preferred for their strength-to-weight ratio, chemical resistance, and processing flexibility. However, environmental regulations and material recovery mandates across Europe and North America may pose challenges to virgin plastic expansion.
Between 2025 and 2030, the plastic market is projected to expand from USD 768.9 billion to USD 936.8 billion, resulting in a value increase of USD 167.9 billion, which represents 45.4% of the total forecast growth for the decade. This phase of development will be shaped by rising demand for lightweight automotive components and flexible packaging solutions, product innovation in advanced polymer formulations and recycled content integration, as well as expanding chemical recycling infrastructure across North America and Europe. Companies are establishing competitive positions through investment in bio-based resins, advanced recycling technologies, and strategic capacity expansions across packaging, automotive, and construction applications.
From 2030 to 2035, the market is forecast to grow from USD 936.8 billion to USD 1,138.2 billion, adding another USD 202.1 billion, which constitutes 54.6% of the overall ten-year expansion. This period is expected to be characterized by the expansion of circular economy frameworks, including extended producer responsibility programs and mandatory recycled content requirements tailored for specific packaging categories, strategic collaborations between polymer producers and waste management operators, and an enhanced focus on carbon-neutral production and environmental sustainability. The growing emphasis on mechanical and chemical recycling integration and renewable feedstock adoption will drive demand for advanced, high-performance plastic solutions across diverse industrial applications.
| Metric | Value |
|---|---|
| Market Value (2025) | USD 768.9 billion |
| Market Forecast Value (2035) | USD 1,138.2 billion |
| Forecast CAGR (2025-2035) | 4.0% |
The plastic market grows by enabling manufacturers to achieve superior performance characteristics and cost-effectiveness in various applications, ranging from food packaging to automotive components. Industrial manufacturers face mounting pressure to reduce product weight and improve durability, with polymer-based components typically providing 30-50% weight reduction compared to traditional materials like metal and glass, making plastics essential for competitive manufacturing operations across automotive, construction, and consumer goods sectors.
The packaging industry's need for barrier properties and processing flexibility creates demand for advanced polymer solutions that can minimize food waste, enhance shelf life, and ensure consistent performance across diverse environmental conditions.
Government initiatives promoting lightweight vehicle standards and circular economy frameworks drive adoption in automotive, packaging, and construction applications, where material performance has a direct impact on fuel efficiency, product protection, and environmental compliance. However, environmental regulations targeting single-use plastics and extended producer responsibility mandates may limit virgin plastic adoption rates among consumer-facing brands and developing regions with limited recycling infrastructure.
The market is segmented by product type, processing technology, end-use application, and region. By product type, the market is divided into polyethylene (PE), polypropylene (PP), polyvinyl chloride (PVC), polystyrene (PS), polyethylene terephthalate (PET), and other engineering polymers.
Based on processing technology, the market is categorized into injection molding, extrusion, blow molding, thermoforming, and other techniques. By end-use application, the market includes packaging, automotive, construction, electronics, healthcare, and other sectors. Regionally, the market is divided into Asia Pacific, Europe, North America, Latin America, and Middle East &Africa.
The polyethylene segment represents the dominant force in the plastic market, capturing approximately 27.0% of total market share in 2025. This versatile polymer category encompasses multiple grades featuring distinct performance characteristics, including low-density polyethylene/linear low-density polyethylene (LDPE/LLDPE) at 14.0% share, high-density polyethylene (HDPE) at 10.0% share, and metallocene LLDPE at 3.0% share. The polyethylene segment's market leadership stems from its exceptional versatility and cost-effectiveness, with applications capable of spanning flexible films to rigid containers while maintaining consistent processing performance and environmental resistance across diverse operating conditions.
The polypropylene segment maintains a substantial market presence, serving manufacturers who require high-temperature resistance and chemical stability for automotive components and rigid packaging applications. These formulations offer reliable performance for injection molding and fiber applications while providing sufficient mechanical strength to meet demanding industrial requirements.
Key technological advantages driving the polyethylene segment include:
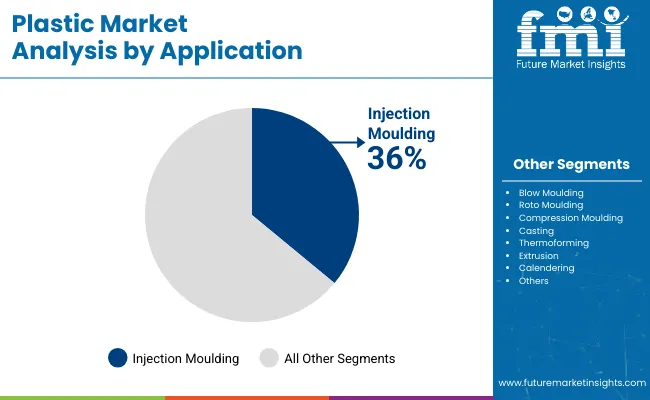
Injection molding applications dominate the plastic processing market with approximately 36.0% market share in 2025, reflecting the critical role of this technology in enabling high-volume, precision manufacturing for automotive, packaging, consumer goods, and electronics applications. The injection molding segment's market leadership is reinforced by accelerating automation adoption, increasing demand for complex geometries, and rising quality standards that directly correlate with processing precision and consistency.
The extrusion segment represents the second-largest processing category, capturing significant market share through specialized requirements for film production, pipe manufacturing, and profile applications. This segment benefits from growing demand for flexible packaging films that meet barrier property requirements and cost-effectiveness standards in food and consumer goods applications.
The blow molding segment accounts for substantial market share, serving bottle manufacturers and hollow container producers requiring cost-effective solutions for beverages, personal care, and household products. The thermoforming segment captures additional market share through disposable food service ware applications and protective packaging solutions.
Key market dynamics supporting processing technology growth include:
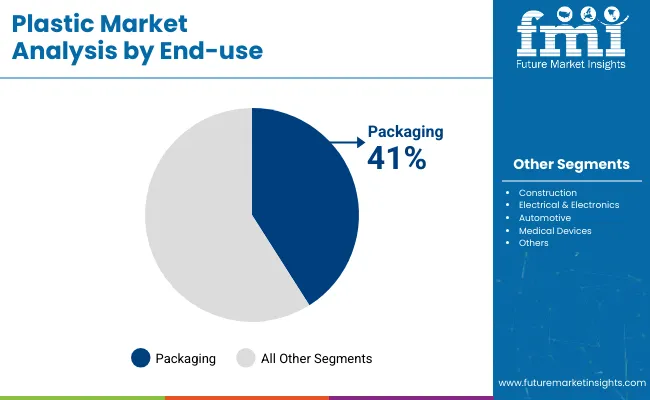
Packaging applications dominate the plastic market with approximately 41.0% market share in 2025, reflecting the critical role of plastics in enabling product protection, shelf-life extension, and supply chain efficiency across food, beverage, pharmaceutical, and consumer goods industries. The packaging segment's market leadership is reinforced by accelerating e-commerce penetration, growing convenience food consumption, and rising demand for barrier packaging that directly correlates with food safety and waste reduction requirements.
The automotive segment represents the second-largest application category, capturing significant market share through specialized requirements for lightweight components, interior trims, and under-hood applications where weight reduction provides direct fuel efficiency benefits. This segment benefits from stringent corporate average fuel economy standards and electrification trends that increase demand for polymer-based components to offset battery weight.
The construction segment accounts for substantial market share, serving pipe systems, insulation materials, and window profiles requiring durability, chemical resistance, and cost-effectiveness. The electronics segment captures additional market share through housing, circuit board substrates, and component applications, while healthcare represents growing demand for single-use medical devices and pharmaceutical packaging.
Key market dynamics supporting application growth include:
The market is driven by three concrete demand factors tied to performance and economic outcomes. First, packaging industry growth and e-commerce expansion create increasing demand for flexible films and protective materials, with global plastic packaging projected to grow at 3-4% annually in major markets worldwide, requiring specialized polymer solutions for barrier properties and processing efficiency.
Second, automotive lightweighting mandates and fuel efficiency regulations drive the adoption of polymer composites and engineering plastics, with manufacturers seeking 30-50% weight reduction compared to metal components while maintaining structural integrity and safety performance. Third, technological advancements in polymerization catalysts and processing equipment enable more effective material customization that reduces manufacturing costs while improving product performance and design flexibility.
Market restraints include environmental regulations targeting single-use plastics that can impact demand in consumer-facing applications and create market uncertainty, particularly during periods of policy transition affecting packaging design and material selection decisions.
Extended producer responsibility mandates pose another significant challenge, as achieving mandatory recycled content requirements requires specialized infrastructure and quality control systems, potentially causing supply constraints and increased material costs during implementation phases. Raw material price volatility linked to crude oil fluctuations creates additional complexity for manufacturers, demanding ongoing investment in feedstock diversification and alternative raw material development to maintain cost competitiveness.
Key trends indicate accelerated adoption of circular economy frameworks in Europe and North America, particularly mandatory recycled content requirements starting at 30% for rigid packaging in 2025 and increasing to 60% by 2029, driving comprehensive recycling infrastructure development and material certification programs.
Technology advancement trends toward chemical recycling integration with pyrolysis and dissolution technologies capable of processing mixed and contaminated plastics enable next-generation waste valorization that addresses multiple material streams simultaneously.
Bio-based polymer commercialization is expanding at 5-10% annual growth, with companies like BASF and TotalEnergies Corbion introducing renewable content resins that reduce greenhouse gas emissions while maintaining performance parity with conventional polymers. However, the market thesis could face disruption if alternative materials gain significant cost-performance advantages or if regulatory frameworks impose restrictions that fundamentally alter packaging system economics and material selection criteria.
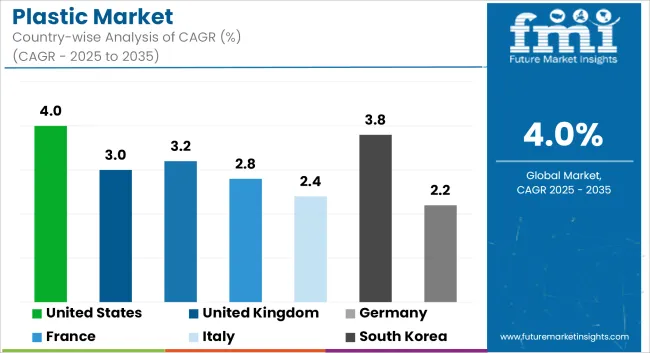
| Country | CAGR (2025-2035) |
|---|---|
| India | 5.3% |
| China | 4.9% |
| United States | 3.8% |
| Germany | 3.2% |
| Brazil | 4.1% |
| Indonesia | 4.4% |
| Turkey | 3.6% |
The plastic market is gaining momentum worldwide, with China taking the lead thanks to massive manufacturing capacity and integrated refinery-to-chemicals infrastructure. Close behind, India benefits from growing packaging demand and infrastructure development initiatives, positioning itself as a strategic growth hub in the Asia-Pacific region. Germany shows steady advancement, where integration of circular economy frameworks strengthens its role in the European polymer supply chain.
Brazil is focusing on agricultural packaging and consumer goods applications, signaling an ambition to capitalize on growing opportunities in South American markets. Meanwhile, the USA stands out for its advanced recycling development and onshore manufacturing expansion, and the UK, Japan, Turkey, and Indonesia continue to record consistent progress in automotive, packaging, and construction applications. Together, China and India anchor the global expansion story, while the rest build stability and diversity into the market's growth path.
The report covers an in-depth analysis of 40+ countries top-performing countries are highlighted below.
China demonstrates the strongest growth potential in the plastic market with a CAGR of 4.9% through 2035. The country's leadership position stems from massive manufacturing capacity, integrated petrochemical infrastructure linking refineries directly to polymer production, and aggressive e-commerce packaging demand driving adoption of flexible films and protective materials.
Growth is concentrated in major industrial regions, including Guangdong, Jiangsu, Zhejiang, and Shandong, where automotive manufacturers, packaging converters, and electronics companies are implementing advanced polymer solutions for enhanced product performance and international competitiveness. Distribution channels through established chemical trading companies and direct manufacturer relationships expand deployment across consumer goods production facilities and construction projects. The country's chemical recycling project development provides policy support for circular economy initiatives, including mechanical and advanced recycling system adoption.
Key market factors:
In Mumbai, Bangalore, Chennai, and Hyderabad, the adoption of plastic materials is accelerating across packaging manufacturing facilities, automotive production centers, and infrastructure projects, driven by government Make in India initiatives and formal extended producer responsibility frameworks. The market demonstrates strong growth momentum with a CAGR of 5.3% through 2035, linked to comprehensive infrastructure development, rapid urbanization, and increasing focus on manufacturing competitiveness solutions.
Indian manufacturers are implementing advanced polymer grades and processing technologies to enhance product performance while meeting growing demand for packaging films, automotive components, and construction materials in domestic and export markets. The country's plastic waste management rules create sustained demand for recycled content integration, while increasing emphasis on local manufacturing drives adoption of advanced processing equipment and quality systems.
Germany's advanced chemical industry demonstrates sophisticated implementation of polymer processing systems, with documented case studies showing 8-12% efficiency improvements in automotive applications through optimized lightweighting solutions. The country's manufacturing infrastructure in major industrial centers, including North Rhine-Westphalia, Bavaria, Baden-Württemberg, and Lower Saxony, showcases integration of advanced polymer technologies with existing production systems, leveraging expertise in chemical engineering and precision manufacturing.
German manufacturers emphasize quality standards and environmental compliance, creating demand for high-performance polymer solutions that support sustainability initiatives and regulatory requirements. The market maintains steady growth through focus on technology innovation and export competitiveness, with a CAGR of 3.2% through 2035.
Key development areas:
Brazil's market expansion is driven by diverse application demand, including agricultural packaging in São Paulo and Minas Gerais, consumer goods manufacturing in Santa Catarina and Rio Grande do Sul, and comprehensive industrial development across multiple regions. The country demonstrates promising growth potential with a CAGR of 4.1% through 2035, supported by federal industrial development programs and regional manufacturing competitiveness initiatives.
Brazilian manufacturers face implementation challenges related to import dependency and technical expertise availability, requiring technology transfer approaches and international partnership support. However, growing infrastructure investment and manufacturing expansion requirements create compelling business cases for polymer adoption, particularly in packaging regions where performance optimization has a direct impact on export competitiveness.
Market characteristics:
The USA market leads in advanced polymer innovation based on integration with next-generation automotive electrification technologies and sophisticated packaging applications for enhanced performance characteristics. The country shows solid potential with a CAGR of 3.8% through 2035, driven by onshore manufacturing expansion programs and advanced recycling initiatives across major industrial regions, including Texas, Louisiana, Ohio, and Pennsylvania.
American manufacturers are adopting advanced polymer grades for performance optimization and regulatory compliance, particularly in states with corporate average fuel economy mandates and advanced manufacturing facilities requiring superior product differentiation. Technology deployment channels through established chemical distributors and direct manufacturer relationships expand coverage across automotive manufacturing and packaging production facilities.
Leading market segments:
In England, Scotland, Wales, and Northern Ireland, manufacturing facilities are implementing polymer solutions to enhance packaging performance and improve manufacturing competitiveness, with documented case studies showing 6-8% improvement in recycled content integration through optimized processing systems. The market shows moderate growth potential with a CAGR of 3.5% through 2035, linked to circular economy development programs, plastic packaging tax implementation, and emerging clean technology manufacturing initiatives.
British manufacturers are adopting advanced recycling and quality systems to enhance product performance while maintaining environmental standards demanded by UK regulations and international export markets. The country's established chemical industry creates sustained demand for technology upgrade solutions that integrate with existing manufacturing systems.
Market development factors:
Japan's plastic market demonstrates sophisticated implementation focused on precision engineering and quality excellence optimization, with documented integration of advanced polymer systems achieving 5-7% improvement in dimensional stability across electronics and automotive applications.
The country maintains steady growth momentum with a CAGR of 3.1% through 2035, driven by manufacturers'emphasis on quality standards and continuous improvement methodologies that align with lean manufacturing principles applied to materials processing operations. Major industrial regions, including Kanto, Kansai, Chubu, and Kyushu, showcase advanced deployment of precision molding platforms where systems integrate seamlessly with existing quality control systems and comprehensive manufacturing management programs.
Key market characteristics:
The plastic market in Europe is projected to grow from USD 176.8 billion in 2025 to USD 263.9 billion by 2035, registering a CAGR of 4.0% over the forecast period. Germany is expected to maintain its leadership position with a 18.0% market share in 2025, supported by its extensive chemical manufacturing infrastructure and major industrial centers, including Frankfurt, Munich, and Stuttgart production facilities.
The United Kingdom follows with an 11.0% share in 2025, driven by comprehensive circular economy development programs and advanced manufacturing initiatives implementing polymer technologies. France holds a 12.0% share in 2025 through ongoing industrial facility upgrades and chemical technology development.
Italy commands an 10.0% share, while Spain accounts for 7.0% in 2025. The Netherlands, Poland, Belgium, Sweden, Switzerland, Austria, and Czechia collectively represent strong regional markets with established manufacturing bases. The Rest of Europe region is anticipated to gain momentum, expanding its collective share through increasing polymer adoption in Nordic countries and emerging Eastern European manufacturing facilities implementing advanced materials programs.
The Japanese plastic market demonstrates a mature and quality-focused landscape, characterized by sophisticated integration of polyethylene and polypropylene systems with existing precision manufacturing infrastructure across automotive production facilities, electronics manufacturers, and specialized molding centers.
Japan's emphasis on manufacturing excellence and quality standards drives demand for high-reliability polymer solutions that support kaizen continuous improvement initiatives and statistical process control requirements in precision manufacturing operations.
The market benefits from strong partnerships between international chemical providers like ExxonMobil, Dow, and domestic specialty polymer leaders, including Mitsubishi Chemical, Toray Industries, and Sumitomo Chemical, creating comprehensive service ecosystems that prioritize material consistency and processing precision programs. Manufacturing centers in Tokyo, Osaka, Nagoya, and other major industrial areas showcase advanced quality control implementations where polymer systems achieve 98-99% dimensional consistency through integrated monitoring programs.
The South Korean plastic market is characterized by strong international technology provider presence, with companies like LG Chem, SABIC, and Lotte Chemical maintaining significant positions through comprehensive system integration and technical services capabilities for electronics manufacturing and automotive applications.
The market is demonstrating growing emphasis on advanced materials development and precision processing capabilities, as Korean manufacturers increasingly demand customized solutions that integrate with domestic advanced manufacturing infrastructure and sophisticated quality control systems deployed across Samsung, LG, and other major industrial complexes. Local chemical companies and regional specialty manufacturers are gaining market share through strategic partnerships with global providers, offering specialized services including Korean market customization and technical support programs for precision applications.
The competitive landscape shows increasing collaboration between multinational chemical companies and Korean technology specialists, creating hybrid service models that combine international materials expertise with local manufacturing knowledge and quality management systems.
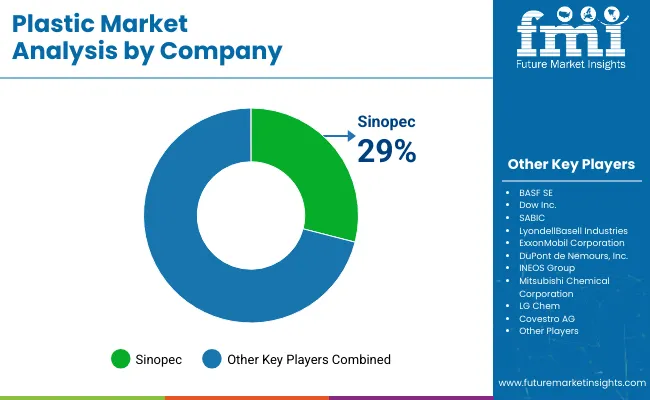
The plastic market features approximately 20-30 meaningful players with moderate concentration, where the top three companies control roughly 16-20% of global market share through established production capacity and extensive petrochemical integration. Competition centers on feedstock access, production scale, and regional manufacturing presence rather than price competition alone.
Market leaders include ExxonMobil, Dow Inc., and SABIC, which maintain competitive advantages through comprehensive petrochemical integration, global production networks, and deep expertise in polymer production and downstream applications, creating high barriers to entry for competitors. These companies leverage vertical integration from refining through polymer production and ongoing technical support relationships to defend market positions while expanding into advanced materials and recycling applications.
Challengers encompass LyondellBasell, Sinopec, and BASF, which compete through specialized polymer grades and strong regional presence in key manufacturing markets. Technology specialists, including INEOS, PetroChina, Reliance Industries, and Formosa Plastics, focus on specific polymer families or vertical applications, offering differentiated capabilities in polyolefins, engineering resins, and specialized performance characteristics.
Regional players and emerging chemical producers create competitive pressure through cost-effective solutions and rapid capacity expansion capabilities, particularly in high-growth markets including China and India, where local presence provides advantages in customer service and logistics optimization. Market dynamics favor companies that combine large-scale production capacity with comprehensive technical support offerings that address the complete polymer lifecycle from resin development through end-of-life recycling solutions.
Plastics represent versatile polymer materials that enable manufacturers to achieve 30-50% weight reduction compared to traditional materials like metal and glass, delivering superior strength-to-weight ratios and processing flexibility with cost-effectiveness in demanding applications.
With the market projected to grow from USD 768.9 billion in 2025 to USD 1,138.2 billion by 2035 at a 4.0% CAGR, these materials offer compelling advantages - lightweight performance, design flexibility, and processing efficiency - making them essential for packaging applications (41.0% market share), automotive components, and construction materials seeking alternatives to heavier, more expensive materials that compromise performance through excessive weight or limited design options.
Scaling market adoption and sustainability advancement requires coordinated action across circular economy policy, recycling infrastructure development, polymer manufacturers, end-use industries, and advanced recycling investment capital.
Circular Economy Integration: Include recycled content requirements in public procurement standards, provide tax incentives for manufacturers using post-consumer recycled materials, and establish domestic recycling infrastructure that reduces reliance on virgin polymer production in critical manufacturing sectors.
Materials Science &Innovation Support: Fund research initiatives on bio-based polymers, chemical recycling technologies, and next-generation sustainable materials. Invest in university-industry partnerships that advance polymer chemistry and advanced recycling techniques for packaging and automotive applications.
Manufacturing Development Incentives: Provide grants for establishing polymer processing facilities near end-use manufacturing centers, offer technical assistance for recycling infrastructure development, and support supply chain development that ensures reliable material availability for domestic manufacturers.
Standards &Quality Infrastructure: Establish national testing facilities for recycled polymer quality validation, develop certification programs for circular economy compliance specialists, and create international standards harmonization that facilitates export of sustainable polymer products to global markets.
Environmental &Sustainability Programs: Promote extended producer responsibility frameworks through mandatory collection targets, support advanced recycling programs for mixed plastic waste, and establish lifecycle assessment frameworks that validate the environmental benefits of lightweighting and material efficiency through polymer adoption.
Performance Standards &Testing: Define standardized measurement protocols for recycled content verification, mechanical property retention, and processing performance across polyethylene (27.0% market dominance), polypropylene, and engineering polymer systems, enabling reliable performance comparison and application-specific selection criteria.
Application Best Practices: Develop comprehensive guidelines for polymer selection in packaging manufacturing (41.0% application dominance), automotive component production, and construction applications, ensuring optimal material performance and sustainability compliance across different manufacturing environments.
Technology Integration Standards: Create compatibility frameworks for recycled content integration, processing equipment specifications, and quality control platforms that facilitate seamless integration across different manufacturing facilities and polymer processing technologies.
Skills Development &Certification: Establish training programs for polymer technicians, quality control specialists, and sustainability compliance managers on advanced processing technologies, recycling system integration, and performance optimization methods that ensure manufacturing excellence.
Advanced Polymer Formulations: Develop next-generation recycled content polymers with enhanced mechanical properties, improved processing characteristics, and multi-functional properties including barrier performance and UV resistance that provide additional value beyond basic structural requirements.
Precision Processing Technologies: Provide automated molding equipment with real-time quality monitoring, material tracking systems, and energy efficiency platforms that ensure consistent polymer processing across high-volume manufacturing operations while minimizing waste and defects.
Customization &Engineering Services: Offer application-specific polymer development, including lightweighting-optimized formulations, recycled content-specific processing parameters, and performance-tailored solutions that address unique requirements in automotive, packaging, and electronics applications.
Technical Support &Integration: Build comprehensive customer support, including processing parameter optimization, troubleshooting services, and performance monitoring that help manufacturers achieve maximum efficiency gains while maintaining consistent production quality.
Application-Focused Product Development: Develop specialized polymer lines for packaging (41.0% market dominance), automotive (significant share), and construction applications, with formulations optimized for each sector's specific performance requirements and sustainability compliance standards.
Geographic Market Strategy: Establish production and technical support capabilities in high-growth markets like India (5.3% CAGR) and China (4.9% CAGR), while maintaining R&D centers in established markets like Germany (3.2% CAGR) for advanced formulation development and quality standards.
Technology Differentiation: Invest in proprietary recycling technologies, bio-based polymer development, and advanced quality control systems that provide superior sustainability performance and enable premium positioning in competitive markets.
Customer Partnership Models: Develop long-term relationships with packaging manufacturers, automotive producers, and construction companies through collaborative product development, recycled content guarantees, and technical consulting services that strengthen customer loyalty.
Chemical Technology Investment: Finance established chemical companies like ExxonMobil, Dow, and SABIC for advanced recycling R&D programs, bio-based polymer capacity expansion, and new sustainable formulation development that serve growing demand in circular economy applications.
Manufacturing Infrastructure Development: Provide capital for establishing regional recycling facilities, advanced processing equipment development, and quality control systems that reduce costs while ensuring consistent recycled content integration across global manufacturing operations.
Innovation &Materials Science: Back specialty chemical startups developing breakthrough bio-based polymers, chemical recycling technologies, and sustainable formulations that enhance performance while addressing environmental concerns and regulatory requirements.
Market Integration &Expansion: Support strategic partnerships between polymer suppliers and end-user industries, finance technology transfer initiatives from research institutions, and enable market consolidation that creates comprehensive sustainable materials solution providers serving multiple application segments.
| Item | Value |
|---|---|
| Quantitative Units | USD 768.9 billion |
| Product Type | Polyethylene (PE), Polypropylene (PP), Polyvinyl Chloride (PVC), Polystyrene (PS), Polyethylene Terephthalate (PET), Other Engineering Polymers |
| Processing Technology | Injection Molding, Extrusion, Blow Molding, Thermoforming, Other |
| End-Use Application | Packaging, Automotive, Construction, Electronics, Healthcare, Other |
| Regions Covered | Asia Pacific, Europe, North America, Latin America, Middle East &Africa |
| Country Covered | China, India, Germany, Brazil, the U.S., the U.K., Japan, and 40+ countries |
| Key Companies Profiled | ExxonMobil, Dow Inc., SABIC, LyondellBasell, Sinopec, BASF SE, INEOS, PetroChina, Reliance Industries, Formosa Plastics |
| Additional Attributes | Dollar sales by product type and end-use application categories, regional adoption trends across Asia Pacific, Europe, and North America, competitive landscape with integrated petrochemical producers and regional converters, manufacturing facility requirements and specifications, integration with circular economy initiatives and recycling systems, innovations in polymer technology and processing systems, and development of sustainable formulations with recycled content and bio-based capabilities. |
The global plastic market is estimated to be valued at USD 768.9 billion in 2025.
The market size for the plastic market is projected to reach USD 1,138.2 billion by 2035.
The plastic market is expected to grow at a 4.0% CAGR between 2025 and 2035.
The key product types in plastic market are polyethylene (pe), polypropylene (pp), polyvinyl chloride (pvc), polystyrene (ps), polyethylene terephthalate (pet) and other engineering polymers.
In terms of processing technology, injection molding segment to command 36.0% share in the plastic market in 2025.


Full Research Suite comprises of:
Market outlook & trends analysis
Interviews & case studies
Strategic recommendations
Vendor profiles & capabilities analysis
5-year forecasts
8 regions and 60+ country-level data splits
Market segment data splits
12 months of continuous data updates
DELIVERED AS:
PDF EXCEL ONLINE
Plastic Tubes for Effervescent Tablets Market Size and Share Forecast Outlook 2025 to 2035
Plastic Banding Market Size and Share Forecast Outlook 2025 to 2035
Plastic Tube Market Size and Share Forecast Outlook 2025 to 2035
Plastic Jar Packaging Market Forecast and Outlook 2025 to 2035
Plastic Cases Market Size and Share Forecast Outlook 2025 to 2035
Plastic Jar Industry Analysis in the United States Size and Share Forecast Outlook 2025 to 2035
Plastic Cutlery Market Forecast and Outlook 2025 to 2035
Plastic Vial Market Forecast and Outlook 2025 to 2035
Plastic Hot and Cold Pipe Market Forecast and Outlook 2025 to 2035
Plastic Retort Can Market Size and Share Forecast Outlook 2025 to 2035
Plastic Gears Market Size and Share Forecast Outlook 2025 to 2035
Plastic Additive Market Size and Share Forecast Outlook 2025 to 2035
Plastic Vials and Ampoules Market Size and Share Forecast Outlook 2025 to 2035
Plastic Healthcare Packaging Market Size and Share Forecast Outlook 2025 to 2035
Plastic Bottle Industry Analysis in Malaysia Size and Share Forecast Outlook 2025 to 2035
Plastic Drum Industry Analysis in Malaysia Size and Share Forecast Outlook 2025 to 2035
Plastic Healthcare Packaging Industry Analysis in Western Europe Size and Share Forecast Outlook 2025 to 2035
Plastic Healthcare Packaging Industry Analysis in Korea Size and Share Forecast Outlook 2025 to 2035
Plastic Healthcare Packaging Industry Analysis in Japan Size and Share Forecast Outlook 2025 to 2035
Plastic Bottles Market Size and Share Forecast Outlook 2025 to 2035

Thank you!
You will receive an email from our Business Development Manager. Please be sure to check your SPAM/JUNK folder too.
Chat With
MaRIA