Plastic Scrap Grinder Machine Market Outlook and Forecast 2025 to 2035

The global plastic scrap grinder machine market is valued at USD 2.4 billion in 2025 and is poised to reach USD 4.5 billion by 2035, reflecting a CAGR of 6.3%. Growth is being driven by stricter environmental regulations, rising adoption of automation, and increased recycling initiatives. Moreover, demand is being supported by industries seeking energy-efficient grinding solutions to align with sustainability goals while reducing operational costs across production facilities.
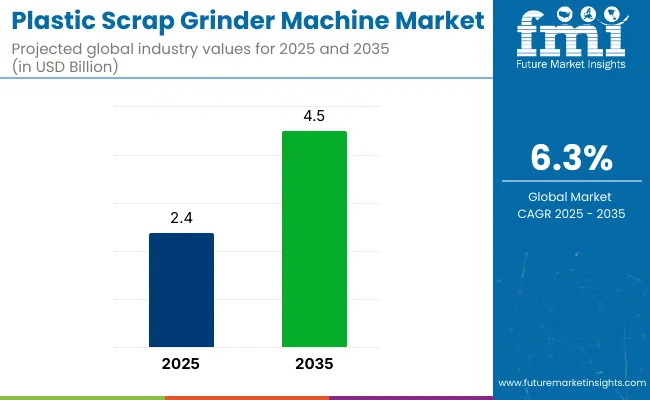
Quick Stats of Plastic Scrap Grinder Machine Market

  • Market Value (2025): USD 2.4 billion
  • Forecast Value (2035): USD 4.5 billion
  • Forecast CAGR: 6.3%
  • Sales Channels Leader in 2025: OEM (60% Market Share)
  • Top Product Leader: Hammer Mill Plastic Grinder Machine (45% Market Share in 2025)
  • Key Growth Region: North America (USA is the fastest-growing market with 6.1% CAGR)

Plastic Scrap Grinder Machine Market

Metric Value
2025 Market Value USD 2.4 billion
2035 Market Value USD 4.5 billion
CAGR (2025 to 2035) 6.3%

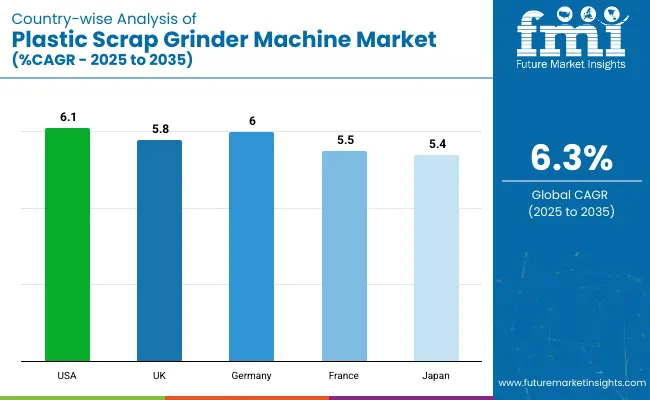
The USA is expected to register the highest CAGR of 6.1%, driven by strict plastic waste management regulations and rapid adoption of automated grinding technologies. Germany follows with a CAGR of 6.0%, supported by strong sustainability initiatives and Industry 4.0 automation.

The UK, with a CAGR of 5.8%, is witnessing steady growth due to its focus on sustainability policies, stricter plastic waste recycling regulations, and the adoption of energy-efficient grinding technologies. By sales channel, the OEM segment is expected to hold a 60% market share in 2025. The hammer mill grinder segment is projected to maintain its dominance, with a market share of 45% in 2025, due to its high grinding efficiency and versatility across various plastic types.

The plastic scrap grinder machine market holds a moderate share across its parent markets. Within the plastic recycling equipment market, it commands a significant 20-25% share due to its core role in size reduction. In the broader recycling machinery market, its share is around 10-12%, given the presence of various other recycling machines.

It contributes about 15% to the plastic waste management market, particularly in pre-processing stages. Within the industrial shredding and grinding equipment market, the share stands at 8-10%. Overall, plastic scrap grinders are essential in closed-loop plastic processing, especially where high throughput and material reusability are critical.

Recent government regulations in the market include strict plastic waste management laws and recycling mandates. The USA has enforced Extended Producer Responsibility (EPR) and EPA’s RCRA rules to boost demand for recycling machinery. The EU introduced its Circular Economy Action Plan, requiring 55% of plastic packaging waste to be recycled by 2030. India’s Plastic Waste Management Rules (2022) mandate 50% recycling of plastic packaging waste by 2025. China’s Five-Year Plan promotes circular economy targets, driving upgrades to grinder machines.

Plastic Scrap Grinder Machine Market by Top Investment Segments

The plastic scrap grinder machine market is segmented by product, capacity, sales channels, and region. By product type, the market is segmented into single shaft plastic grinder machine, double shaft plastic grinder machine, rotary blade plastic grinder machine, and hammer mill plastic grinder machine.

By capacity, it is classified into small capacity plastic grinder machine, medium capacity plastic grinder machine, and large capacity plastic grinder machine. By sales channel, it is divided into OEM and aftermarket. By region, the market is analyzed across North America, Latin America, Western Europe, Eastern Europe, East Asia, South Asia Pacific, and the Middle East and Africa.

Hammer Mill Plastic Grinder Machine to Lead by Product with 45% Market Share

Hammer mill plastic grinder machines are leading the product segment and are expected to hold a 45% share in 2025, driven by their high efficiency and versatility in processing different plastic types.
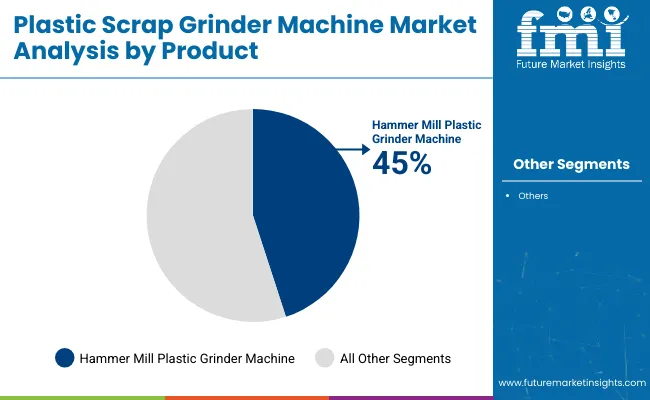
  • Their robust design, lower maintenance requirements, and ability to handle multiple plastic grades make them the preferred choice in the recycling and manufacturing industries.
  • Demand is driven by stricter waste management regulations and the need for reliable, high-capacity grinding solutions that reduce operational downtime and enhance productivity across industrial facilities.

Plastic Scrap Grinder Machine Market Analysis By Product

Medium Capacity Plastic Grinder Machine to Lead by Capacity with 38% Share in 2025

Medium-capacity plastic grinder machines are emerging as the most lucrative in this segment, holding a market share of around 38% in 2025.
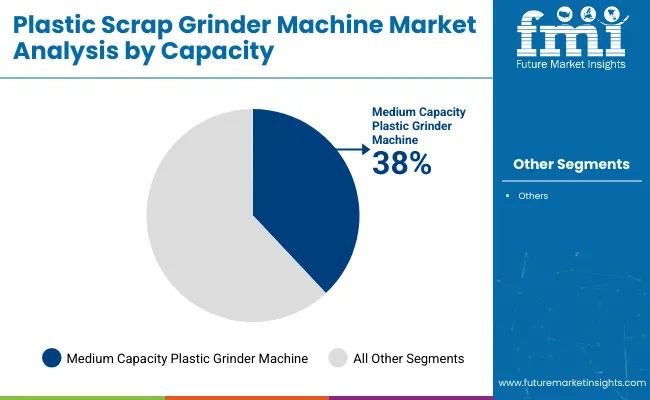
  • Their capability to handle diverse plastic materials while consuming less energy compared to large capacity machines makes them financially viable.
  • The increasing emphasis on sustainable waste processing and operational cost reduction is encouraging industries to prefer these medium-capacity models for regular processing needs.

Plastic Scrap Grinder Machine Market Analysis By Capacity

OEM Segment to Lead by Sales Channel with 60% Market Share in 2025

OEM sales channels are expected to dominate the segment, with a market share of nearly 60% in 2025.
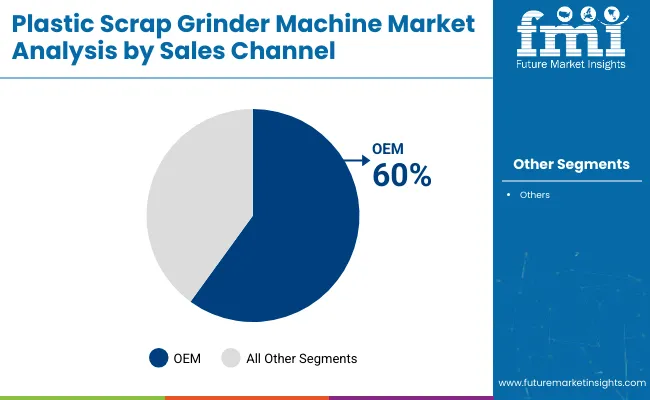
  • OEMs offer technologically advanced grinders with integrated automation and energy-efficient features, along with superior after-sales support and service contracts.
  • This segment’s growth is further supported by the increasing demand from large-scale recycling firms and waste management companies prioritizing machinery durability and long-term operational efficiency.

Plastic Scrap Grinder Machine Market Analysis By Sales Channel

Plastic Scrap Grinder Machine Market Dynamics

The plastic scrap grinder machine market is experiencing steady growth, driven by stricter plastic waste management regulations. Rising adoption of automated and energy-efficient grinding solutions, and the growing demand from the recycling and manufacturing industries for reliable and high-performance equipment.

Recent Trends in the Plastic Scrap Grinder Machine Market
  • AI-powered grinders with predictive maintenance are being launched for higher operational efficiency.
  • Hybrid shredding and granulating systems are gaining popularity for their multi-purpose processing capabilities.
  • IoT-enabled smart monitoring features are being integrated into advanced grinders.
  • Compact and modular grinder designs are emerging to cater to small-scale recycling facilities.

Challenges in the Plastic Scrap Grinder Machine Market

  • High initial investment costs for automated and advanced grinding equipment limit adoption.
  • Rising raw material prices, especially steel and aluminum, are increasing manufacturing costs.
  • Limited government incentives in emerging markets slow down the upgrade to modern grinding technologies.
  • Competition from low-cost manufacturers is putting pricing pressure on established brands.

Analyzing Top Countries Producing and Utilizing Plastic Scrap Grinder Machines

Plastic Scrap Grinder Machine Market Country Wise Analysis

The USA leads the plastic scrap grinder machine market with a projected CAGR of 6.1%, driven by strict EPR laws and recycling infrastructure investments. Germany follows closely at 6.0%, supported by EU circular economy directives and demand for IoT-enabled grinders.

The UK ranks third with a 5.8% CAGR, fueled by government incentives and eco-focused machinery. France and Japan trail slightly at 5.5% and 5.4% respectively, with growth driven by compact, energy-efficient models and AI integration. Overall, the USA and Germany show the strongest momentum due to regulatory push and technological adoption, while Japan and France maintain steady, sustainability-led growth.

The report covers in-depth analysis of 40+ countries; five top-performing OECD countries are highlighted below.

USA Plastic Scrap Grinder Machine Market Analysis

The USA plastic scrap grinder machine demand is projected to grow at a CAGR of 6.1% from 2025 to 2035.

  • Strong enforcement of Extended Producer Responsibility (EPR) regulations.
  • High demand for energy-efficient and automated grinding equipment.
  • Robust investments in recycling infrastructure by large waste management firms.
  • Leading players, such as Genox and Vecoplan, are driving market innovations.

Plastic Scrap Grinder Machine Demand Analysis in the UK

The UK plastic scrap grinder machine sales are projected to grow at a CAGR of 5.8% from 2025 to 2035.

  • Strong focus on recyclable and carbon-neutral plastic processing machinery.
  • Rising demand for compact, energy-saving grinder models.
  • Government incentives supporting advanced recycling equipment installations.
  • Companies like Shini USA are expanding their presence through regional distributors.

Plastic Scrap Grinder Machine Demand Analysis in Germany

Sales of plastic scrap grinder machine in Germany are expected to grow at a CAGR of 6.0% from 2025 to 2035.

  • Strong adherence to EU circular economy and recycling mandates.
  • High demand for automated, IoT-enabled grinder machines.
  • Rising investments in hybrid grinding systems for operational efficiency.
  • Major manufacturers like Zerma and Vecoplan are leading technological advancements.

Plastic Scrap Grinder Machine Demand Analysis in France

Sales of plastic scrap grinder machines in France are forecasted to register a CAGR of 5.5% from 2025 to 2035.

  • Strong enforcement of waste management and recycling policies.
  • High demand for compact grinders for small-scale recycling facilities.
  • Growing adoption of AI-enabled monitoring and predictive maintenance.
  • Investments in environmentally friendly and low-noise grinding technologies.

Plastic Scrap Grinder Machine Demand Analysis in Japan

Plastic scrap grinder machine revenue in Japan is expected to expand at a CAGR of 5.4% from 2025 to 2035.

  • Strong government regulations promote plastic recycling and waste management.
  • High demand for energy-efficient and compact grinder models.
  • Rapid adoption of automated grinding systems with AI capabilities.
  • Leading companies are investing in sustainable and low-emission grinding technologies.

Leading Plastic Scrap Grinder Machines Suppliers and Manufacturers

The plastic scrap grinder machine market is moderately consolidated, with key players like Vecoplan AG, Cumberland Engineering, Rapid Granulator AB, ZERMA Machinery & Recycling Technology, and GENOX Recycling Tech Co., Ltd. leading the industry. These companies focus on innovation, strategic partnerships, and global expansion to maintain their competitive edge.

Vecoplan AG has emphasized sustainability and technological advancement, showcasing its commitment to eco-friendly recycling solutions. Cumberland Engineering, a division of ACS Group, continues to lead in size reduction equipment, offering a broad range of granulators and shredders. ZERMA Machinery & Recycling Technology provides comprehensive solutions to plastic waste processing. GENOX Recycling Tech Co., Ltd. is actively participating in global exhibitions, showcasing its innovative recycling machines.

Recent Plastic Scrap Grinder Machines Industry News

  • In June 2024, Vecoplan entered a strategic partnership with Pla.to Technology, focusing on advanced cleaning solutions for plastic recycling.

Plastic Scrap Grinder Machines Market - Report Scope

Report Attributes Details
Current Total Market Size (2025) USD 2.4 billion
Projected Market Size (2035) USD 4.5 billion
CAGR (2025 to 2035) 6.3%
Base Year for Estimation 2024
Historical Period 2020-2024
Projections Period 2025-2035
Market Analysis Parameters Revenue in USD billions/Volume in Units
By Product Type Single Shaft Plastic Grinder Machine, Double Shaft Plastic Grinder Machine, Rotary Blade Plastic Grinder Machine, Hammer Mill Plastic Grinder Machines
By Capacity Small Capacity Plastic Grinder Machine, Medium Capacity Plastic Grinder Machine, Large Capacity Plastic Grinder Machine
By Sales Channel OEM, Aftermarket
Regions Covered North America, Latin America, Western Europe, Eastern Europe, East Asia, South Asia Pacific, Middle East and Africa
Countries Covered United States, Canada, United Kingdom, Germany, France, China, Japan, South Korea, Brazil, Australia
Key Players Vecoplan AG, Cumberland Engineering, Rapid Granulator AB, ZERMA Machinery & Recycling Technology, Avadh Industries, Archana Extrusion Machinery Manufacturing, GEEPLAST INDIA, Shree Momai Rotocast Containers Pvt. Ltd., WEIMA Maschinenbau GmbH, Jordan Reduction Solutions, Herbold Meckesheim GmbH, Panchal Plastic Machinery Pvt. Ltd., Shini Plastics Technologies, Inc., NGR (Next Generation Recyclingmaschinen), GENOX Recycling Tech Co., Ltd., Amey Engineers, Wiscon Envirotech Inc., Raj Electricals, Harden Machinery Ltd.
Additional Attributes Dollar sales by value, market share analysis by region, and country-wise analysis

Plastic Scrap Grinder Machine Market Segmentation

By Product:

By product, the market is segmented into single shaft plastic grinder machine, double shaft plastic grinder machine, rotary blade plastic grinder machine, and hammer mill plastic grinder machine.

By Capacity:

In terms of capacity, the market is segmented into small capacity plastic grinder machine, medium capacity plastic grinder machine, and large capacity plastic grinder machine.

By Sales Channels:

By sales channels, the market is segmented into OEM and aftermarket.

By Region:

The market is segmented by region into North America, Latin America, Western Europe, South Asia & Pacific, East Asia, Middle East, and Africa.

Table of Content

  1. Executive Summary
    • Global Market Outlook
    • Demand-side Trends
    • Supply-side Trends
    • Technology Roadmap Analysis
    • Analysis and Recommendations
  2. Market Overview
    • Market Coverage / Taxonomy
    • Market Definition / Scope / Limitations
  3. Market Background
    • Market Dynamics
      • Drivers
      • Restraints
      • Opportunity
      • Trends
    • Scenario Forecast
      • Demand in Optimistic Scenario
      • Demand in Likely Scenario
      • Demand in Conservative Scenario
    • Opportunity Map Analysis
    • Product Life Cycle Analysis
    • Supply Chain Analysis
      • Supply Side Participants and their Roles
        • Producers
        • Mid-Level Participants (Traders/ Agents/ Brokers)
        • Wholesalers and Distributors
      • Value Added and Value Created at Node in the Supply Chain
      • List of Raw Material Suppliers
      • List of Existing and Potential Buyer’s
    • Investment Feasibility Matrix
    • Value Chain Analysis
      • Profit Margin Analysis
      • Wholesalers and Distributors
      • Retailers
    • PESTLE and Porter’s Analysis
    • Regulatory Landscape
      • By Key Regions
      • By Key Countries
    • Regional Parent Market Outlook
    • Production and Consumption Statistics
    • Import and Export Statistics
  4. Global Market Analysis 2020 to 2024 and Forecast, 2025 to 2035
    • Historical Market Size Value (USD Billion) & Volume (Units) Analysis, 2020 to 2024
    • Current and Future Market Size Value (USD Billion) & Volume (Units) Projections, 2025 to 2035
      • Y-o-Y Growth Trend Analysis
      • Absolute $ Opportunity Analysis
  5. Global Market Pricing Analysis 2020 to 2024 and Forecast 2025 to 2035
  6. Global Market Analysis 2020 to 2024 and Forecast 2025 to 2035, By Product
    • Introduction / Key Findings
    • Historical Market Size Value (USD Billion) & Volume (Units) Analysis By Product, 2020 to 2024
    • Current and Future Market Size Value (USD Billion) & Volume (Units) Analysis and Forecast By Product, 2025 to 2035
      • Single Shaft Plastic Grinder Machine
      • Double Shaft Plastic Grinder Machine
      • Rotary Blade Plastic Grinder Machine
      • Hammer Mill Plastic Grinder Machine
    • Y-o-Y Growth Trend Analysis By Product, 2020 to 2024
    • Absolute $ Opportunity Analysis By Product, 2025 to 2035
  7. Global Market Analysis 2020 to 2024 and Forecast 2025 to 2035, By Capacity
    • Introduction / Key Findings
    • Historical Market Size Value (USD Billion) & Volume (Units) Analysis By Capacity, 2020 to 2024
    • Current and Future Market Size Value (USD Billion) & Volume (Units) Analysis and Forecast By Capacity, 2025 to 2035
      • Small Capacity Plastic Grinder Machine
      • Medium Capacity Plastic Grinder Machine
      • Large Capacity Plastic Grinder Machine
    • Y-o-Y Growth Trend Analysis By Capacity, 2020 to 2024
    • Absolute $ Opportunity Analysis By Capacity, 2025 to 2035
  8. Global Market Analysis 2020 to 2024 and Forecast 2025 to 2035, By Sales Channels
    • Introduction / Key Findings
    • Historical Market Size Value (USD Billion) & Volume (Units) Analysis By Sales Channels, 2020 to 2024
    • Current and Future Market Size Value (USD Billion) & Volume (Units) Analysis and Forecast By Sales Channels, 2025 to 2035
      • OEM
      • Aftermarket
    • Y-o-Y Growth Trend Analysis By Sales Channels, 2020 to 2024
    • Absolute $ Opportunity Analysis By Sales Channels, 2025 to 2035
  9. Global Market Analysis 2020 to 2024 and Forecast 2025 to 2035, By Region
    • Introduction
    • Historical Market Size Value (USD Billion) & Volume (Units) Analysis By Region, 2020 to 2024
    • Current Market Size Value (USD Billion) & Volume (Units) Analysis and Forecast By Region, 2025 to 2035
      • North America
      • Latin America
      • Western Europe
      • Eastern Europe
      • East Asia
      • South Asia & Pacific
      • Middle East and Africa
    • Market Attractiveness Analysis By Region
  10. North America Market Analysis 2020 to 2024 and Forecast 2025 to 2035, By Country
    • Historical Market Size Value (USD Billion) & Volume (Units) Trend Analysis By Market Taxonomy, 2020 to 2024
    • Market Size Value (USD Billion) & Volume (Units) Forecast By Market Taxonomy, 2025 to 2035
      • By Country
        • USA
        • Canada
        • Mexico
      • By Product
      • By Capacity
      • By Sales Channels
    • Market Attractiveness Analysis
      • By Country
      • By Product
      • By Capacity
      • By Sales Channels
    • Key Takeaways
  11. Latin America Market Analysis 2020 to 2024 and Forecast 2025 to 2035, By Country
    • Historical Market Size Value (USD Billion) & Volume (Units) Trend Analysis By Market Taxonomy, 2020 to 2024
    • Market Size Value (USD Billion) & Volume (Units) Forecast By Market Taxonomy, 2025 to 2035
      • By Country
        • Brazil
        • Argentina
        • Rest of LATAM
      • By Product
      • By Capacity
      • By Sales Channels
    • Market Attractiveness Analysis
      • By Country
      • By Product
      • By Capacity
      • By Sales Channels
    • Key Takeaways
  12. Western Europe Market Analysis 2020 to 2024 and Forecast 2025 to 2035, By Country
    • Historical Market Size Value (USD Billion) & Volume (Units) Trend Analysis By Market Taxonomy, 2020 to 2024
    • Market Size Value (USD Billion) & Volume (Units) Forecast By Market Taxonomy, 2025 to 2035
      • By Country
        • Germany
        • Italy
        • France
        • UK
        • Spain
        • BENELUX
        • Nordic
        • Rest of W.Europe
      • By Product
      • By Capacity
      • By Sales Channels
    • Market Attractiveness Analysis
      • By Country
      • By Product
      • By Capacity
      • By Sales Channels
    • Key Takeaways
  13. Eastern Europe Market Analysis 2020 to 2024 and Forecast 2025 to 2035, By Country
    • Historical Market Size Value (USD Billion) & Volume (Units) Trend Analysis By Market Taxonomy, 2020 to 2024
    • Market Size Value (USD Billion) & Volume (Units) Forecast By Market Taxonomy, 2025 to 2035
      • By Country
        • Russia
        • Hungary
        • Poland
        • Balkan & Baltics
        • Rest of E. Europe
      • By Product
      • By Capacity
      • By Sales Channels
    • Market Attractiveness Analysis
      • By Country
      • By Product
      • By Capacity
      • By Sales Channels
    • Key Takeaways
  14. East Asia Market Analysis 2020 to 2024 and Forecast 2025 to 2035, By Country
    • Historical Market Size Value (USD Billion) & Volume (Units) Trend Analysis By Market Taxonomy, 2020 to 2024
    • Market Size Value (USD Billion) & Volume (Units) Forecast By Market Taxonomy, 2025 to 2035
      • By Country
        • China
        • Japan
        • South Korea
      • By Product
      • By Capacity
      • By Sales Channels
    • Market Attractiveness Analysis
      • By Country
      • By Product
      • By Capacity
      • By Sales Channels
    • Key Takeaways
  15. South Asia & Pacific Market Analysis 2020 to 2024 and Forecast 2025 to 2035, By Country
    • Historical Market Size Value (USD Billion) & Volume (Units) Trend Analysis By Market Taxonomy, 2020 to 2024
    • Market Size Value (USD Billion) & Volume (Units) Forecast By Market Taxonomy, 2025 to 2035
      • By Country
        • India
        • Australia & New Zealand
        • ASEAN
        • Rest of SAP
      • By Product
      • By Capacity
      • By Sales Channels
    • Market Attractiveness Analysis
      • By Country
      • By Product
      • By Capacity
      • By Sales Channels
    • Key Takeaways
  16. Middle East and Africa Market Analysis 2020 to 2024 and Forecast 2025 to 2035, By Country
    • Historical Market Size Value (USD Billion) & Volume (Units) Trend Analysis By Market Taxonomy, 2020 to 2024
    • Market Size Value (USD Billion) & Volume (Units) Forecast By Market Taxonomy, 2025 to 2035
      • By Country
        • GCC Countries
        • Northern Africa
        • South Africa
        • Turkiye
        • Rest of MEA
      • By Product
      • By Capacity
      • By Sales Channels
    • Market Attractiveness Analysis
      • By Country
      • By Product
      • By Capacity
      • By Sales Channels
    • Key Takeaways
  17. Key Countries Market Analysis
    • USA
      • Pricing Analysis
      • Market Share Analysis, 2024
        • By Product
        • By Capacity
        • By Sales Channels
    • Canada
      • Pricing Analysis
      • Market Share Analysis, 2024
        • By Product
        • By Capacity
        • By Sales Channels
    • Brazil
      • Pricing Analysis
      • Market Share Analysis, 2024
        • By Product
        • By Capacity
        • By Sales Channels
    • Mexico
      • Pricing Analysis
      • Market Share Analysis, 2024
        • By Product
        • By Capacity
        • By Sales Channels
    • Argentina
      • Pricing Analysis
      • Market Share Analysis, 2024
        • By Product
        • By Capacity
        • By Sales Channels
  18. Market Structure Analysis
    • Competition Dashboard
    • Competition Benchmarking
    • Market Share Analysis of Top Players
      • By Regional
      • By Product
      • By Capacity
      • By Sales Channels
  19. Competition Analysis
    • Competition Deep Dive
      • Vecoplan AG
        • Overview
        • Product Portfolio
        • Profitability by Market Segments (Product/Age /Sales Channel/Region)
        • Sales Footprint
        • Strategy Overview
          • Marketing Strategy
          • Product Strategy
          • Channel Strategy
      • Cumberland Engineering
        • Overview
        • Product Portfolio
        • Profitability by Market Segments (Product/Age /Sales Channel/Region)
        • Sales Footprint
        • Strategy Overview
          • Marketing Strategy
          • Product Strategy
          • Channel Strategy
      • Rapid Granulator AB
        • Overview
        • Product Portfolio
        • Profitability by Market Segments (Product/Age /Sales Channel/Region)
        • Sales Footprint
        • Strategy Overview
          • Marketing Strategy
          • Product Strategy
          • Channel Strategy
      • ZERMA Machinery & Recycling Technology
        • Overview
        • Product Portfolio
        • Profitability by Market Segments (Product/Age /Sales Channel/Region)
        • Sales Footprint
        • Strategy Overview
          • Marketing Strategy
          • Product Strategy
          • Channel Strategy
      • Avadh Industries
        • Overview
        • Product Portfolio
        • Profitability by Market Segments (Product/Age /Sales Channel/Region)
        • Sales Footprint
        • Strategy Overview
          • Marketing Strategy
          • Product Strategy
          • Channel Strategy
      • Archana Extrusion Machinery Manufacturing
        • Overview
        • Product Portfolio
        • Profitability by Market Segments (Product/Age /Sales Channel/Region)
        • Sales Footprint
        • Strategy Overview
          • Marketing Strategy
          • Product Strategy
          • Channel Strategy
      • GEEPLAST INDIA
        • Overview
        • Product Portfolio
        • Profitability by Market Segments (Product/Age /Sales Channel/Region)
        • Sales Footprint
        • Strategy Overview
          • Marketing Strategy
          • Product Strategy
          • Channel Strategy
      • Shree Momai Rotocast Containers Pvt. Ltd.
        • Overview
        • Product Portfolio
        • Profitability by Market Segments (Product/Age /Sales Channel/Region)
        • Sales Footprint
        • Strategy Overview
          • Marketing Strategy
          • Product Strategy
          • Channel Strategy
      • WEIMA Maschinenbau GmbH
        • Overview
        • Product Portfolio
        • Profitability by Market Segments (Product/Age /Sales Channel/Region)
        • Sales Footprint
        • Strategy Overview
          • Marketing Strategy
          • Product Strategy
          • Channel Strategy
      • Jordan Reduction Solutions
        • Overview
        • Product Portfolio
        • Profitability by Market Segments (Product/Age /Sales Channel/Region)
        • Sales Footprint
        • Strategy Overview
          • Marketing Strategy
          • Product Strategy
          • Channel Strategy
      • Herbold Meckesheim GmbH
        • Overview
        • Product Portfolio
        • Profitability by Market Segments (Product/Age /Sales Channel/Region)
        • Sales Footprint
        • Strategy Overview
          • Marketing Strategy
          • Product Strategy
          • Channel Strategy
      • Panchal Plastic Machinery Pvt. Ltd.
        • Overview
        • Product Portfolio
        • Profitability by Market Segments (Product/Age /Sales Channel/Region)
        • Sales Footprint
        • Strategy Overview
          • Marketing Strategy
          • Product Strategy
          • Channel Strategy
      • Shini Plastics Technologies, Inc.
        • Overview
        • Product Portfolio
        • Profitability by Market Segments (Product/Age /Sales Channel/Region)
        • Sales Footprint
        • Strategy Overview
          • Marketing Strategy
          • Product Strategy
          • Channel Strategy
      • NGR (Next Generation Recyclingmaschinen)
        • Overview
        • Product Portfolio
        • Profitability by Market Segments (Product/Age /Sales Channel/Region)
        • Sales Footprint
        • Strategy Overview
          • Marketing Strategy
          • Product Strategy
          • Channel Strategy
      • GENOX Recycling Tech Co., Ltd.
        • Overview
        • Product Portfolio
        • Profitability by Market Segments (Product/Age /Sales Channel/Region)
        • Sales Footprint
        • Strategy Overview
          • Marketing Strategy
          • Product Strategy
          • Channel Strategy
      • Amey Engineers
        • Overview
        • Product Portfolio
        • Profitability by Market Segments (Product/Age /Sales Channel/Region)
        • Sales Footprint
        • Strategy Overview
          • Marketing Strategy
          • Product Strategy
          • Channel Strategy
      • Wiscon Envirotech Inc.
        • Overview
        • Product Portfolio
        • Profitability by Market Segments (Product/Age /Sales Channel/Region)
        • Sales Footprint
        • Strategy Overview
          • Marketing Strategy
          • Product Strategy
          • Channel Strategy
      • Raj Electricals
        • Overview
        • Product Portfolio
        • Profitability by Market Segments (Product/Age /Sales Channel/Region)
        • Sales Footprint
        • Strategy Overview
          • Marketing Strategy
          • Product Strategy
          • Channel Strategy
      • Harden Machinery Ltd.
        • Overview
        • Product Portfolio
        • Profitability by Market Segments (Product/Age /Sales Channel/Region)
        • Sales Footprint
        • Strategy Overview
          • Marketing Strategy
          • Product Strategy
          • Channel Strategy
  20. Assumptions & Acronyms Used
  21. Research Methodology

List of Tables

  • Table 1: Global Market Value (USD Billion) Forecast by Region, 2020-2035
  • Table 2: Global Market Volume (Units) Forecast by Region, 2020-2035
  • Table 3: Global Market Value (USD Billion) Forecast by Product, 2020-2035
  • Table 4: Global Market Volume (Units) Forecast by Product, 2020-2035
  • Table 5: Global Market Value (USD Billion) Forecast by Capacity, 2020-2035
  • Table 6: Global Market Volume (Units) Forecast by Capacity, 2020-2035
  • Table 7: Global Market Value (USD Billion) Forecast by Sales Channels, 2020-2035
  • Table 8: Global Market Volume (Units) Forecast by Sales Channels, 2020-2035
  • Table 9: North America Market Value (USD Billion) Forecast by Country, 2020-2035
  • Table 10: North America Market Volume (Units) Forecast by Country, 2020-2035
  • Table 11: North America Market Value (USD Billion) Forecast by Product, 2020-2035
  • Table 12: North America Market Volume (Units) Forecast by Product, 2020-2035
  • Table 13: North America Market Value (USD Billion) Forecast by Capacity, 2020-2035
  • Table 14: North America Market Volume (Units) Forecast by Capacity, 2020-2035
  • Table 15: North America Market Value (USD Billion) Forecast by Sales Channels, 2020-2035
  • Table 16: North America Market Volume (Units) Forecast by Sales Channels, 2020-2035
  • Table 17: Latin America Market Value (USD Billion) Forecast by Country, 2020-2035
  • Table 18: Latin America Market Volume (Units) Forecast by Country, 2020-2035
  • Table 19: Latin America Market Value (USD Billion) Forecast by Product, 2020-2035
  • Table 20: Latin America Market Volume (Units) Forecast by Product, 2020-2035
  • Table 21: Latin America Market Value (USD Billion) Forecast by Capacity, 2020-2035
  • Table 22: Latin America Market Volume (Units) Forecast by Capacity, 2020-2035
  • Table 23: Latin America Market Value (USD Billion) Forecast by Sales Channels, 2020-2035
  • Table 24: Latin America Market Volume (Units) Forecast by Sales Channels, 2020-2035
  • Table 25: Western Europe Market Value (USD Billion) Forecast by Country, 2020-2035
  • Table 26: Western Europe Market Volume (Units) Forecast by Country, 2020-2035
  • Table 27: Western Europe Market Value (USD Billion) Forecast by Product, 2020-2035
  • Table 28: Western Europe Market Volume (Units) Forecast by Product, 2020-2035
  • Table 29: Western Europe Market Value (USD Billion) Forecast by Capacity, 2020-2035
  • Table 30: Western Europe Market Volume (Units) Forecast by Capacity, 2020-2035
  • Table 31: Western Europe Market Value (USD Billion) Forecast by Sales Channels, 2020-2035
  • Table 32: Western Europe Market Volume (Units) Forecast by Sales Channels, 2020-2035
  • Table 33: Eastern Europe Market Value (USD Billion) Forecast by Country, 2020-2035
  • Table 34: Eastern Europe Market Volume (Units) Forecast by Country, 2020-2035
  • Table 35: Eastern Europe Market Value (USD Billion) Forecast by Product, 2020-2035
  • Table 36: Eastern Europe Market Volume (Units) Forecast by Product, 2020-2035
  • Table 37: Eastern Europe Market Value (USD Billion) Forecast by Capacity, 2020-2035
  • Table 38: Eastern Europe Market Volume (Units) Forecast by Capacity, 2020-2035
  • Table 39: Eastern Europe Market Value (USD Billion) Forecast by Sales Channels, 2020-2035
  • Table 40: Eastern Europe Market Volume (Units) Forecast by Sales Channels, 2020-2035
  • Table 41: East Asia Market Value (USD Billion) Forecast by Country, 2020-2035
  • Table 42: East Asia Market Volume (Units) Forecast by Country, 2020-2035
  • Table 43: East Asia Market Value (USD Billion) Forecast by Product, 2020-2035
  • Table 44: East Asia Market Volume (Units) Forecast by Product, 2020-2035
  • Table 45: East Asia Market Value (USD Billion) Forecast by Capacity, 2020-2035
  • Table 46: East Asia Market Volume (Units) Forecast by Capacity, 2020-2035
  • Table 47: East Asia Market Value (USD Billion) Forecast by Sales Channels, 2020-2035
  • Table 48: East Asia Market Volume (Units) Forecast by Sales Channels, 2020-2035
  • Table 49: South Asia & Pacific Market Value (USD Billion) Forecast by Country, 2020-2035
  • Table 50: South Asia & Pacific Market Volume (Units) Forecast by Country, 2020-2035
  • Table 51: South Asia & Pacific Market Value (USD Billion) Forecast by Product, 2020-2035
  • Table 52: South Asia & Pacific Market Volume (Units) Forecast by Product, 2020-2035
  • Table 53: South Asia & Pacific Market Value (USD Billion) Forecast by Capacity, 2020-2035
  • Table 54: South Asia & Pacific Market Volume (Units) Forecast by Capacity, 2020-2035
  • Table 55: South Asia & Pacific Market Value (USD Billion) Forecast by Sales Channels, 2020-2035
  • Table 56: South Asia & Pacific Market Volume (Units) Forecast by Sales Channels, 2020-2035
  • Table 57: Middle East and Africa Market Value (USD Billion) Forecast by Country, 2020-2035
  • Table 58: Middle East and Africa Market Volume (Units) Forecast by Country, 2020-2035
  • Table 59: Middle East and Africa Market Value (USD Billion) Forecast by Product, 2020-2035
  • Table 60: Middle East and Africa Market Volume (Units) Forecast by Product, 2020-2035
  • Table 61: Middle East and Africa Market Value (USD Billion) Forecast by Capacity, 2020-2035
  • Table 62: Middle East and Africa Market Volume (Units) Forecast by Capacity, 2020-2035
  • Table 63: Middle East and Africa Market Value (USD Billion) Forecast by Sales Channels, 2020-2035
  • Table 64: Middle East and Africa Market Volume (Units) Forecast by Sales Channels, 2020-2035

List of Figures

  • Figure 1: Global Market Volume (Units) Forecast 2020-2035
  • Figure 2: Global Market Pricing Analysis
  • Figure 3: Global Market Value (USD Billion) Forecast 2020-2035
  • Figure 4: Global Market Value Share and BPS Analysis by Product, 2025 and 2035
  • Figure 5: Global Market Y-o-Y Growth Comparison by Product, 2025-2035
  • Figure 6: Global Market Attractiveness Analysis by Product
  • Figure 7: Global Market Value Share and BPS Analysis by Capacity, 2025 and 2035
  • Figure 8: Global Market Y-o-Y Growth Comparison by Capacity, 2025-2035
  • Figure 9: Global Market Attractiveness Analysis by Capacity
  • Figure 10: Global Market Value Share and BPS Analysis by Sales Channels, 2025 and 2035
  • Figure 11: Global Market Y-o-Y Growth Comparison by Sales Channels, 2025-2035
  • Figure 12: Global Market Attractiveness Analysis by Sales Channels
  • Figure 13: Global Market Value (USD Billion) Share and BPS Analysis by Region, 2025 and 2035
  • Figure 14: Global Market Y-o-Y Growth Comparison by Region, 2025-2035
  • Figure 15: Global Market Attractiveness Analysis by Region
  • Figure 16: North America Market Incremental $ Opportunity, 2025-2035
  • Figure 17: Latin America Market Incremental $ Opportunity, 2025-2035
  • Figure 18: Western Europe Market Incremental $ Opportunity, 2025-2035
  • Figure 19: Eastern Europe Market Incremental $ Opportunity, 2025-2035
  • Figure 20: East Asia Market Incremental $ Opportunity, 2025-2035
  • Figure 21: South Asia & Pacific Market Incremental $ Opportunity, 2025-2035
  • Figure 22: Middle East and Africa Market Incremental $ Opportunity, 2025-2035
  • Figure 23: North America Market Value Share and BPS Analysis by Country, 2025 and 2035
  • Figure 24: North America Market Value Share and BPS Analysis by Product, 2025 and 2035
  • Figure 25: North America Market Y-o-Y Growth Comparison by Product, 2025-2035
  • Figure 26: North America Market Attractiveness Analysis by Product
  • Figure 27: North America Market Value Share and BPS Analysis by Capacity, 2025 and 2035
  • Figure 28: North America Market Y-o-Y Growth Comparison by Capacity, 2025-2035
  • Figure 29: North America Market Attractiveness Analysis by Capacity
  • Figure 30: North America Market Value Share and BPS Analysis by Sales Channels, 2025 and 2035
  • Figure 31: North America Market Y-o-Y Growth Comparison by Sales Channels, 2025-2035
  • Figure 32: North America Market Attractiveness Analysis by Sales Channels
  • Figure 33: Latin America Market Value Share and BPS Analysis by Country, 2025 and 2035
  • Figure 34: Latin America Market Value Share and BPS Analysis by Product, 2025 and 2035
  • Figure 35: Latin America Market Y-o-Y Growth Comparison by Product, 2025-2035
  • Figure 36: Latin America Market Attractiveness Analysis by Product
  • Figure 37: Latin America Market Value Share and BPS Analysis by Capacity, 2025 and 2035
  • Figure 38: Latin America Market Y-o-Y Growth Comparison by Capacity, 2025-2035
  • Figure 39: Latin America Market Attractiveness Analysis by Capacity
  • Figure 40: Latin America Market Value Share and BPS Analysis by Sales Channels, 2025 and 2035
  • Figure 41: Latin America Market Y-o-Y Growth Comparison by Sales Channels, 2025-2035
  • Figure 42: Latin America Market Attractiveness Analysis by Sales Channels
  • Figure 43: Western Europe Market Value Share and BPS Analysis by Country, 2025 and 2035
  • Figure 44: Western Europe Market Value Share and BPS Analysis by Product, 2025 and 2035
  • Figure 45: Western Europe Market Y-o-Y Growth Comparison by Product, 2025-2035
  • Figure 46: Western Europe Market Attractiveness Analysis by Product
  • Figure 47: Western Europe Market Value Share and BPS Analysis by Capacity, 2025 and 2035
  • Figure 48: Western Europe Market Y-o-Y Growth Comparison by Capacity, 2025-2035
  • Figure 49: Western Europe Market Attractiveness Analysis by Capacity
  • Figure 50: Western Europe Market Value Share and BPS Analysis by Sales Channels, 2025 and 2035
  • Figure 51: Western Europe Market Y-o-Y Growth Comparison by Sales Channels, 2025-2035
  • Figure 52: Western Europe Market Attractiveness Analysis by Sales Channels
  • Figure 53: Eastern Europe Market Value Share and BPS Analysis by Country, 2025 and 2035
  • Figure 54: Eastern Europe Market Value Share and BPS Analysis by Product, 2025 and 2035
  • Figure 55: Eastern Europe Market Y-o-Y Growth Comparison by Product, 2025-2035
  • Figure 56: Eastern Europe Market Attractiveness Analysis by Product
  • Figure 57: Eastern Europe Market Value Share and BPS Analysis by Capacity, 2025 and 2035
  • Figure 58: Eastern Europe Market Y-o-Y Growth Comparison by Capacity, 2025-2035
  • Figure 59: Eastern Europe Market Attractiveness Analysis by Capacity
  • Figure 60: Eastern Europe Market Value Share and BPS Analysis by Sales Channels, 2025 and 2035
  • Figure 61: Eastern Europe Market Y-o-Y Growth Comparison by Sales Channels, 2025-2035
  • Figure 62: Eastern Europe Market Attractiveness Analysis by Sales Channels
  • Figure 63: East Asia Market Value Share and BPS Analysis by Country, 2025 and 2035
  • Figure 64: East Asia Market Value Share and BPS Analysis by Product, 2025 and 2035
  • Figure 65: East Asia Market Y-o-Y Growth Comparison by Product, 2025-2035
  • Figure 66: East Asia Market Attractiveness Analysis by Product
  • Figure 67: East Asia Market Value Share and BPS Analysis by Capacity, 2025 and 2035
  • Figure 68: East Asia Market Y-o-Y Growth Comparison by Capacity, 2025-2035
  • Figure 69: East Asia Market Attractiveness Analysis by Capacity
  • Figure 70: East Asia Market Value Share and BPS Analysis by Sales Channels, 2025 and 2035
  • Figure 71: East Asia Market Y-o-Y Growth Comparison by Sales Channels, 2025-2035
  • Figure 72: East Asia Market Attractiveness Analysis by Sales Channels
  • Figure 73: South Asia & Pacific Market Value Share and BPS Analysis by Country, 2025 and 2035
  • Figure 74: South Asia & Pacific Market Value Share and BPS Analysis by Product, 2025 and 2035
  • Figure 75: South Asia & Pacific Market Y-o-Y Growth Comparison by Product, 2025-2035
  • Figure 76: South Asia & Pacific Market Attractiveness Analysis by Product
  • Figure 77: South Asia & Pacific Market Value Share and BPS Analysis by Capacity, 2025 and 2035
  • Figure 78: South Asia & Pacific Market Y-o-Y Growth Comparison by Capacity, 2025-2035
  • Figure 79: South Asia & Pacific Market Attractiveness Analysis by Capacity
  • Figure 80: South Asia & Pacific Market Value Share and BPS Analysis by Sales Channels, 2025 and 2035
  • Figure 81: South Asia & Pacific Market Y-o-Y Growth Comparison by Sales Channels, 2025-2035
  • Figure 82: South Asia & Pacific Market Attractiveness Analysis by Sales Channels
  • Figure 83: Middle East and Africa Market Value Share and BPS Analysis by Country, 2025 and 2035
  • Figure 84: Middle East and Africa Market Value Share and BPS Analysis by Product, 2025 and 2035
  • Figure 85: Middle East and Africa Market Y-o-Y Growth Comparison by Product, 2025-2035
  • Figure 86: Middle East and Africa Market Attractiveness Analysis by Product
  • Figure 87: Middle East and Africa Market Value Share and BPS Analysis by Capacity, 2025 and 2035
  • Figure 88: Middle East and Africa Market Y-o-Y Growth Comparison by Capacity, 2025-2035
  • Figure 89: Middle East and Africa Market Attractiveness Analysis by Capacity
  • Figure 90: Middle East and Africa Market Value Share and BPS Analysis by Sales Channels, 2025 and 2035
  • Figure 91: Middle East and Africa Market Y-o-Y Growth Comparison by Sales Channels, 2025-2035
  • Figure 92: Middle East and Africa Market Attractiveness Analysis by Sales Channels
  • Figure 93: Global Market - Tier Structure Analysis
  • Figure 94: Global Market - Company Share Analysis

Frequently Asked Questions

What is the size of the plastic scrap grinder machine market in 2025?

The market is valued at USD 2.4 billion in 2025.

What is the projected value of the plastic scrap grinder machine market by 2035?

The market is expected to reach USD 4.5 billion by 2035.

What is the CAGR of the plastic scrap grinder machine market from 2025 to 2035?

The market is projected to grow at a CAGR of 6.3% from 2025 to 2035.

What market share do hammer mill plastic grinder machines hold in the plastic scrap grinder machine market in 2025?

Hammer mill plastic grinder machines are expected to hold 45% market share in 2025.

What is the market share of OEM sales channels in the plastic scrap grinder machine market in 2025?

OEM sales channels are expected to account for nearly 60% market share in 2025.

Explore Similar Insights

Future Market Insights

Plastic Scrap Grinder Machine Market