The plastic vials and ampoules market stands at the forefront of a transformative decade that promises to redefine pharmaceutical packaging infrastructure and advanced drug delivery systems. The market's journey from USD 3,142 million in 2025 to USD 5,266.1 million by 2035 represents substantial growth, demonstrating the accelerating adoption of advanced packaging solutions and reliable containment systems across pharmaceutical, biotechnology, and diagnostic sectors.
The first half of the decade (2025-2030) will witness the market climbing from USD 3,142 million to approximately USD 4,089 million, adding USD 947 million in value, which constitutes 44% of the total forecast growth period. This phase will be characterized by the rapid adoption of sterile packaging systems, driven by increasing demand for reliable drug containment products and advanced barrier protection practices worldwide. Enhanced material compatibility and efficient filling features will become standard expectations rather than premium options.
The latter half (2030-2035) will witness sustained growth from USD 4,089 million to USD 5,266.1 million, representing an addition of USD 1,198 million or 56% of the decade's expansion. This period will be defined by mass market penetration of multi-dose packaging systems, integration with comprehensive pharmaceutical platforms, and seamless compatibility with existing production infrastructure. The market trajectory signals fundamental shifts in how pharmaceutical facilities and healthcare professionals approach advanced drug containment solutions, with participants positioned to benefit from sustained demand across multiple therapeutic segments.
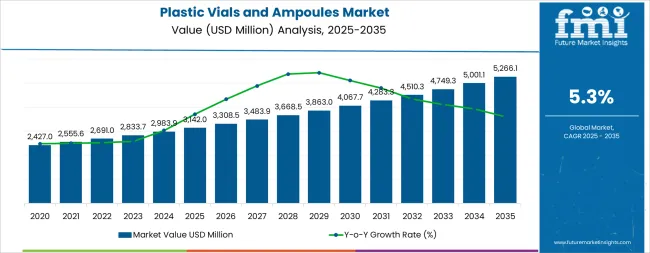
The plastic vials and ampoules market demonstrates distinct growth phases with varying market characteristics and competitive dynamics. Between 2025 and 2030, the market progresses through its technology adoption phase, expanding from USD 3,142 million to USD 4,089 million with steady annual increments averaging 5.4% growth. This period showcases the transition from basic containment solutions to advanced systems with enhanced barrier properties and integrated sterility monitoring becoming mainstream features.
The 2025-2030 phase adds USD 947 million to market value, representing 44% of total decade expansion. Market maturation factors include standardization of filling protocols, declining component costs for production materials, and increasing facility awareness of plastic vial benefits reaching 85-90% effectiveness in pharmaceutical applications. Competitive landscape evolution during this period features established manufacturers like Gerresheimer AG and SCHOTT AG expanding their plastic packaging portfolios while new entrants focus on specialized formulations and enhanced barrier efficiency.
From 2030 to 2035, market dynamics shift toward advanced integration and multi-facility deployment, with growth accelerating from USD 4,089 million to USD 5,266.1 million, adding USD 1,198 million or 56% of total expansion. This phase transition logic centers on universal packaging systems, integration with pharmaceutical automation networks, and deployment across diverse therapeutic scenarios, becoming standard rather than specialized applications. The competitive environment matures with focus shifting from basic containment capability to comprehensive pharmaceutical systems and integration with facility monitoring platforms.
| Metric | Value |
|---|---|
| Market Value (2025) | USD 3,142 million |
| Market Forecast (2035) | USD 5,266.1 million |
| Growth Rate | 5.30% CAGR |
| Leading Material Type | Polyethylene |
| Primary Application | Pharmaceutical Segment |
The market demonstrates strong fundamentals with polyethylene systems capturing a dominant share through advanced barrier properties and reliable deployment capabilities. Pharmaceutical applications drive primary demand, supported by increasing facility spending on advanced packaging systems and quality management solutions. Geographic expansion remains concentrated in developed markets with established pharmaceutical infrastructure, while emerging economies show accelerating adoption rates driven by healthcare modernization and rising drug production requirements.
The plastic vials and ampoules market represents a compelling intersection of pharmaceutical packaging, healthcare infrastructure modernization, and quality management. With robust growth projected from USD 3,142 million in 2025 to USD 5,266.1 million by 2035 at a 5.30% CAGR, this market is driven by increasing pharmaceutical consciousness, healthcare infrastructure upgrades, and regulatory pressures for reliable drug containment practices.
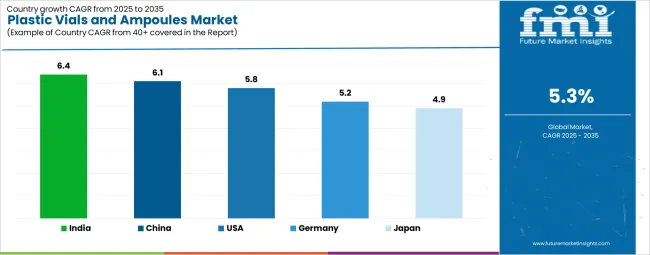
The market's expansion reflects a fundamental shift in how pharmaceutical facilities and healthcare professionals approach packaging infrastructure. Strong growth opportunities exist across diverse applications, from injectable drug operations requiring reliable barrier quality to biotechnology facilities demanding advanced sterility standards. Geographic expansion is particularly pronounced in Asia-Pacific markets, LED by India (6.4% CAGR) and China (6.1% CAGR), while established markets in North America and Europe drive premium positioning and technology innovation.
The dominance of polyethylene systems and pharmaceutical applications underscores the importance of proven barrier technology and operational reliability in driving adoption. Material compatibility and infrastructure integration remain key challenges, creating opportunities for companies that can simplify deployment while maintaining performance standards.
Market expansion rests on three fundamental shifts driving adoption across pharmaceutical packaging and healthcare sectors. 1. Advanced drug containment demand creates compelling operational advantages through plastic vial systems that provide superior barrier protection with reliable performance, enabling facilities to enhance product integrity while maintaining production efficiency and reducing contamination risks. 2. Pharmaceutical modernization programs accelerate as facilities worldwide seek advanced packaging systems that complement traditional glass containers, enabling precise sterility solutions that align with quality goals and regulatory certification requirements. 3. Healthcare infrastructure enhancement drives adoption from pharmaceutical and biotechnology facilities requiring effective containment solutions that minimize drug degradation risks while maintaining storage standards during critical applications.
However, growth faces headwinds from material compatibility challenges that vary across drug types regarding chemical interaction and stability requirements, potentially limiting deployment flexibility in certain therapeutic environments. Technical limitations also persist regarding oxygen permeability and extractable substances that may increase validation costs in sensitive applications with demanding purity standards.
Primary Classification: The market segments by material type into polyethylene, polypropylene, cyclic olefin polymer (COP), and cyclic olefin copolymer (COC) categories, representing the evolution from basic containment systems to advanced barrier solutions for comprehensive pharmaceutical operations.
Secondary Breakdown: Application segmentation divides the market into pharmaceutical, biotechnology, diagnostic, and veterinary sectors, reflecting distinct requirements for sterility standards, facility integration, and regulatory compliance.
Regional Classification: Geographic distribution covers North America, Europe, Asia Pacific, Latin America, and the Middle East & Africa, with developed markets leading adoption while emerging economies show accelerating growth patterns driven by pharmaceutical modernization programs.
The segmentation structure reveals technology progression from polyethylene packaging systems toward integrated specialty polymer platforms with enhanced barrier and compatibility capabilities, while application diversity spans from pharmaceutical operations to biotechnology facilities requiring precise quality management solutions.
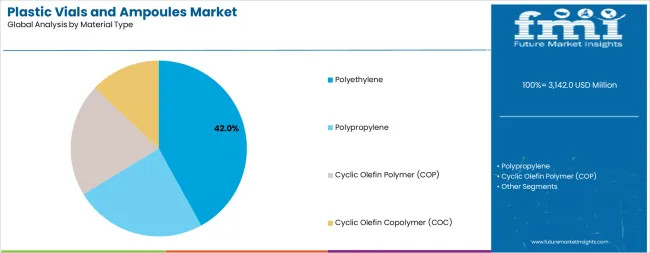
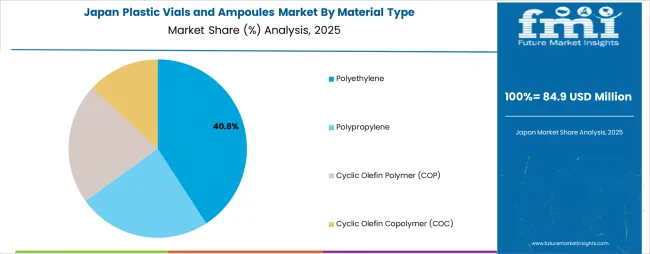
Polyethylene segment is estimated to account for 42% of the plastic vials and ampoules market share in 2025. The segment's leading position stems from its fundamental role as a cost-effective component in pharmaceutical packaging applications and its extensive use across multiple therapeutic sectors. Polyethylene's dominance is attributed to its superior flexibility properties, including impact resistance, moisture barrier protection, and manufacturing versatility capabilities that make it indispensable for pharmaceutical containment operations.
Market Position: Polyethylene systems command the leading position in the plastic vials and ampoules market through advanced barrier features, including comprehensive moisture protection, extended shelf life, and reliable performance that enable facilities to deploy cost-effective packaging solutions across diverse pharmaceutical environments.
Value Drivers: The segment benefits from facility preference for proven material technology that provides adequate protection without requiring complex validation modifications. Reliable design features enable deployment in pharmaceutical manufacturing environments, generic drug facilities, and over-the-counter applications where performance and cost represent critical operational requirements.
Competitive Advantages: Polyethylene systems differentiate through manufacturing efficiency, proven barrier performance, and compatibility with standard filling systems that enhance facility productivity while maintaining cost-effective operational profiles suitable for diverse pharmaceutical applications.
Key market characteristics:
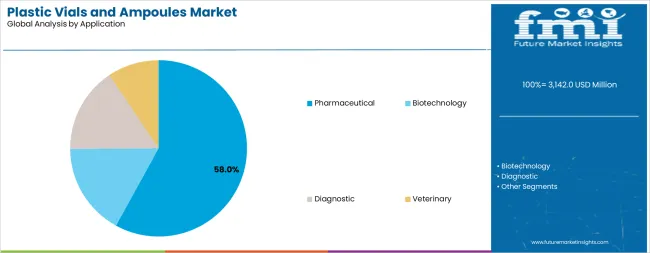
Pharmaceutical segment is projected to hold 58% of the plastic vials and ampoules market share in 2025. The segment's market leadership is driven by the extensive use of plastic packaging in injectable drug formulation, oral liquid medications, diagnostic reagents, and therapeutic compounds, where vials serve as both a protective container and delivery facilitator. The pharmaceutical industry's consistent demand for high-quality, reliable containment materials supports the segment's dominant position.
Market Context: Pharmaceutical applications dominate the market due to widespread adoption of advanced packaging materials and increasing focus on drug stability management, patient safety, and regulatory compliance applications that enhance protection standards while maintaining product integrity.
Appeal Factors: Pharmaceutical customers prioritize material compatibility, barrier consistency, and integration with existing manufacturing infrastructure that enables coordinated deployment across multiple facility systems. The segment benefits from substantial research budgets and development programs that emphasize quality enhancement for drug manufacturing and distribution operations.
Growth Drivers: Pharmaceutical modernization programs incorporate plastic vials as standard materials for drug packaging and delivery applications. At the same time, biotechnology industry initiatives are increasing demand for high-quality containment that complies with regulatory standards and enhances product stability.
Market Challenges: Drug compatibility requirements and validation complexity issues may limit deployment flexibility in certain therapeutic types or existing manufacturing scenarios.
Application dynamics include:
Growth Accelerators: Pharmaceutical modernization drives primary adoption as plastic vial systems provide reliable barrier capabilities that enable drug protection without glass breakage risks, supporting regulatory compliance and operational efficiency that require precise quality management. Healthcare demand accelerates market expansion as facilities seek effective containment solutions that minimize contamination costs while maintaining sterility standards during critical manufacturing and distribution operations. Biopharmaceutical spending increases worldwide, creating sustained demand for advanced packaging systems that complement traditional containers and provide operational flexibility in complex pharmaceutical environments.
Growth Inhibitors: Material compatibility challenges vary across drug types regarding chemical interaction and stability requirements, which may limit deployment flexibility and market penetration in facilities with restrictive validation modifications. Technical performance limitations persist regarding oxygen permeability applications and extractable substances that may increase validation costs in demanding environments with sensitive formulation patterns. Market fragmentation across multiple pharmaceutical codes and regulatory standards creates compatibility concerns between different packaging manufacturers and existing facility infrastructure.
Market Evolution Patterns: Adoption accelerates in biopharmaceutical and vaccine sectors where advanced barrier properties justify material costs, with geographic concentration in developed markets transitioning toward mainstream adoption in emerging economies driven by pharmaceutical modernization and healthcare infrastructure development. Technology development focuses on enhanced barrier capabilities, improved chemical resistance, and integration with automated filling systems that optimize production scheduling and quality monitoring. The market could face disruption if alternative packaging technologies or regulatory restrictions significantly limit plastic vial deployment in pharmaceutical or biotechnology applications.
The plastic vials and ampoules market demonstrates varied regional dynamics with Growth Leaders including India (6.4% CAGR) and China (6.1% CAGR) driving expansion through pharmaceutical modernization and healthcare infrastructure development. Steady Performers encompass the USA (5.8% CAGR), Germany (5.2% CAGR), and Japan (4.9% CAGR), benefiting from established pharmaceutical sectors and advanced packaging adoption.
| Country | CAGR (2025-2035) |
|---|---|
| India | 6.4% |
| China | 6.1% |
| United States | 5.8% |
| Germany | 5.2% |
| Japan | 4.9% |
Regional synthesis reveals Asia-Pacific markets leading growth through pharmaceutical modernization and healthcare infrastructure development, while European countries maintain steady expansion supported by technology advancement and facility modernization requirements. North American markets show strong growth driven by biopharmaceutical applications and contract manufacturing integration trends.
India establishes regional leadership through aggressive pharmaceutical expansion programs and comprehensive healthcare infrastructure development, integrating advanced plastic vial systems as standard components in injectable drug and vaccine manufacturing applications. The country's 6.4% CAGR through 2035 reflects government initiatives promoting domestic pharmaceutical production and generic drug capabilities that mandate the use of advanced packaging systems in pharmaceutical and biotechnology operations. Growth concentrates in major pharmaceutical hubs, including Mumbai, Hyderabad, and Ahmedabad, where manufacturing modernization showcases integrated packaging systems that appeal to domestic operators seeking cost-effective containment solutions and export quality applications.
Indian manufacturers are developing economical plastic vial solutions that combine domestic production advantages with regulatory compliance features, including multi-material formulations and automated inspection capacity.
Strategic Market Indicators:
The Chinese market emphasizes large-scale pharmaceutical deployment, including rapid biopharmaceutical expansion and comprehensive healthcare infrastructure development that increasingly incorporates plastic vials for injectable drugs and vaccine containment applications. The country is projected to show a 6.1% CAGR through 2035, driven by massive healthcare investments under national pharmaceutical programs and commercial demand for reliable, cost-effective packaging systems. Chinese pharmaceutical facilities prioritize operational effectiveness with plastic vials delivering consistent performance through advanced barrier properties and filling compatibility capabilities.
Technology deployment channels include major pharmaceutical distributors, specialized contract manufacturers, and institutional procurement programs that support validated production for complex therapeutic applications.
Performance Metrics:
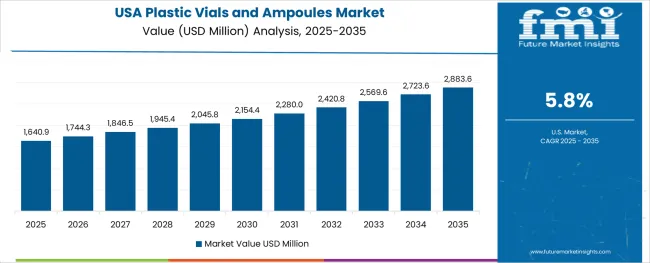
The USA market emphasizes advanced plastic vial features, including precision barrier systems and integration with comprehensive pharmaceutical platforms that manage drug stability, fill-finish automation, and quality tracking applications through unified manufacturing systems. The country is projected to show a 5.8% CAGR through 2035, driven by facility modernization under biopharmaceutical equipment upgrades and commercial demand for reliable, advanced packaging systems. American pharmaceutical facilities prioritize operational effectiveness with plastic vials delivering consistent performance through advanced material formulations and automated inspection capabilities.
Technology deployment channels include major pharmaceutical distributors, specialized contract manufacturers, and facility procurement programs that support validated application for complex biopharmaceutical operations.
Performance Metrics:
In Munich, Frankfurt, and Berlin, German pharmaceutical facilities and biotechnology companies are implementing advanced plastic vial systems to enhance drug protection capabilities and support regulatory compliance that aligns with quality requirements and manufacturing protocols. The German market demonstrates sustained growth with a 5.2% CAGR through 2035, driven by facility modernization programs and pharmaceutical equipment upgrades that emphasize advanced packaging systems for injectable drug and biologic applications. German pharmaceutical facilities are prioritizing plastic vial systems that provide reliable barrier capabilities while maintaining compliance with quality standards and minimizing contamination failures, particularly important in precision biopharmaceutical and vaccine operations.
Market expansion benefits from pharmaceutical excellence programs that mandate high-performance materials in manufacturing facility specifications, creating sustained demand across Germany's pharmaceutical and biotechnology sectors, where product integrity and quality represent critical requirements.
Strategic Market Indicators:
Japan's advanced pharmaceutical market demonstrates sophisticated plastic vial deployment, growing at 4.9% CAGR, with documented operational effectiveness in biopharmaceutical manufacturing and vaccine applications through integration with existing filling systems and quality control infrastructure. The country leverages engineering expertise in polymer technology and precision manufacturing to maintain market leadership. Pharmaceutical centers, including Tokyo, Osaka, and Kobe, showcase premium installations where plastic vial systems integrate with comprehensive pharmaceutical platforms and quality management systems to optimize drug protection and operational effectiveness.
Japanese pharmaceutical facilities prioritize system reliability and material standards in packaging development, creating demand for premium vial systems with advanced features, including enhanced barrier control and integration with automated filling systems. The market benefits from established pharmaceutical infrastructure and willingness to invest in advanced material technologies that provide long-term operational benefits and compliance with regulatory requirements.
Market Intelligence Brief:
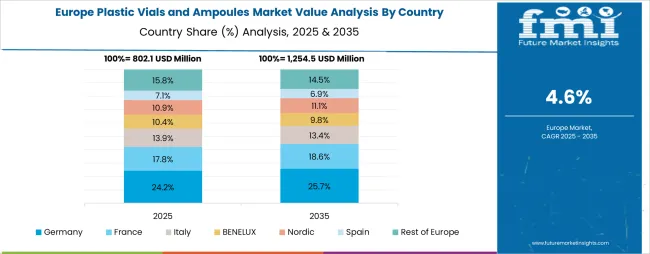
The plastic vials and ampoules market in Europe is projected to grow from USD 932 million in 2025 to USD 1,564 million by 2035, registering a CAGR of 5.3% over the forecast period. Germany is expected to maintain its leadership position with a 36.8% market share in 2025, declining slightly to 36.4% by 2035, supported by its advanced pharmaceutical infrastructure and major biotechnology centers, including Bavaria and Hesse.
The United Kingdom follows with a 24.3% share in 2025, projected to reach 24.7% by 2035, driven by comprehensive pharmaceutical modernization and biopharmaceutical manufacturing initiatives. France holds a 19.2% share in 2025, expected to maintain 19.5% by 2035 through established pharmaceutical sectors and packaging technology adoption. Italy commands a 11.6% share, while Spain accounts for 6.4% in 2025. The Rest of Europe region is anticipated to gain momentum, expanding its collective share from 1.7% to 2.1% by 2035, attributed to increasing pharmaceutical adoption in Nordic countries and emerging Eastern European contract manufacturing facilities implementing advanced packaging programs.
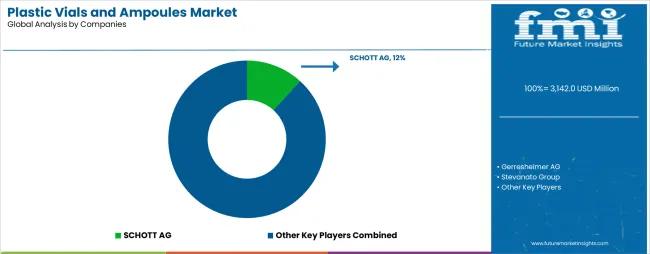
The plastic vials and ampoules market operates with moderate concentration, featuring approximately 15-22 participants, where leading companies control roughly 45-50% of the global market share through established pharmaceutical relationships and comprehensive product portfolios. Competition emphasizes advanced barrier capabilities, material compatibility, and regulatory compliance rather than price-based rivalry.
Market Leaders encompass Gerresheimer AG, SCHOTT AG, and Stevanato Group, which maintain competitive advantages through extensive polymer science expertise, global manufacturing networks, and comprehensive validation engineering capabilities that create customer loyalty and support premium pricing. These companies leverage decades of pharmaceutical experience and ongoing research investments to develop advanced plastic vial systems with enhanced barrier and compatibility features.
Technology Challengers include West Pharmaceutical Services, Corning Incorporated, and SGD Pharma, which compete through specialized material technology focus and innovative polymer interfaces that appeal to pharmaceutical customers seeking advanced containment capabilities and operational flexibility. These companies differentiate through rapid product development cycles and specialized therapeutic application focus.
Market dynamics favor participants that combine reliable barrier materials with advanced technical support, including validation guidance and quality monitoring capabilities. Competitive pressure intensifies as traditional glass manufacturers expand into plastic packaging systems. At the same time, specialized polymer companies challenge established players through innovative containment solutions and cost-effective products targeting specialized biopharmaceutical segments.
| Item | Value |
|---|---|
| Quantitative Units | USD 3,142 million |
| Material Type | Polyethylene, Polypropylene, Cyclic Olefin Polymer (COP), Cyclic Olefin Copolymer (COC) |
| Application | Pharmaceutical, Biotechnology, Diagnostic, Veterinary |
| Regions Covered | North America, Europe, Asia Pacific, Latin America, Middle East & Africa |
| Countries Covered | United States, Germany, Japan, India, China, and 25+ additional countries |
| Key Companies Profiled | Gerresheimer AG, SCHOTT AG, Stevanato Group, West Pharmaceutical Services, Corning Incorporated, SGD Pharma |
| Additional Attributes | Dollar sales by material type and application categories, regional adoption trends across North America, Europe, and Asia-Pacific, competitive landscape with polymer manufacturers and pharmaceutical suppliers, facility preferences for barrier properties and material compatibility, integration with filling automation platforms and quality systems, innovations in barrier technology and validation efficiency, and development of ready-to-use solutions with enhanced sterility and inspection capabilities |
The global plastic vials and ampoules market is estimated to be valued at USD 3,142.0 million in 2025.
The market size for the plastic vials and ampoules market is projected to reach USD 5,266.1 million by 2035.
The plastic vials and ampoules market is expected to grow at a 5.3% CAGR between 2025 and 2035.
The key product types in plastic vials and ampoules market are polyethylene, polypropylene, cyclic olefin polymer (cop) and cyclic olefin copolymer (coc).
In terms of application, pharmaceutical segment to command 58.0% share in the plastic vials and ampoules market in 2025.


Our Research Products

The "Full Research Suite" delivers actionable market intel, deep dives on markets or technologies, so clients act faster, cut risk, and unlock growth.

The Leaderboard benchmarks and ranks top vendors, classifying them as Established Leaders, Leading Challengers, or Disruptors & Challengers.

Locates where complements amplify value and substitutes erode it, forecasting net impact by horizon

We deliver granular, decision-grade intel: market sizing, 5-year forecasts, pricing, adoption, usage, revenue, and operational KPIs—plus competitor tracking, regulation, and value chains—across 60 countries broadly.

Spot the shifts before they hit your P&L. We track inflection points, adoption curves, pricing moves, and ecosystem plays to show where demand is heading, why it is changing, and what to do next across high-growth markets and disruptive tech

Real-time reads of user behavior. We track shifting priorities, perceptions of today’s and next-gen services, and provider experience, then pace how fast tech moves from trial to adoption, blending buyer, consumer, and channel inputs with social signals (#WhySwitch, #UX).

Partner with our analyst team to build a custom report designed around your business priorities. From analysing market trends to assessing competitors or crafting bespoke datasets, we tailor insights to your needs.
Supplier Intelligence
Discovery & Profiling
Capacity & Footprint
Performance & Risk
Compliance & Governance
Commercial Readiness
Who Supplies Whom
Scorecards & Shortlists
Playbooks & Docs
Category Intelligence
Definition & Scope
Demand & Use Cases
Cost Drivers
Market Structure
Supply Chain Map
Trade & Policy
Operating Norms
Deliverables
Buyer Intelligence
Account Basics
Spend & Scope
Procurement Model
Vendor Requirements
Terms & Policies
Entry Strategy
Pain Points & Triggers
Outputs
Pricing Analysis
Benchmarks
Trends
Should-Cost
Indexation
Landed Cost
Commercial Terms
Deliverables
Brand Analysis
Positioning & Value Prop
Share & Presence
Customer Evidence
Go-to-Market
Digital & Reputation
Compliance & Trust
KPIs & Gaps
Outputs
Full Research Suite comprises of:
Market outlook & trends analysis
Interviews & case studies
Strategic recommendations
Vendor profiles & capabilities analysis
5-year forecasts
8 regions and 60+ country-level data splits
Market segment data splits
12 months of continuous data updates
DELIVERED AS:
PDF EXCEL ONLINE
Leading Providers & Market Share in Plastic Vials and Ampoules Industry
Plastic Tubes for Effervescent Tablets Market Size and Share Forecast Outlook 2025 to 2035
Plastic Banding Market Size and Share Forecast Outlook 2025 to 2035
Plastic Tube Market Size and Share Forecast Outlook 2025 to 2035
Plastic Jar Packaging Market Forecast and Outlook 2025 to 2035
Plastic Cases Market Size and Share Forecast Outlook 2025 to 2035
Plastic Jar Industry Analysis in the United States Size and Share Forecast Outlook 2025 to 2035
Plastic Cutlery Market Forecast and Outlook 2025 to 2035
Plastic Vial Market Forecast and Outlook 2025 to 2035
Plastic Hot and Cold Pipe Market Forecast and Outlook 2025 to 2035
Plastic Retort Can Market Size and Share Forecast Outlook 2025 to 2035
Plastic Gears Market Size and Share Forecast Outlook 2025 to 2035
Plastic Additive Market Size and Share Forecast Outlook 2025 to 2035
Plastic Market Size and Share Forecast Outlook 2025 to 2035
Plastic Healthcare Packaging Market Size and Share Forecast Outlook 2025 to 2035
Plastic Bottle Industry Analysis in Malaysia Size and Share Forecast Outlook 2025 to 2035
Plastic Drum Industry Analysis in Malaysia Size and Share Forecast Outlook 2025 to 2035
Plastic Healthcare Packaging Industry Analysis in Western Europe Size and Share Forecast Outlook 2025 to 2035
Plastic Healthcare Packaging Industry Analysis in Korea Size and Share Forecast Outlook 2025 to 2035
Plastic Healthcare Packaging Industry Analysis in Japan Size and Share Forecast Outlook 2025 to 2035

Thank you!
You will receive an email from our Business Development Manager. Please be sure to check your SPAM/JUNK folder too.
Chat With
MaRIA