This site uses cookies, including third-party cookies, that help us to provide and improve our services.

Privacy Policy
- Global Locations -
Headquarters
Future Market Insights, Inc.
Christiana Corporate, 200 Continental Drive, Suite 401, Newark, Delaware - 19713, United States
T: +1-845-579-5705
MEA
Market Access DMCC

1602-6 Jumeirah Bay X2 Tower, Plot No: JLT-PH2-X2A,

Jumeirah Lakes Towers, Dubai,

United Arab Emirates

Americas
Future Market Insights
616 Corporate Way, Suite 2-9018,
Valley Cottage, NY 10989,
United States
T: +1-347-918-3531
Europe
Future Market Insights
3rd Floor, 207 Regent Street,
London W1B 3HH
United Kingdom
T: + 44 (0) 20 8123 9659
D: +44 (0) 20 3287 4268
APAC
Future Market Insights
Office No. 401-A, 4th Floor,
VANTAGE 9, S.No. 36/1/1,
Baner, Pune 411045 India

Monoclonal Antibodies Market

Increased usage of Monoclonal Antibodies in the treatment of Many Cancers to push Market Growth

Monoclonal Antibodies Market by Production Type, Source, Application, End-User & Region | Forecast 2022 to 2032

Monoclonal Antibodies Market Snapshot (2022 to 2032)

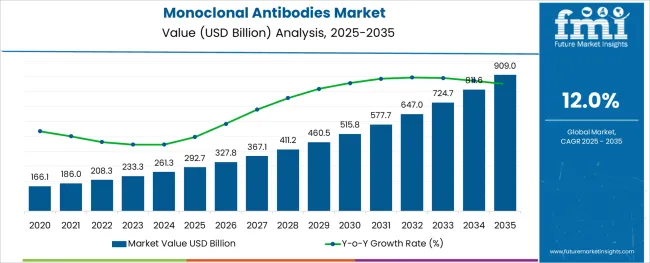
[286 Pages Report] The global monoclonal antibodies market was valued at US$ 186 Billion in 2021 and is projected to exhibit a CAGR of 12% from 2022 to 2032. The rising prevalence of chronic diseases such as cancer, cardiovascular diseases, and others is increasing the demand for biologics, which is anticipated to serve as a key factor driving the monoclonal antibodies (mAbs) market. Similarly, increasing applications of mAb therapies for targeted therapies and rising awareness about such therapies amongst patients and physicians is expected to significantly contribute toward the market growth.

Increased usage of Monoclonal antibodies in the treatment of many cancers in industrialized countries, is leading to a rapid rise in the worldwide monoclonal antibody market. As per the GLOBOCAN 2020 research, there were 19.3 million new cancer diagnoses and approximately 10 million cancer-related deaths worldwide.

In order to control the rising number, research & development activities in the market are creating new opportunities. New gene-based therapy, new research related to the application of monoclonal antibodies in treating other deadly diseases, such as COVID-19, disease diagnostics, and treatment of other diseases, including auto-immune, viral disease treatment, and government approval of new antibodies may all contribute to the market's growth.

For instance, Union Chimique Belge (UCB) signed a license agreement with Roche and Genentech in July 2020 for the manufacturing and commercialization of UCB0107, a potent monoclonal antibody for the treatment of progressive supranuclear palsy (PSP) and Alzheimer's disease, but it is still being studied.

Data Points

Key Statistics

Estimated Base Year Value (2021)

US$ 186 Billion

Expected Market Value (2022)

US$ 208.32 Billion

Anticipated Forecast Value (2032)

US$ 647.01 Billion

Projected Growth Rate (2022 to 2032)

12% CAGR

Customize this Report

Let us know your requirement to get
100% FREE customization

2017-2021 Monoclonal Antibodies Demand Analysis vs. Forecast 2022-2032

The global demand for Monoclonal Antibodies is projected to increase at a CAGR of 12% during the forecast period between 2022 and 2032, reaching a total of US$ 647.01 Billion in 2032, according to a report from Future Market Insights (FMI). From 2017 to 2021, sales witnessed significant growth, registering a CAGR of 6.1%.

Human mAbs offer efficient modulation in effector functions and are less immunogenic as compared to chimeric or humanized mAbs. Such antibodies can be produced through the use of phage display and hybridoma technologies in transgenic mice. As a result, with recent technological progress in genetic engineering, the production of fully human mAbs is anticipated to gain traction in the near future.

Humanized mAbs are expected to reveal the fastest CAGR in the forecast period due to their widespread use against a broad range of target antigens such as cancer cells, immunosuppression, and immunomodulatory molecules. Demand for such antibodies is also supported by their lower immunogenicity as compared to chimeric mAbs. However, these antibodies are more immunogenic as compared to human mAbs, which may restrict the market growth.

Which are Some Prominent Drivers of the Monoclonal Antibodies Market?

Extensive Uptake during the Pandemic Crisis for Developing Drugs provided a Major Boost in past years

The COVID-19 pandemic has increased the market expansion prospects by fueling the development of several mAbs directed against the SARS-CoV-2 virus. As mAbs represent a promising alternative for the mitigation of COVID-19 due to their safety and effectiveness, several such antibodies have attained emergency use authorizations (EUA) from the U.S. FDA. For instance, in February 2022, the U.S. FDA granted a EUA to Eli Lilly’s bebtelovimab for the treatment of COVID-19 patients that are at risk of developing severe disease or who may need hospitalization.

In addition, the U.S. Department of Health and Human Services announced the distribution of at least 600,000 free bebtelovimab courses, along with an optional purchase of 500,000 additional doses in the future, thus creating new opportunities for growth of mAbs/Key advantages offered by mAb therapies over previous therapies in terms of specificity, effectiveness, and ease of delivery have led to numerous new product launches and approvals in this domain. Over 100 mAb products have been approved by the US FDA and the scope of therapeutic mAb applications is expected to grow further due to the development of antibody fragments, antibody derivatives, and bispecific antibodies that offer advanced treatment options.

Increased Number of Strategic Initiatives Presenting Lucrative Opportunities for Monoclonal Antibodies

The market is also favored by the strategic initiatives undertaken by key players for the development and marketing of mAb products. For instance, in October 2021, T-Cure Bioscience, Inc. collaborated with Atlas Antibodies AB for the production and supply of CT83 mAbs.

Similarly, in January 2022, Ono Pharmaceutical Co., Ltd. and Neurimmune AG collaborated on the creation of mAb drugs against new therapeutic targets for neurodegenerative diseases. Such initiatives are expected to open new growth opportunities and positively affect market growth.

Sabyasachi Ghosh
Sabyasachi Ghosh
Principal Consultant
LinkedIn
Talk to Analyst

Find your sweet spots for generating winning opportunities in this market.

Talk to Analyst

What are the Challenges Faced by the Monoclonal Antibodies Market?

High Development Costs of Monoclonal Antibodies Hindering Growth

High costs associated with the development of mAbs and the resultant increase in prices for mAb therapeutics can impede market growth in the near future. For instance, COVID-19 treatment mAbs such as Regeneron’s REGEN-COV (casirivimab and imdevimab), and GlaxoSmithKline & Vir Biotechnology’s sotrovimab cost around USD 1,250 and USD 2,100 per infusion, respectively. Such high drug prices can limit access to mAb therapies for large patient populations in developing countries and restrict mAbs adoption.
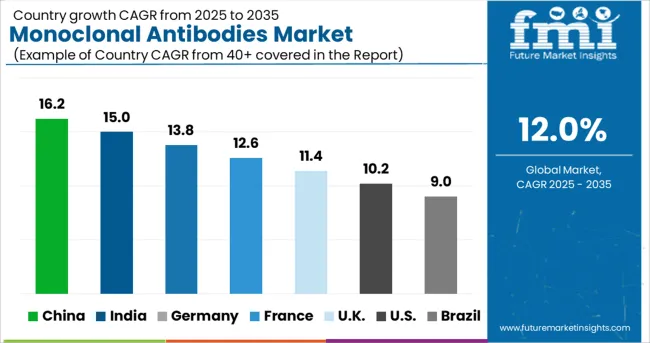
Country-Wise Insights

What Makes North America the Largest Market for Monoclonal Antibodies?

Expansion of the Healthcare Sector in the U.S. Will Drive the Adoption of Monoclonal Antibodies

North America recorded the largest market share of 46.2% in 2021 due to the presence of a highly developed healthcare infrastructure, high patient awareness, and growth in cancer research prospects, among other factors.

Moreover, increasing government expenditure for cancer research and the presence of key players such as Pfizer Inc., Amgen, Inc., and Merck & Co., among others, are expected to boost market growth.

Why is Asia Pacific Considered a Lucrative Region for the Monoclonal Antibodies Market?

Increasing Medical Tourism in Asia Pacific is Spurring Demand for Monoclonal Antibodies

Asia Pacific region is projected to exhibit the fastest growth rate in the forecast period due to the increasing disposable income, availability of a large patient pool for mAb cancer therapeutics, and rising focus on healthcare.

Countries such as India and China offer attractive investment opportunities for clinical research and are anticipated to positively drive research and development prospects for mAbs.

MarketNage
Become a MarketNgage Insider

A unified Market Research Subscription Platform, built for today's disparate research needs.

Category-wise Insights

By Production Type, Which Monoclonal Antibody is Driving Market Growth?

In-vivo Production Type is expected to grow at a Significant Rate

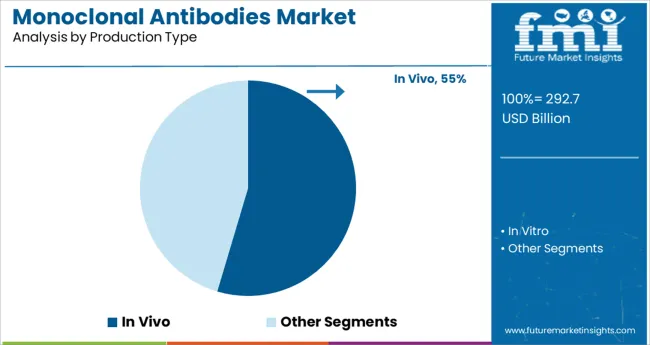
In vivo production held the largest market share in 2021 due to its economic viability in long production runs and lower propensity for contamination with foreign antigens. In addition, the availability of serum-free culture media and semi-permeable membrane-based systems has increased the feasibility of biomanufacturing operations and is likely to accelerate segment growth. However, the production type is limited by variations in hybridoma characteristics that can lead to the denaturation or inactivation of antibodies and restrict segment growth.

In vivo production type is expected to grow at a significant rate in the forecast period due to its highly cost-effective production as compared to in vitro techniques and its ability to produce a high concentration of mAbs. These mAbs are used in the diagnostic industry, wherein cost considerations are of prime importance, and optimization of in vivo procedures can be done to increase the secretion of mAbs.

Which End User Shows Higher Implementation in Monoclonal Antibodies Market?

Demand for Monoclonal Antibodies in Hospitals to Gain Traction

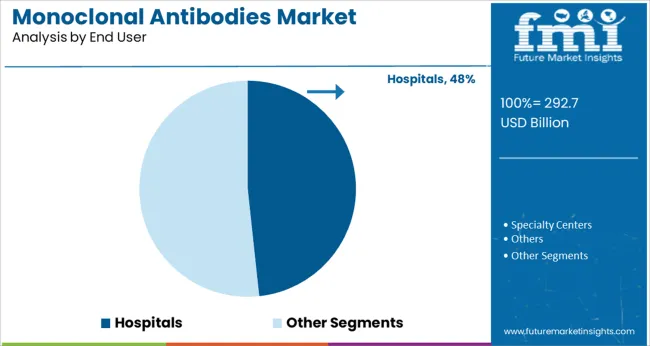
The hospital end-use segment held the largest market share of 40.8% in 2021 due to the increasing adoption of mAbs for cancer treatment at hospitals. Rising healthcare expenditure across the world, increasing patient awareness levels, and availability of advanced hospital infrastructure in developed countries are factors expected to result in the dominance of the segment during the forecast period.

Specialty centers accounted for a significant market share in 2021 due to the increasing government support in recent years. For instance, the National Cancer Institute’s Cancer Centers Program is establishing standards for transdisciplinary cancer centers focused on the prevention, diagnosis, and treatment of various types of cancers. Such initiatives are expected to positively affect segment growth.

Which Application of Monoclonal Antibodies is Expected to Drive the Market?

Oncology Segment to account for Dominant Application of Monoclonal Antibodies

The oncology segment dominated the applications market for mAbs and accounted for 50.1% of the market value in 2021. This can be attributed to the high number of regulatory approvals for mAbs aimed at cancer treatment. The surge in the incidence of cancer is a key factor anticipated to drive the growth of mAbs therapeutics as these can have minimal adverse effects as compared to other drugs and chemotherapy interventions. Currently, available mAb therapeutics include those targeted against non-small cell lung, brain tumor, ovarian, breast, gastric, melanoma, colorectal, Hodgkin’s lymphoma, and others.

Applications of mAbs for the treatment of autoimmune diseases are projected to grow at a lucrative rate due to the increasing prevalence of autoimmune conditions such as rheumatoid arthritis. Furthermore, with growth in the number of cytokine proteins identified in inflammatory pathways that can be targeted for disease mitigation, applications of mAbs in this domain are anticipated to witness growth.

The Start-Up Ecosystem: How Key Players are Opening Frontiers for Future Growth?

Some of the start-ups in the monoclonal antibodies market include-

  • The US-based start-up Aridis Pharmaceuticals develops monoclonal antibody discovery platforms for tackling antibiotic-resistant infections. These platforms find and recover B-cells from individuals who have survived antibiotic-resistant infections. Their development pipeline includes drugs targeting staphylococcus aureus, pseudomonas aeruginosa, as well as Acinetobacter baumannii infections.
  • French start-up Igyxos is developing a monoclonal antibody-based treatment for female and male infertility. The startup designs the antibody to potentiate the bioactivity of endogenous and exogenous gonadotropins. In addition, the solution induces ovulation in women and regulates spermatogenesis in men by bio-activating gonadotrophins.
  • The US-based start-up Yurogen Biosystems is developing humanized mAbs. The startup’s single-cell-based monoclonal antibody (SMab) platform produces mAbs from different host species such as rabbits, monkeys, and humans. The startup offers antibody humanization services for many different kinds of mAbs.

Market Competition

Key players in the Monoclonal Antibodies market are Novartis AG; Pfizer Inc; GlaxoSmithKline plc; Amgen Inc.; Merck & Co., Inc.; Daiichi Sankyo Company, Limited; Abbott Laboratories; AstraZeneca plc; Eli Lilly And Company; Johnson & Johnson Services, Inc. and many more.

  • In November 2021, Bristol-Myers Squibb Company received the US Food and Drug Administration approval for Opdivo (nivolumab) plus Yervoy (ipilimumab) combined with limited chemotherapy as first-line treatment of metastatic or recurrent non-small cell lung cancer. Patients with squamous or non-squamous illness, independent of PD-L1 expression, are eligible for the treatment. 1 The FDA's Real-Time Oncology Examine (RTOR) pilot program was used to review this application, which aims to ensure that safe and effective medicines are offered to patients as soon as feasible.
  • In March 2022, Sanofi S.A. and Blackstone Life Sciences entered a collaboration for accelerating the development of a subcutaneous formulation of Sarclisa mAb for the treatment of patients with multiple myeloma.

Report Scope

Report Attribute

Details

Market Value in 2022

US$ 208.32 Billion

Market Value in 2032

US$ 647.01 Billion

Growth Rate

CAGR of 12% from 2022 to 2032

Base Year for Estimation

2021

Historical Data

2017 to 2021

Forecast Period

2022 to 2032

Quantitative Units

Revenue in US$ Billion and CAGR from 2022 to 2032

Report Coverage

Revenue Forecast, Volume Forecast, Company Ranking, Competitive Landscape, Growth Factors, Trends, and Pricing Analysis

Segments Covered

  • Production Type
  • Source Type
  • End-User
  • Application
  • Region

Regions Covered

  • North America
  • Latin America
  • Europe
  • Asia Pacific
  • Middle East & Africa (MEA)

Key Countries Profiled

  • The US
  • Canada
  • Brazil
  • Argentina
  • Germany
  • The UK
  • France
  • Spain
  • Italy
  • Australia
  • New Zealand
  • China
  • Japan
  • South Korea
  • Singapore
  • Thailand
  • Indonesia
  • GCC
  • South Africa
  • Israel

Key Companies Profiled

  • Novartis AG
  • Pfizer Inc.
  • GlaxoSmithKline Plc.
  • Amgen Inc.
  • Merck & Co. Inc.
  • Daiichi Sankyo Company Limited
  • Abbott Laboratories
  • AstraZeneca Plc.
  • Eli Lilly & Company
  • Johnson & Johnson Services Inc.
  • Bayer AG
  • Bristol Myers Squibb
  • F. Hoffman-La Roche Ltd.
  • Viatris Inc.
  • Biogen Inc.
  • Thermo Fisher Scientific Inc.
  • Novo Nordisk A/S
  • Sanofi S.A.

Customization

Available Upon Request

Key Segments Profiled in the Monoclonal Antibodies Market Industry Survey

Monoclonal Antibodies Market by Production Type:

  • In Vivo
  • In Vitro

Monoclonal Antibodies Market by Source Type:

  • Murine
  • Chimeric
  • Humanized
  • Human

Monoclonal Antibodies Market by End User:

  • Hospitals
  • Specialty Centers
  • Others

Monoclonal Antibodies Market by Application:

  • Oncology
  • Autoimmune Diseases
  • Infectious Diseases
  • Neurological Diseases
  • Others

Monoclonal Antibodies Market by Region:

  • North America
  • Europe
  • Asia Pacific
  • Latin America
  • Middle East and Africa (MEA)

Frequently Asked Questions

FMI projects the global Monoclonal Antibodies market to expand at a 12% value CAGR by 2032.

The global Monoclonal Antibodies market is estimated at a market value of US$ 208.32 Billion.

The global Monoclonal Antibodies market is expected to garner a market value of US$ 647.01 Billion.

FMI has projected North America to be one of the key regions for the Monoclonal Antibodies market, with the US expected to account for over 46.2% of the North American market during the forecast period.

Novartis AG; Pfizer Inc; GlaxoSmithKline plc; Amgen Inc.; Merck & Co., Inc. are some prominent Monoclonal Antibodies manufacturers.

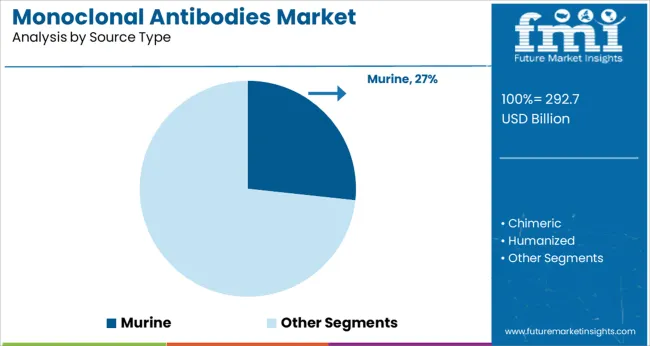
The human source type held the largest share and accounted for 54.07% of the market value in 2021.

Table of Content

1. Executive Summary | Monoclonal Antibodies Market

    1.1. Global Market Outlook

    1.2. Demand-side Trends

    1.3. Supply-side Trends

    1.4. Technology Roadmap Analysis

    1.5. Analysis and Recommendations

2. Market Overview

    2.1. Market Coverage / Taxonomy

    2.2. Market Definition / Scope / Limitations

3. Market Background

    3.1. Market Dynamics

        3.1.1. Drivers

        3.1.2. Restraints

        3.1.3. Opportunity

        3.1.4. Trends

    3.2. Scenario Forecast

        3.2.1. Demand in Optimistic Scenario

        3.2.2. Demand in Likely Scenario

        3.2.3. Demand in Conservative Scenario

    3.3. Opportunity Map Analysis

    3.4. Investment Feasibility Matrix

    3.5. PESTLE and Porter’s Analysis

    3.6. Regulatory Landscape

        3.6.1. By Key Regions

        3.6.2. By Key Countries

    3.7. Regional Parent Market Outlook

4. Global Monoclonal Antibodies Market Analysis 2017 to 2021 and Forecast, 2022 to 2032

    4.1. Historical Market Size Value (US$ Million) Analysis, 2017 to 2021

    4.2. Current and Future Market Size Value (US$ Million) Projections, 2022 to 2032

        4.2.1. Y-o-Y Growth Trend Analysis

        4.2.2. Absolute $ Opportunity Analysis

5. Global Monoclonal Antibodies Market Analysis 2017 to 2021 and Forecast 2022 to 2032, By Source Type

    5.1. Introduction / Key Findings

    5.2. Historical Market Size Value (US$ Million) Analysis By Source Type, 2017 to 2021

    5.3. Current and Future Market Size Value (US$ Million) Analysis and Forecast By Source Type, 2022 to 2032

        5.3.1. Murine

        5.3.2. Chimeric

        5.3.3. Humanized

        5.3.4. Human

    5.4. Y-o-Y Growth Trend Analysis By Source Type, 2017 to 2021

    5.5. Absolute $ Opportunity Analysis By Source Type, 2022 to 2032

6. Global Monoclonal Antibodies Market Analysis 2017 to 2021 and Forecast 2022 to 2032, By Production Type

    6.1. Introduction / Key Findings

    6.2. Historical Market Size Value (US$ Million) Analysis By Production Type, 2017 to 2021

    6.3. Current and Future Market Size Value (US$ Million) Analysis and Forecast By Production Type, 2022 to 2032

        6.3.1. In Vivo

        6.3.2. In Vitro

    6.4. Y-o-Y Growth Trend Analysis By Production Type, 2017 to 2021

    6.5. Absolute $ Opportunity Analysis By Production Type, 2022 to 2032

7. Global Monoclonal Antibodies Market Analysis 2017 to 2021 and Forecast 2022 to 2032, By Application

    7.1. Introduction / Key Findings

    7.2. Historical Market Size Value (US$ Million) Analysis By Application, 2017 to 2021

    7.3. Current and Future Market Size Value (US$ Million) Analysis and Forecast By Application, 2022 to 2032

        7.3.1. Oncology

        7.3.2. Autoimmune Diseases

        7.3.3. Infectious Diseases

        7.3.4. Neurological Diseases

        7.3.5. Others

    7.4. Y-o-Y Growth Trend Analysis By Application, 2017 to 2021

    7.5. Absolute $ Opportunity Analysis By Application, 2022 to 2032

8. Global Monoclonal Antibodies Market Analysis 2017 to 2021 and Forecast 2022 to 2032, By End-use

    8.1. Introduction / Key Findings

    8.2. Historical Market Size Value (US$ Million) Analysis By End-use, 2017 to 2021

    8.3. Current and Future Market Size Value (US$ Million) Analysis and Forecast By End-use, 2022 to 2032

        8.3.1. Hospitals

        8.3.2. Specialty Centers

        8.3.3. Others

    8.4. Y-o-Y Growth Trend Analysis By End-use, 2017 to 2021

    8.5. Absolute $ Opportunity Analysis By End-use, 2022 to 2032

9. Global Monoclonal Antibodies Market Analysis 2017 to 2021 and Forecast 2022 to 2032, By Region

    9.1. Introduction

    9.2. Historical Market Size Value (US$ Million) Analysis By Region, 2017 to 2021

    9.3. Current Market Size Value (US$ Million) Analysis and Forecast By Region, 2022 to 2032

        9.3.1. North America

        9.3.2. Latin America

        9.3.3. Europe

        9.3.4. Asia Pacific

        9.3.5. Middle East & Africa (MEA)

    9.4. Market Attractiveness Analysis By Region

10. North America Monoclonal Antibodies Market Analysis 2017 to 2021 and Forecast 2022 to 2032, By Country

    10.1. Historical Market Size Value (US$ Million) Trend Analysis By Market Taxonomy, 2017 to 2021

    10.2. Market Size Value (US$ Million) Forecast By Market Taxonomy, 2022 to 2032

        10.2.1. By Country

            10.2.1.1. The US.

            10.2.1.2. Canada

        10.2.2. By Source Type

        10.2.3. By Production Type

        10.2.4. By Application

        10.2.5. By End-use

    10.3. Market Attractiveness Analysis

        10.3.1. By Country

        10.3.2. By Source Type

        10.3.3. By Production Type

        10.3.4. By Application

        10.3.5. By End-use

    10.4. Key Takeaways

11. Latin America Monoclonal Antibodies Market Analysis 2017 to 2021 and Forecast 2022 to 2032, By Country

    11.1. Historical Market Size Value (US$ Million) Trend Analysis By Market Taxonomy, 2017 to 2021

    11.2. Market Size Value (US$ Million) Forecast By Market Taxonomy, 2022 to 2032

        11.2.1. By Country

            11.2.1.1. Brazil

            11.2.1.2. Mexico

            11.2.1.3. Rest of Latin America

        11.2.2. By Source Type

        11.2.3. By Production Type

        11.2.4. By Application

        11.2.5. By End-use

    11.3. Market Attractiveness Analysis

        11.3.1. By Country

        11.3.2. By Source Type

        11.3.3. By Production Type

        11.3.4. By Application

        11.3.5. By End-use

    11.4. Key Takeaways

12. Europe Monoclonal Antibodies Market Analysis 2017 to 2021 and Forecast 2022 to 2032, By Country

    12.1. Historical Market Size Value (US$ Million) Trend Analysis By Market Taxonomy, 2017 to 2021

    12.2. Market Size Value (US$ Million) Forecast By Market Taxonomy, 2022 to 2032

        12.2.1. By Country

            12.2.1.1. Germany

            12.2.1.2. The UK

            12.2.1.3. France

            12.2.1.4. Spain

            12.2.1.5. Italy

            12.2.1.6. Rest of Europe

        12.2.2. By Source Type

        12.2.3. By Production Type

        12.2.4. By Application

        12.2.5. By End-use

    12.3. Market Attractiveness Analysis

        12.3.1. By Country

        12.3.2. By Source Type

        12.3.3. By Production Type

        12.3.4. By Application

        12.3.5. By End-use

    12.4. Key Takeaways

13. Asia Pacific Monoclonal Antibodies Market Analysis 2017 to 2021 and Forecast 2022 to 2032, By Country

    13.1. Historical Market Size Value (US$ Million) Trend Analysis By Market Taxonomy, 2017 to 2021

    13.2. Market Size Value (US$ Million) Forecast By Market Taxonomy, 2022 to 2032

        13.2.1. By Country

            13.2.1.1. China

            13.2.1.2. Japan

            13.2.1.3. South Korea

            13.2.1.4. Singapore

            13.2.1.5. Thailand

            13.2.1.6. Indonesia

            13.2.1.7. Australia

            13.2.1.8. New Zealand

            13.2.1.9. Rest of Asia Pacific

        13.2.2. By Source Type

        13.2.3. By Production Type

        13.2.4. By Application

        13.2.5. By End-use

    13.3. Market Attractiveness Analysis

        13.3.1. By Country

        13.3.2. By Source Type

        13.3.3. By Production Type

        13.3.4. By Application

        13.3.5. By End-use

    13.4. Key Takeaways

14. MEA Monoclonal Antibodies Market Analysis 2017 to 2021 and Forecast 2022 to 2032, By Country

    14.1. Historical Market Size Value (US$ Million) Trend Analysis By Market Taxonomy, 2017 to 2021

    14.2. Market Size Value (US$ Million) Forecast By Market Taxonomy, 2022 to 2032

        14.2.1. By Country

            14.2.1.1. GCC Countries

            14.2.1.2. South Africa

            14.2.1.3. Israel

            14.2.1.4. Rest of MEA

        14.2.2. By Source Type

        14.2.3. By Production Type

        14.2.4. By Application

        14.2.5. By End-use

    14.3. Market Attractiveness Analysis

        14.3.1. By Country

        14.3.2. By Source Type

        14.3.3. By Production Type

        14.3.4. By Application

        14.3.5. By End-use

    14.4. Key Takeaways

15. Key Countries Monoclonal Antibodies Market Analysis

    15.1. U.S.

        15.1.1. Pricing Analysis

        15.1.2. Market Share Analysis, 2021

            15.1.2.1. By Source Type

            15.1.2.2. By Production Type

            15.1.2.3. By Application

            15.1.2.4. By End-use

    15.2. Canada

        15.2.1. Pricing Analysis

        15.2.2. Market Share Analysis, 2021

            15.2.2.1. By Source Type

            15.2.2.2. By Production Type

            15.2.2.3. By Application

            15.2.2.4. By End-use

    15.3. Brazil

        15.3.1. Pricing Analysis

        15.3.2. Market Share Analysis, 2021

            15.3.2.1. By Source Type

            15.3.2.2. By Production Type

            15.3.2.3. By Application

            15.3.2.4. By End-use

    15.4. Mexico

        15.4.1. Pricing Analysis

        15.4.2. Market Share Analysis, 2021

            15.4.2.1. By Source Type

            15.4.2.2. By Production Type

            15.4.2.3. By Application

            15.4.2.4. By End-use

    15.5. Germany

        15.5.1. Pricing Analysis

        15.5.2. Market Share Analysis, 2021

            15.5.2.1. By Source Type

            15.5.2.2. By Production Type

            15.5.2.3. By Application

            15.5.2.4. By End-use

    15.6. The UK

        15.6.1. Pricing Analysis

        15.6.2. Market Share Analysis, 2021

            15.6.2.1. By Source Type

            15.6.2.2. By Production Type

            15.6.2.3. By Application

            15.6.2.4. By End-use

    15.7. France

        15.7.1. Pricing Analysis

        15.7.2. Market Share Analysis, 2021

            15.7.2.1. By Source Type

            15.7.2.2. By Production Type

            15.7.2.3. By Application

            15.7.2.4. By End-use

    15.8. Spain

        15.8.1. Pricing Analysis

        15.8.2. Market Share Analysis, 2021

            15.8.2.1. By Source Type

            15.8.2.2. By Production Type

            15.8.2.3. By Application

            15.8.2.4. By End-use

    15.9. Italy

        15.9.1. Pricing Analysis

        15.9.2. Market Share Analysis, 2021

            15.9.2.1. By Source Type

            15.9.2.2. By Production Type

            15.9.2.3. By Application

            15.9.2.4. By End-use

    15.10. China

        15.10.1. Pricing Analysis

        15.10.2. Market Share Analysis, 2021

            15.10.2.1. By Source Type

            15.10.2.2. By Production Type

            15.10.2.3. By Application

            15.10.2.4. By End-use

    15.11. Japan

        15.11.1. Pricing Analysis

        15.11.2. Market Share Analysis, 2021

            15.11.2.1. By Source Type

            15.11.2.2. By Production Type

            15.11.2.3. By Application

            15.11.2.4. By End-use

    15.12. South Korea

        15.12.1. Pricing Analysis

        15.12.2. Market Share Analysis, 2021

            15.12.2.1. By Source Type

            15.12.2.2. By Production Type

            15.12.2.3. By Application

            15.12.2.4. By End-use

    15.13. Singapore

        15.13.1. Pricing Analysis

        15.13.2. Market Share Analysis, 2021

            15.13.2.1. By Source Type

            15.13.2.2. By Production Type

            15.13.2.3. By Application

            15.13.2.4. By End-use

    15.14. Thailand

        15.14.1. Pricing Analysis

        15.14.2. Market Share Analysis, 2021

            15.14.2.1. By Source Type

            15.14.2.2. By Production Type

            15.14.2.3. By Application

            15.14.2.4. By End-use

    15.15. Indonesia

        15.15.1. Pricing Analysis

        15.15.2. Market Share Analysis, 2021

            15.15.2.1. By Source Type

            15.15.2.2. By Production Type

            15.15.2.3. By Application

            15.15.2.4. By End-use

    15.16. Australia

        15.16.1. Pricing Analysis

        15.16.2. Market Share Analysis, 2021

            15.16.2.1. By Source Type

            15.16.2.2. By Production Type

            15.16.2.3. By Application

            15.16.2.4. By End-use

    15.17. New Zealand

        15.17.1. Pricing Analysis

        15.17.2. Market Share Analysis, 2021

            15.17.2.1. By Source Type

            15.17.2.2. By Production Type

            15.17.2.3. By Application

            15.17.2.4. By End-use

    15.18. GCC Countries

        15.18.1. Pricing Analysis

        15.18.2. Market Share Analysis, 2021

            15.18.2.1. By Source Type

            15.18.2.2. By Production Type

            15.18.2.3. By Application

            15.18.2.4. By End-use

    15.19. South Africa

        15.19.1. Pricing Analysis

        15.19.2. Market Share Analysis, 2021

            15.19.2.1. By Source Type

            15.19.2.2. By Production Type

            15.19.2.3. By Application

            15.19.2.4. By End-use

    15.20. Israel

        15.20.1. Pricing Analysis

        15.20.2. Market Share Analysis, 2021

            15.20.2.1. By Source Type

            15.20.2.2. By Production Type

            15.20.2.3. By Application

            15.20.2.4. By End-use

16. Market Structure Analysis

    16.1. Competition Dashboard

    16.2. Competition Benchmarking

    16.3. Market Share Analysis of Top Players

        16.3.1. By Regional

        16.3.2. By Source Type

        16.3.3. By Production Type

        16.3.4. By Application

        16.3.5. By End-use

17. Competition Analysis

    17.1. Competition Deep Dive

        17.1.1. Novartis AG

            17.1.1.1. Overview

            17.1.1.2. Product Portfolio

            17.1.1.3. Profitability by Market Segments

            17.1.1.4. Sales Footprint

            17.1.1.5. Strategy Overview

                17.1.1.5.1. Marketing Strategy

        17.1.2. Pfizer Inc.

            17.1.2.1. Overview

            17.1.2.2. Product Portfolio

            17.1.2.3. Profitability by Market Segments

            17.1.2.4. Sales Footprint

            17.1.2.5. Strategy Overview

                17.1.2.5.1. Marketing Strategy

        17.1.3. GlaxoSmithKline plc

            17.1.3.1. Overview

            17.1.3.2. Product Portfolio

            17.1.3.3. Profitability by Market Segments

            17.1.3.4. Sales Footprint

            17.1.3.5. Strategy Overview

                17.1.3.5.1. Marketing Strategy

        17.1.4. Amgen Inc.

            17.1.4.1. Overview

            17.1.4.2. Product Portfolio

            17.1.4.3. Profitability by Market Segments

            17.1.4.4. Sales Footprint

            17.1.4.5. Strategy Overview

                17.1.4.5.1. Marketing Strategy

        17.1.5. Merck & Co., Inc.

            17.1.5.1. Overview

            17.1.5.2. Product Portfolio

            17.1.5.3. Profitability by Market Segments

            17.1.5.4. Sales Footprint

            17.1.5.5. Strategy Overview

                17.1.5.5.1. Marketing Strategy

        17.1.6. Daiichi Sankyo Company, Limited

            17.1.6.1. Overview

            17.1.6.2. Product Portfolio

            17.1.6.3. Profitability by Market Segments

            17.1.6.4. Sales Footprint

            17.1.6.5. Strategy Overview

                17.1.6.5.1. Marketing Strategy

        17.1.7. Abbott Laboratories

            17.1.7.1. Overview

            17.1.7.2. Product Portfolio

            17.1.7.3. Profitability by Market Segments

            17.1.7.4. Sales Footprint

            17.1.7.5. Strategy Overview

                17.1.7.5.1. Marketing Strategy

        17.1.8. AstraZeneca plc

            17.1.8.1. Overview

            17.1.8.2. Product Portfolio

            17.1.8.3. Profitability by Market Segments

            17.1.8.4. Sales Footprint

            17.1.8.5. Strategy Overview

                17.1.8.5.1. Marketing Strategy

        17.1.9. Eli Lilly And Company

            17.1.9.1. Overview

            17.1.9.2. Product Portfolio

            17.1.9.3. Profitability by Market Segments

            17.1.9.4. Sales Footprint

            17.1.9.5. Strategy Overview

                17.1.9.5.1. Marketing Strategy

        17.1.10. Johnson & Johnson Services, Inc.

            17.1.10.1. Overview

            17.1.10.2. Product Portfolio

            17.1.10.3. Profitability by Market Segments

            17.1.10.4. Sales Footprint

            17.1.10.5. Strategy Overview

                17.1.10.5.1. Marketing Strategy

        17.1.11. Bayer AG

            17.1.11.1. Overview

            17.1.11.2. Product Portfolio

            17.1.11.3. Profitability by Market Segments

            17.1.11.4. Sales Footprint

            17.1.11.5. Strategy Overview

                17.1.11.5.1. Marketing Strategy

        17.1.12. Bristol Myers Squibb

            17.1.12.1. Overview

            17.1.12.2. Product Portfolio

            17.1.12.3. Profitability by Market Segments

            17.1.12.4. Sales Footprint

            17.1.12.5. Strategy Overview

                17.1.12.5.1. Marketing Strategy

        17.1.13. F. Hoffman-La Roche Ltd.

            17.1.13.1. Overview

            17.1.13.2. Product Portfolio

            17.1.13.3. Profitability by Market Segments

            17.1.13.4. Sales Footprint

            17.1.13.5. Strategy Overview

                17.1.13.5.1. Marketing Strategy

        17.1.14. Viatris Inc.

            17.1.14.1. Overview

            17.1.14.2. Product Portfolio

            17.1.14.3. Profitability by Market Segments

            17.1.14.4. Sales Footprint

            17.1.14.5. Strategy Overview

                17.1.14.5.1. Marketing Strategy

        17.1.15. Biogen Inc.

            17.1.15.1. Overview

            17.1.15.2. Product Portfolio

            17.1.15.3. Profitability by Market Segments

            17.1.15.4. Sales Footprint

            17.1.15.5. Strategy Overview

                17.1.15.5.1. Marketing Strategy

        17.1.16. Thermo Fisher Scientific, Inc.

            17.1.16.1. Overview

            17.1.16.2. Product Portfolio

            17.1.16.3. Profitability by Market Segments

            17.1.16.4. Sales Footprint

            17.1.16.5. Strategy Overview

                17.1.16.5.1. Marketing Strategy

        17.1.17. Novo Nordisk A/S

            17.1.17.1. Overview

            17.1.17.2. Product Portfolio

            17.1.17.3. Profitability by Market Segments

            17.1.17.4. Sales Footprint

            17.1.17.5. Strategy Overview

                17.1.17.5.1. Marketing Strategy

        17.1.18. Sanofi S.A.

            17.1.18.1. Overview

            17.1.18.2. Product Portfolio

            17.1.18.3. Profitability by Market Segments

            17.1.18.4. Sales Footprint

            17.1.18.5. Strategy Overview

                17.1.18.5.1. Marketing Strategy

18. Assumptions & Acronyms Used

19. Research Methodology
Customize this Report

Let us know your requirement to get
100% FREE customization

List of Tables

Table 1: Global Monoclonal Antibodies Market Value (US$ Million) Forecast by Region, 2017 to 2032

Table 2: Global Monoclonal Antibodies Market Value (US$ Million) Forecast by Source Type, 2017 to 2032

Table 3: Global Monoclonal Antibodies Market Value (US$ Million) Forecast by Production Type, 2017 to 2032

Table 4: Global Monoclonal Antibodies Market Value (US$ Million) Forecast by Application , 2017 to 2032

Table 5: Global Monoclonal Antibodies Market Value (US$ Million) Forecast by End-use, 2017 to 2032

Table 6: North America Monoclonal Antibodies Market Value (US$ Million) Forecast by Country, 2017 to 2032

Table 7: North America Monoclonal Antibodies Market Value (US$ Million) Forecast by Source Type, 2017 to 2032

Table 8: North America Monoclonal Antibodies Market Value (US$ Million) Forecast by Production Type, 2017 to 2032

Table 9: North America Monoclonal Antibodies Market Value (US$ Million) Forecast by Application , 2017 to 2032

Table 10: North America Monoclonal Antibodies Market Value (US$ Million) Forecast by End-use, 2017 to 2032

Table 11: Latin America Monoclonal Antibodies Market Value (US$ Million) Forecast by Country, 2017 to 2032

Table 12: Latin America Monoclonal Antibodies Market Value (US$ Million) Forecast by Source Type, 2017 to 2032

Table 13: Latin America Monoclonal Antibodies Market Value (US$ Million) Forecast by Production Type, 2017 to 2032

Table 14: Latin America Monoclonal Antibodies Market Value (US$ Million) Forecast by Application , 2017 to 2032

Table 15: Latin America Monoclonal Antibodies Market Value (US$ Million) Forecast by End-use, 2017 to 2032

Table 16: Europe Monoclonal Antibodies Market Value (US$ Million) Forecast by Country, 2017 to 2032

Table 17: Europe Monoclonal Antibodies Market Value (US$ Million) Forecast by Source Type, 2017 to 2032

Table 18: Europe Monoclonal Antibodies Market Value (US$ Million) Forecast by Production Type, 2017 to 2032

Table 19: Europe Monoclonal Antibodies Market Value (US$ Million) Forecast by Application , 2017 to 2032

Table 20: Europe Monoclonal Antibodies Market Value (US$ Million) Forecast by End-use, 2017 to 2032

Table 21: Asia Pacific Monoclonal Antibodies Market Value (US$ Million) Forecast by Country, 2017 to 2032

Table 22: Asia Pacific Monoclonal Antibodies Market Value (US$ Million) Forecast by Source Type, 2017 to 2032

Table 23: Asia Pacific Monoclonal Antibodies Market Value (US$ Million) Forecast by Production Type, 2017 to 2032

Table 24: Asia Pacific Monoclonal Antibodies Market Value (US$ Million) Forecast by Application , 2017 to 2032

Table 25: Asia Pacific Monoclonal Antibodies Market Value (US$ Million) Forecast by End-use, 2017 to 2032

Table 26: MEA Monoclonal Antibodies Market Value (US$ Million) Forecast by Country, 2017 to 2032

Table 27: MEA Monoclonal Antibodies Market Value (US$ Million) Forecast by Source Type, 2017 to 2032

Table 28: MEA Monoclonal Antibodies Market Value (US$ Million) Forecast by Production Type, 2017 to 2032

Table 29: MEA Monoclonal Antibodies Market Value (US$ Million) Forecast by Application , 2017 to 2032

Table 30: MEA Monoclonal Antibodies Market Value (US$ Million) Forecast by End-use, 2017 to 2032
Sabyasachi Ghosh
Principal Consultant
LinkedIn
Talk to Analyst

Find your sweet spots for generating winning opportunities in this market.

Talk to Analyst

List of Charts

Figure 1: Global Monoclonal Antibodies Market Value (US$ Million) by Source Type, 2022 to 2032

Figure 2: Global Monoclonal Antibodies Market Value (US$ Million) by Production Type, 2022 to 2032

Figure 3: Global Monoclonal Antibodies Market Value (US$ Million) by Application, 2022 to 2032

Figure 4: Global Monoclonal Antibodies Market Value (US$ Million) by End-use, 2022 to 2032

Figure 5: Global Monoclonal Antibodies Market Value (US$ Million) by Region, 2022 to 2032

Figure 6: Global Monoclonal Antibodies Market Value (US$ Million) Analysis by Region, 2017 to 2032

Figure 7: Global Monoclonal Antibodies Market Value Share (%) and BPS Analysis by Region, 2022 to 2032

Figure 8: Global Monoclonal Antibodies Market Y-o-Y Growth (%) Projections by Region, 2022 to 2032

Figure 9: Global Monoclonal Antibodies Market Value (US$ Million) Analysis by Source Type, 2017 to 2032

Figure 10: Global Monoclonal Antibodies Market Value Share (%) and BPS Analysis by Source Type, 2022 to 2032

Figure 11: Global Monoclonal Antibodies Market Y-o-Y Growth (%) Projections by Source Type, 2022 to 2032

Figure 12: Global Monoclonal Antibodies Market Value (US$ Million) Analysis by Production Type, 2017 to 2032

Figure 13: Global Monoclonal Antibodies Market Value Share (%) and BPS Analysis by Production Type, 2022 to 2032

Figure 14: Global Monoclonal Antibodies Market Y-o-Y Growth (%) Projections by Production Type, 2022 to 2032

Figure 15: Global Monoclonal Antibodies Market Value (US$ Million) Analysis by Application, 2017 to 2032

Figure 16: Global Monoclonal Antibodies Market Value Share (%) and BPS Analysis by Application , 2022 to 2032

Figure 17: Global Monoclonal Antibodies Market Y-o-Y Growth (%) Projections by Application, 2022 to 2032

Figure 18: Global Monoclonal Antibodies Market Value (US$ Million) Analysis by End-use, 2017 to 2032

Figure 19: Global Monoclonal Antibodies Market Value Share (%) and BPS Analysis by End-use, 2022 to 2032

Figure 20: Global Monoclonal Antibodies Market Y-o-Y Growth (%) Projections by End-use, 2022 to 2032

Figure 21: Global Monoclonal Antibodies Market Attractiveness by Source Type, 2022 to 2032

Figure 22: Global Monoclonal Antibodies Market Attractiveness by Production Type, 2022 to 2032

Figure 23: Global Monoclonal Antibodies Market Attractiveness by Application, 2022 to 2032

Figure 24: Global Monoclonal Antibodies Market Attractiveness by End-use, 2022 to 2032

Figure 25: Global Monoclonal Antibodies Market Attractiveness by Region, 2022 to 2032

Figure 26: North America Monoclonal Antibodies Market Value (US$ Million) by Source Type, 2022 to 2032

Figure 27: North America Monoclonal Antibodies Market Value (US$ Million) by Production Type, 2022 to 2032

Figure 28: North America Monoclonal Antibodies Market Value (US$ Million) by Application, 2022 to 2032

Figure 29: North America Monoclonal Antibodies Market Value (US$ Million) by End-use, 2022 to 2032

Figure 30: North America Monoclonal Antibodies Market Value (US$ Million) by Country, 2022 to 2032

Figure 31: North America Monoclonal Antibodies Market Value (US$ Million) Analysis by Country, 2017 to 2032

Figure 32: North America Monoclonal Antibodies Market Value Share (%) and BPS Analysis by Country, 2022 to 2032

Figure 33: North America Monoclonal Antibodies Market Y-o-Y Growth (%) Projections by Country, 2022 to 2032

Figure 34: North America Monoclonal Antibodies Market Value (US$ Million) Analysis by Source Type, 2017 to 2032

Figure 35: North America Monoclonal Antibodies Market Value Share (%) and BPS Analysis by Source Type, 2022 to 2032

Figure 36: North America Monoclonal Antibodies Market Y-o-Y Growth (%) Projections by Source Type, 2022 to 2032

Figure 37: North America Monoclonal Antibodies Market Value (US$ Million) Analysis by Production Type, 2017 to 2032

Figure 38: North America Monoclonal Antibodies Market Value Share (%) and BPS Analysis by Production Type, 2022 to 2032

Figure 39: North America Monoclonal Antibodies Market Y-o-Y Growth (%) Projections by Production Type, 2022 to 2032

Figure 40: North America Monoclonal Antibodies Market Value (US$ Million) Analysis by Application, 2017 to 2032

Figure 41: North America Monoclonal Antibodies Market Value Share (%) and BPS Analysis by Application, 2022 to 2032

Figure 42: North America Monoclonal Antibodies Market Y-o-Y Growth (%) Projections by Application, 2022 to 2032

Figure 43: North America Monoclonal Antibodies Market Value (US$ Million) Analysis by End-use, 2017 to 2032

Figure 44: North America Monoclonal Antibodies Market Value Share (%) and BPS Analysis by End-use, 2022 to 2032

Figure 45: North America Monoclonal Antibodies Market Y-o-Y Growth (%) Projections by End-use, 2022 to 2032

Figure 46: North America Monoclonal Antibodies Market Attractiveness by Source Type, 2022 to 2032

Figure 47: North America Monoclonal Antibodies Market Attractiveness by Production Type, 2022 to 2032

Figure 48: North America Monoclonal Antibodies Market Attractiveness by Application, 2022 to 2032

Figure 49: North America Monoclonal Antibodies Market Attractiveness by End-use, 2022 to 2032

Figure 50: North America Monoclonal Antibodies Market Attractiveness by Country, 2022 to 2032

Figure 51: Latin America Monoclonal Antibodies Market Value (US$ Million) by Source Type, 2022 to 2032

Figure 52: Latin America Monoclonal Antibodies Market Value (US$ Million) by Production Type, 2022 to 2032

Figure 53: Latin America Monoclonal Antibodies Market Value (US$ Million) by Application, 2022 to 2032

Figure 54: Latin America Monoclonal Antibodies Market Value (US$ Million) by End-use, 2022 to 2032

Figure 55: Latin America Monoclonal Antibodies Market Value (US$ Million) by Country, 2022 to 2032

Figure 56: Latin America Monoclonal Antibodies Market Value (US$ Million) Analysis by Country, 2017 to 2032

Figure 57: Latin America Monoclonal Antibodies Market Value Share (%) and BPS Analysis by Country, 2022 to 2032

Figure 58: Latin America Monoclonal Antibodies Market Y-o-Y Growth (%) Projections by Country, 2022 to 2032

Figure 59: Latin America Monoclonal Antibodies Market Value (US$ Million) Analysis by Source Type, 2017 to 2032

Figure 60: Latin America Monoclonal Antibodies Market Value Share (%) and BPS Analysis by Source Type, 2022 to 2032

Figure 61: Latin America Monoclonal Antibodies Market Y-o-Y Growth (%) Projections by Source Type, 2022 to 2032

Figure 62: Latin America Monoclonal Antibodies Market Value (US$ Million) Analysis by Production Type, 2017 to 2032

Figure 63: Latin America Monoclonal Antibodies Market Value Share (%) and BPS Analysis by Production Type, 2022 to 2032

Figure 64: Latin America Monoclonal Antibodies Market Y-o-Y Growth (%) Projections by Production Type, 2022 to 2032

Figure 65: Latin America Monoclonal Antibodies Market Value (US$ Million) Analysis by Application, 2017 to 2032

Figure 66: Latin America Monoclonal Antibodies Market Value Share (%) and BPS Analysis by Application, 2022 to 2032

Figure 67: Latin America Monoclonal Antibodies Market Y-o-Y Growth (%) Projections by Application, 2022 to 2032

Figure 68: Latin America Monoclonal Antibodies Market Value (US$ Million) Analysis by End-use, 2017 to 2032

Figure 69: Latin America Monoclonal Antibodies Market Value Share (%) and BPS Analysis by End-use, 2022 to 2032

Figure 70: Latin America Monoclonal Antibodies Market Y-o-Y Growth (%) Projections by End-use, 2022 to 2032

Figure 71: Latin America Monoclonal Antibodies Market Attractiveness by Source Type, 2022 to 2032

Figure 72: Latin America Monoclonal Antibodies Market Attractiveness by Production Type, 2022 to 2032

Figure 73: Latin America Monoclonal Antibodies Market Attractiveness by Application, 2022 to 2032

Figure 74: Latin America Monoclonal Antibodies Market Attractiveness by End-use, 2022 to 2032

Figure 75: Latin America Monoclonal Antibodies Market Attractiveness by Country, 2022 to 2032

Figure 76: Europe Monoclonal Antibodies Market Value (US$ Million) by Source Type, 2022 to 2032

Figure 77: Europe Monoclonal Antibodies Market Value (US$ Million) by Production Type, 2022 to 2032

Figure 78: Europe Monoclonal Antibodies Market Value (US$ Million) by Application, 2022 to 2032

Figure 79: Europe Monoclonal Antibodies Market Value (US$ Million) by End-use, 2022 to 2032

Figure 80: Europe Monoclonal Antibodies Market Value (US$ Million) by Country, 2022 to 2032

Figure 81: Europe Monoclonal Antibodies Market Value (US$ Million) Analysis by Country, 2017 to 2032

Figure 82: Europe Monoclonal Antibodies Market Value Share (%) and BPS Analysis by Country, 2022 to 2032

Figure 83: Europe Monoclonal Antibodies Market Y-o-Y Growth (%) Projections by Country, 2022 to 2032

Figure 84: Europe Monoclonal Antibodies Market Value (US$ Million) Analysis by Source Type, 2017 to 2032

Figure 85: Europe Monoclonal Antibodies Market Value Share (%) and BPS Analysis by Source Type, 2022 to 2032

Figure 86: Europe Monoclonal Antibodies Market Y-o-Y Growth (%) Projections by Source Type, 2022 to 2032

Figure 87: Europe Monoclonal Antibodies Market Value (US$ Million) Analysis by Production Type, 2017 to 2032

Figure 88: Europe Monoclonal Antibodies Market Value Share (%) and BPS Analysis by Production Type, 2022 to 2032

Figure 89: Europe Monoclonal Antibodies Market Y-o-Y Growth (%) Projections by Production Type, 2022 to 2032

Figure 90: Europe Monoclonal Antibodies Market Value (US$ Million) Analysis by Application, 2017 to 2032

Figure 91: Europe Monoclonal Antibodies Market Value Share (%) and BPS Analysis by Application, 2022 to 2032

Figure 92: Europe Monoclonal Antibodies Market Y-o-Y Growth (%) Projections by Application, 2022 to 2032

Figure 93: Europe Monoclonal Antibodies Market Value (US$ Million) Analysis by End-use, 2017 to 2032

Figure 94: Europe Monoclonal Antibodies Market Value Share (%) and BPS Analysis by End-use, 2022 to 2032

Figure 95: Europe Monoclonal Antibodies Market Y-o-Y Growth (%) Projections by End-use, 2022 to 2032

Figure 96: Europe Monoclonal Antibodies Market Attractiveness by Source Type, 2022 to 2032

Figure 97: Europe Monoclonal Antibodies Market Attractiveness by Production Type, 2022 to 2032

Figure 98: Europe Monoclonal Antibodies Market Attractiveness by Application, 2022 to 2032

Figure 99: Europe Monoclonal Antibodies Market Attractiveness by End-use, 2022 to 2032

Figure 100: Europe Monoclonal Antibodies Market Attractiveness by Country, 2022 to 2032

Figure 101: Asia Pacific Monoclonal Antibodies Market Value (US$ Million) by Source Type, 2022 to 2032

Figure 102: Asia Pacific Monoclonal Antibodies Market Value (US$ Million) by Production Type, 2022 to 2032

Figure 103: Asia Pacific Monoclonal Antibodies Market Value (US$ Million) by Application, 2022 to 2032

Figure 104: Asia Pacific Monoclonal Antibodies Market Value (US$ Million) by End-use, 2022 to 2032

Figure 105: Asia Pacific Monoclonal Antibodies Market Value (US$ Million) by Country, 2022 to 2032

Figure 106: Asia Pacific Monoclonal Antibodies Market Value (US$ Million) Analysis by Country, 2017 to 2032

Figure 107: Asia Pacific Monoclonal Antibodies Market Value Share (%) and BPS Analysis by Country, 2022 to 2032

Figure 108: Asia Pacific Monoclonal Antibodies Market Y-o-Y Growth (%) Projections by Country, 2022 to 2032

Figure 109: Asia Pacific Monoclonal Antibodies Market Value (US$ Million) Analysis by Source Type, 2017 to 2032

Figure 110: Asia Pacific Monoclonal Antibodies Market Value Share (%) and BPS Analysis by Source Type, 2022 to 2032

Figure 111: Asia Pacific Monoclonal Antibodies Market Y-o-Y Growth (%) Projections by Source Type, 2022 to 2032

Figure 112: Asia Pacific Monoclonal Antibodies Market Value (US$ Million) Analysis by Production Type, 2017 to 2032

Figure 113: Asia Pacific Monoclonal Antibodies Market Value Share (%) and BPS Analysis by Production Type, 2022 to 2032

Figure 114: Asia Pacific Monoclonal Antibodies Market Y-o-Y Growth (%) Projections by Production Type, 2022 to 2032

Figure 115: Asia Pacific Monoclonal Antibodies Market Value (US$ Million) Analysis by Application, 2017 to 2032

Figure 116: Asia Pacific Monoclonal Antibodies Market Value Share (%) and BPS Analysis by Application, 2022 to 2032

Figure 117: Asia Pacific Monoclonal Antibodies Market Y-o-Y Growth (%) Projections by Application, 2022 to 2032

Figure 118: Asia Pacific Monoclonal Antibodies Market Value (US$ Million) Analysis by End-use, 2017 to 2032

Figure 119: Asia Pacific Monoclonal Antibodies Market Value Share (%) and BPS Analysis by End-use, 2022 to 2032

Figure 120: Asia Pacific Monoclonal Antibodies Market Y-o-Y Growth (%) Projections by End-use, 2022 to 2032

Figure 121: Asia Pacific Monoclonal Antibodies Market Attractiveness by Source Type, 2022 to 2032

Figure 122: Asia Pacific Monoclonal Antibodies Market Attractiveness by Production Type, 2022 to 2032

Figure 123: Asia Pacific Monoclonal Antibodies Market Attractiveness by Application, 2022 to 2032

Figure 124: Asia Pacific Monoclonal Antibodies Market Attractiveness by End-use, 2022 to 2032

Figure 125: Asia Pacific Monoclonal Antibodies Market Attractiveness by Country, 2022 to 2032

Figure 126: Middle East & Africa Monoclonal Antibodies Market Value (US$ Million) by Source Type, 2022 to 2032

Figure 127: Middle East & Africa Monoclonal Antibodies Market Value (US$ Million) by Production Type, 2022 to 2032

Figure 128: Middle East & Africa Monoclonal Antibodies Market Value (US$ Million) by Application, 2022 to 2032

Figure 129: Middle East & Africa Monoclonal Antibodies Market Value (US$ Million) by End-use, 2022 to 2032

Figure 130: Middle East & Africa Monoclonal Antibodies Market Value (US$ Million) by Country, 2022 to 2032

Figure 131: Middle East & Africa Monoclonal Antibodies Market Value (US$ Million) Analysis by Country, 2017 to 2032

Figure 132: Middle East & Africa Monoclonal Antibodies Market Value Share (%) and BPS Analysis by Country, 2022 to 2032

Figure 133: Middle East & Africa Monoclonal Antibodies Market Y-o-Y Growth (%) Projections by Country, 2022 to 2032

Figure 134: Middle East & Africa Monoclonal Antibodies Market Value (US$ Million) Analysis by Source Type, 2017 to 2032

Figure 135: Middle East & Africa Monoclonal Antibodies Market Value Share (%) and BPS Analysis by Source Type, 2022 to 2032

Figure 136: Middle East & Africa Monoclonal Antibodies Market Y-o-Y Growth (%) Projections by Source Type, 2022 to 2032

Figure 137: Middle East & Africa Monoclonal Antibodies Market Value (US$ Million) Analysis by Production Type, 2017 to 2032

Figure 138: Middle East & Africa Monoclonal Antibodies Market Value Share (%) and BPS Analysis by Production Type, 2022 to 2032

Figure 139: Middle East & Africa Monoclonal Antibodies Market Y-o-Y Growth (%) Projections by Production Type, 2022 to 2032

Figure 140: Middle East & Africa Monoclonal Antibodies Market Value (US$ Million) Analysis by Application, 2017 to 2032

Figure 141: Middle East & Africa Monoclonal Antibodies Market Value Share (%) and BPS Analysis by Application, 2022 to 2032

Figure 142: Middle East & Africa Monoclonal Antibodies Market Y-o-Y Growth (%) Projections by Application, 2022 to 2032

Figure 143: Middle East & Africa Monoclonal Antibodies Market Value (US$ Million) Analysis by End-use, 2017 to 2032

Figure 144: Middle East & Africa Monoclonal Antibodies Market Value Share (%) and BPS Analysis by End-use, 2022 to 2032

Figure 145: Middle East & Africa Monoclonal Antibodies Market Y-o-Y Growth (%) Projections by End-use, 2022 to 2032

Figure 146: Middle East & Africa Monoclonal Antibodies Market Attractiveness by Source Type, 2022 to 2032

Figure 147: Middle East & Africa Monoclonal Antibodies Market Attractiveness by Production Type, 2022 to 2032

Figure 148: Middle East & Africa Monoclonal Antibodies Market Attractiveness by Application, 2022 to 2032

Figure 149: Middle East & Africa Monoclonal Antibodies Market Attractiveness by End-use, 2022 to 2032

Figure 150: Middle East & Africa Monoclonal Antibodies Market Attractiveness by Country, 2022 to 2032

Need specific information?

Request Customization

Explore Healthcare Insights

View Reports

Recommendations

Healthcare

Long-Acting Monoclonal Antibodies Market

Published : October 2021

Healthcare

Research Antibodies Market

Published : May 2021

Healthcare

IVD Antibodies Market

Published : January 2019

Healthcare

Antibodies Market

Published : July 2021

Google translate

Monoclonal Antibodies Market