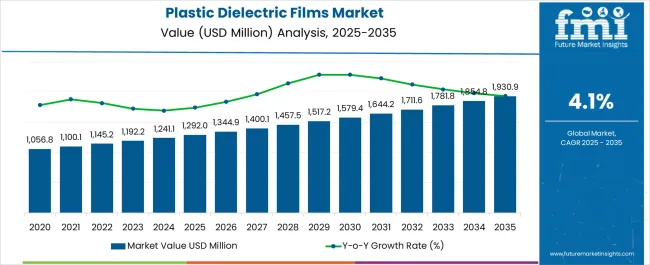
The plastic dielectric films market is estimated to be valued at USD 1292.0 million in 2025 and is projected to reach USD 1930.9 million by 2035, registering a compound annual growth rate (CAGR) of 4.1% over the forecast period.
The market demonstrates steady expansion driven by electronic component miniaturization, renewable energy infrastructure growth, and automotive electrification demands that require specialized insulating materials with precise electrical properties and thermal stability characteristics. Electronics manufacturers implement advanced dielectric films in capacitors, flexible circuits, and insulation applications where consistent dielectric constant values and low dissipation factors enable high-frequency operation and energy storage efficiency. The technology's evolution toward thinner films with enhanced breakdown voltage capabilities creates demand for materials that maintain electrical performance while enabling component size reduction and weight optimization across diverse electronic applications.
Capacitor manufacturing represents the dominant consumption segment where plastic dielectric films provide stable electrical properties and long-term reliability necessary for power electronics, motor drives, and energy storage systems requiring high capacitance density and low leakage currents. Electronic component producers specify film materials with controlled thickness tolerances and surface smoothness that enable consistent capacitor performance while accommodating automated winding and assembly processes. Quality assurance protocols emphasize dielectric strength testing, thermal aging studies, and humidity resistance evaluation that ensure reliable operation under varying environmental conditions throughout component lifecycles.
Automotive electronics applications demonstrate increasing adoption of high-temperature dielectric films for electric vehicle power systems, battery management circuits, and motor control applications where thermal stability and electrical insulation become critical safety requirements. Power electronics manufacturers utilize specialized films that maintain dielectric properties under extreme temperature cycling and voltage stress conditions typical of automotive electrical systems. Electromagnetic interference shielding applications require films with controlled conductivity characteristics that prevent signal interference while maintaining electrical isolation between circuit components.
Technology advancement trajectories concentrate on material composition optimization and processing techniques that enhance dielectric properties while enabling thinner film structures and improved thermal stability. Multi-layer film constructions provide tailored electrical characteristics through strategic layer combination and interface control that optimize performance for specific applications. Nanotechnology integration explores enhanced barrier properties and modified surface characteristics that improve electrical performance while maintaining mechanical flexibility necessary for flexible electronics applications.
Manufacturing process innovations emphasize film orientation techniques and surface treatment methods that optimize electrical properties while maintaining mechanical strength and processing characteristics necessary for downstream converting operations. Biaxial stretching processes improve molecular orientation and crystallinity that enhance dielectric strength while reducing thickness requirements. Corona treatment and chemical modification processes enable controlled surface properties that improve adhesion and printability for electronic circuit applications.

| Metric | Value |
|---|---|
| Plastic Dielectric Films Market Estimated Value in (2025E) | USD 1292.0 million |
| Plastic Dielectric Films Market Forecast Value in (2035F) | USD 1930.9 million |
| Forecast CAGR (2025 to 2035) | 4.1% |
The plastic dielectric films market is expanding steadily driven by increasing demand for energy efficient systems, rising adoption of renewable power technologies, and the growing penetration of miniaturized electronic devices. These films are widely valued for their superior electrical insulation, high thermal stability, and excellent mechanical properties, making them integral in capacitors, transformers, and other critical applications.
Regulatory initiatives emphasizing energy efficiency along with advancements in polymer processing technologies are further stimulating demand. Rapid growth in consumer electronics and automotive electronics, particularly with the rise of electric vehicles, is creating strong opportunities for plastic dielectric films across global markets.
The future outlook remains positive as manufacturers continue to focus on innovation, durability, and sustainability to cater to the evolving requirements of advanced electrical and electronic systems.
The PTEF product segment is projected to account for 54.20% of total market revenue by 2025, making it the leading product category. Its dominance is attributed to superior dielectric strength, thermal stability, and chemical resistance that make it ideal for use in critical applications.
The ability to perform reliably under extreme operating conditions has enhanced its adoption in capacitors, insulators, and high voltage components. Furthermore, advancements in processing and scalability have allowed wider application across industrial and consumer electronics.
With consistent demand for efficient and long lasting dielectric materials, PTEF continues to drive growth within the product segment.
The electrical and electronics application segment is expected to represent 47.60% of total market revenue by 2025, positioning it as the leading application category. This growth is driven by increasing demand for high performance dielectric films in circuit protection, sensors, and capacitor manufacturing.
The ability of these films to provide stable insulation and superior energy efficiency has reinforced their importance in both high power and compact electronic systems. Expansion of consumer electronics, coupled with advancements in renewable energy and electric mobility, has further accelerated usage.
With the sector’s strong focus on performance reliability and energy efficiency, electrical and electronics applications remain the cornerstone of market growth.
The electronics end use segment is forecasted to hold 58.30% of total market revenue by 2025, making it the most dominant end use category. This leadership is supported by the widespread adoption of dielectric films in semiconductors, displays, and circuit assemblies.
Miniaturization of devices and demand for high speed and high frequency components have propelled integration across consumer gadgets, computing, and communication equipment. Additionally, the rapid expansion of smart devices, IoT enabled systems, and electric mobility solutions has reinforced electronics as the primary growth engine for dielectric films.
With continuous innovation and escalating consumer demand, the electronics end use segment is set to maintain its dominance in the overall market landscape.
The sales of plastic dielectric films are anticipated to witness growth due to the growing demand for reliable and high-performance electrical components. Film capacitors are among the most used capacitors in the market, with a wide range of applications in electronic devices, telecommunications, and industrial equipment.
The use of Film Capacitors is also gaining traction in the renewable energy sector, where they are used in solar and wind power systems. Ceramic capacitors are also experiencing a surge in demand due to their excellent high-frequency characteristics, high-temperature stability, and low losses.
The demand outlook for the plastic dielectric films industry is positive, with the market expected to grow at a steady rate. The demand for film capacitors is projected to grow due to their increasing adoption in electronic devices, automotive applications, and renewable energy systems.
Ceramic capacitors are also expected to experience significant growth due to their increasing use in consumer electronics and automotive applications. In addition, the adoption of dielectric films is expected to grow, particularly in the packaging industry, where they are used to enhance the shelf life of food products.
Companies looking to enter the plastic dielectric films industry have several opportunities to explore. With the increasing demand for renewable energy sources, there is a growing need for energy-efficient components, such as film capacitors and ceramic capacitors.
The automotive industry is also a promising area for companies to enter, with the increasing adoption of hybrid and electric vehicles, which require various electrical components, including film capacitors.
Moreover, there is an increasing demand for dielectric films in the packaging industry, which can be leveraged by companies that specialize in film production. By focusing on research and development, companies can develop innovative products that cater to the growing demand for energy-efficient and reliable electrical components.
| Plastic Dielectric Films Market Size (2025) | USD 1,192.2 million |
|---|---|
| Sales Forecast (2035) | USD 1,748.98 million |
| Global Market Growth Rate (2025 to 2035) | 4.1% CAGR |
| Share of Top 5 Plastic Dielectric Film Manufacturers | 50% |
Plastic dielectric film consumption accounted for a 4.5% share of the global consumer electronics packaging market in 2024. Achieving energy efficiency is the focus of manufacturers in the electrical & electronics industry, and plastic dielectric films are widely used for insulation in these products, thereby driving the market growth. During the historical period of 2020 to 2025, the plastic dielectric films market expanded at a CAGR of 3.2%.
The market for plastic dielectric films is expected to decline by 40 basis share points (BPS) in H1-2025 (O) in comparison with H1-2024, according to an FMI analysis. However, when comparing the H1-2025 projected and H1-2025 outlook period, a decrease in BPS change by 20 BPS has been noticed.
The reason for the decline in the market is due to plastic dielectric films having no self-healing capability and being flammable under overload conditions. Despite these prospects, fluctuations in petroleum prices affect the cost of polymers used in plastic dielectric films.
| Particulars | Details |
|---|---|
| H1 2024 | 4.9% |
| H1 2025 Projected | 4.7% |
| H1 2025 Expected | 4.5% |
| BPS Change - H1, 2025 (O) - H1, 2025 (P) | (-) 20 ↓ |
| BPS Change - H1, 2025 (O) - H1, 2024 | (-) 40 ↓ |
The global plastic dielectric films industry is anticipated to rise at a 4.1% CAGR from 2025 to 2035.
Plastic dielectric films are mostly employed in capacitors, which are made up of two oppositely charged metal plates separated by an insulating element, such as a plastic film that serves as a dielectric. Capacitors are mostly employed in electronic circuit designs. Plastic dielectric films are utilized in power electronic converters and inverters on a modest scale.
Growing demand for high-tech electronic goods including touchscreen cell phones, audio pods, tablets, and laptops is driving the plastic dielectric industry. Plastic dielectric films have several benefits in the digital and electronic sectors, including small design, lightweight, high emissivity, low absorption, and refractory temperature conditions.
Demand for film capacitors worldwide is expected to witness strong growth over the coming years owing to the increasing significance of film capacitors with growing demand for consumer electronics worldwide. The plastic dielectric film market is primarily driven by the ever-increasing demand for low-cost and effective film capacitors.
Renewable Energy Systems to Create Enormous Growth Opportunities for Plastic Dielectric Films
Film capacitors are widely preferred over other capacitor types, such as electrolytic capacitors and ceramic capacitors, owing to numerous advantages such as affordability, longer shelf & service life, and high precision capacitance values.
The plastic dielectric films that are used to manufacture film capacitors are extremely thin with their thickness being under one micrometer. Typical film capacitors have capacitance values ranging from 1nF to 30microF and voltage range from 50V to as high as 2kV.
Technological developments in plastic film capacitors are expected to increase their demand in military and defense applications, high-voltage power transmission, oil & gas, and medical industries.
The use of solar energy as a renewable power generation source is increasing across the globe. This, in turn, has created lucrative growth opportunities for plastic dielectric film market players. It is witnessed that plastic dielectric films are gaining widespread popularity for use in renewable energy systems, such as solar and wind power.
There are several similarities between circuits found in solar and wind power systems. This alludes to significant demand prospects for plastic dielectric films for application in renewable energy systems shortly.
Fluctuating Prices of Raw Materials to Hinder Market Expansion
Heavy petroleum is utilized as a source of raw materials for plastic dielectric films. The price of dielectric films is affected by changes in the price of petroleum. This is a significant limitation for the plastic dielectric industry, as raw material costs have a crucial influence on the market pricing setting.
The market for plastic dielectric films is expected to be hampered by a significant reliance on non-renewable resources such as petroleum and increasing regulations on plastic consumption.
| Region | Market Value in USD million |
|---|---|
| North America | 88,101 |
| Latin America | 39,739 |
| Europe | 134,036 |
| South Asia | 59,226 |
| East Asia | 387,190 |

The plastic dielectric films industry in East Asia was valued at USD 387,190 million in 2025. East Asia is expected to lead the global plastic dielectric films industry in terms of market value, accounting for nearly 49% of the share of the global market.
The presence of many established as well as local electrical & electronics equipment manufacturers in the region is a key factor underpinning their relative lucrativeness in the plastic dielectric films industry. Overall demand for larger film capacitors is predicted to rise as the industrial significance of capacitors production expands.
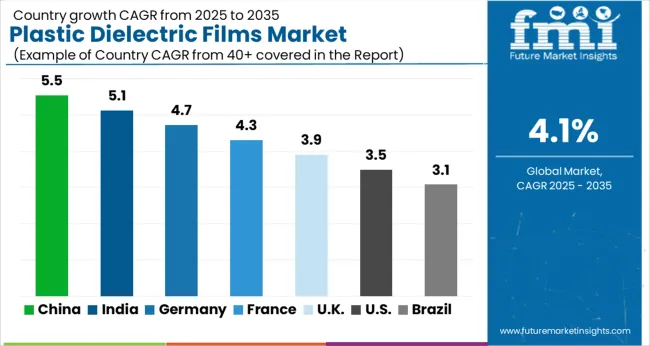
In East Asia, China dominated the plastics dielectric films industry due to the rise in energy demand because of increased industrialization and digitization. OEMs and electronic manufacturing service providers are looking to move their production sites to China on account of cost optimization, convenient raw material supply, and low labor costs.
Due to increased demand for consumer electronics as a consequence of the elevated standard of living, the market is predicted to develop at the fastest rate over the forecast period.

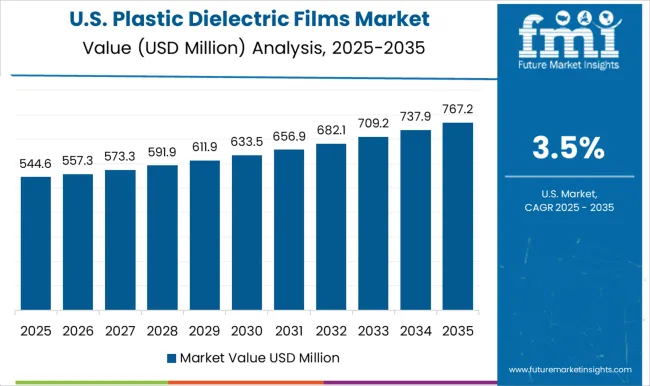
The United States plastic dielectric films market was worth USD 88,101 million in 2025. One of the factors driving the market growth in North America is the increasing demand for eco-friendly and energy-efficient products.
Plastic dielectric films are widely used in various applications, including renewable energy systems, electric vehicles, and consumer electronics, to store and release energy. The increasing awareness about environmental sustainability and energy efficiency has led to a higher demand for plastic dielectric films in North America.
The United States is likely to emerge as a significant income source for the market due to the prominent presence of the automotive industry. Rising sales of new light vehicles in the United States are fueling demand for polymeric dielectric films, which are used as insulation materials in automotive applications.

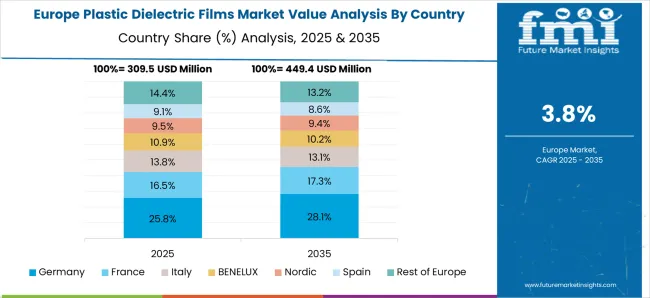
Europe's plastic dielectric films industry was worth USD 134,036 million in 2025. One of the factors driving the market growth in Europe is the increasing adoption of electric vehicles and renewable energy systems.
Plastic dielectric films are widely used in electric vehicle batteries and solar power systems to store and release energy. The European Union's ambitious renewable energy targets and regulations have resulted in a higher demand for plastic dielectric films in the region.
Latin America held a market value of USD 39,739 million in the plastic dielectric films industry in 2025. One of the factors impacting the market growth in Latin America is the political and economic instability in the region.
The uncertain political environment and economic downturns in countries like Brazil and Argentina have resulted in lower demand for plastic dielectric films in the region. However, the growing population and urbanization in Latin America are expected to drive the demand for consumer electronics, automotive, and renewable energy systems, which can create new opportunities for the plastic dielectric films industry in the future.
PET Plastic Dielectric Films to Garner Largest Revenue Share Owing to Superior Qualities
In 2025, Polypropylene (PP) held a value of USD 617.0 million in the plastic dielectric films industry based on material type.
Polyethene terephthalate (PET) plastic dielectric film is expected to lead the plastics dielectric films market owing to qualities such as good strength, high stiffness, superior chemical resistance, and damage tolerance. PET plastic film is a completely recyclable material that may be made into fibers, textiles, and sheets for use in the production of automotive components.
Furthermore, because of its outstanding electrical insulating qualities, and high structural and dimensional stability, polyethylene terephthalate is frequently employed in the electrical and electronics industries. Because of its high dielectric constant, PET has positioned itself as the industry leader, resulting in increased demand from the electronics sector to make a variety of small capacitors.
As a result, PET's qualities make it ideal for high-voltage alternating current (AC) and direct current (DC) systems. As a result of all of these causes, PET is becoming more popular as a plastic dielectric film.
Rising Demand for Insulation of Electrical and Electronics Industry Driving Market Expansion
The film application segment, particularly AC film capacitors, held a value of USD 1292 million in the plastic dielectric films industry in 2025.
The global plastic dielectric films market is likely to be dominated by the electrical and electronics industry, which is expected to increase in future years. This expansion can be credited to leading industry players that are concentrating on ongoing product innovation to obtain a significant portion of the global market.
Dielectric films made of plastic have a high level of stability, a prolonged shelf life, and a high ability to withstand power surges. Telecommunication, electrical transmission line and cable, and other advancements such as LCD, LEDs, and OLEDs all employ them.
Plastic films are commonly used to provide electrical insulation in a variety of applications, including aviation electrical design, circuit boards, capacitors, radio and microwave circuits, electrical cables, and high-voltage equipment.
In terms of end use, electrical & electronics held the highest value of USD 492.8 million in the plastic dielectric films industry in 2025.
The electrical & electronics segment also includes various industrial applications, including power distribution systems, motor drives, and lighting.
Plastic dielectric films, such as AC film capacitors, are widely used in these applications due to their excellent electrical characteristics, including high stability and low losses. The increasing adoption of these applications has led to a higher demand for Plastic dielectric films in the electrical & electronics segment.
The plastic dielectric films market is led by established materials science and chemical manufacturers supplying high-performance films used in capacitors, insulation, and electronic applications. Treofan Group holds a strong position with its advanced biaxially oriented polypropylene (BOPP) dielectric films, known for high breakdown strength, low dissipation factor, and stable dielectric properties used in power capacitors and electronic circuits. Toray Industries Inc. produces a wide range of dielectric films made from polypropylene and polyester, emphasizing dimensional stability, heat resistance, and precision coating technologies for high-voltage and electronic applications.
Bolloré Group focuses on specialty plastic dielectric films with consistent thickness control and high electrical insulation used in capacitors and flexible electronics. DuPont Teijin Films leads in biaxially oriented polyethylene terephthalate (BOPET) films offering superior mechanical strength, chemical resistance, and electrical stability under high-frequency conditions. SABIC contributes with advanced polymer materials, including dielectric films engineered from polypropylene and polycarbonate for capacitor insulation and electronic protection applications.
Kopaflim Elektrofolien GmbH specializes in metallized and non-metallized dielectric films used in energy storage and high-performance capacitor manufacturing, known for precision coating and low defect rates. Tervakoski Film provides polypropylene dielectric films for film capacitors, emphasizing purity, high voltage endurance, and long operational life in industrial and power electronics applications.
| Attribute | Details |
|---|---|
| Forecast Period | 2025 to 2035 |
| Historical Data Available for | 2020 to 2025 |
| Market Analysis | Value in USD million |
| Key Regions Covered | North America; Latin America; Europe; East Asia; South Asia & Pacific; Middle East & Africa (MEA) |
| Key Countries Covered | The USA, Canada, Mexico, Brazil, Mexico, Argentina, Germany, Italy, France, United Kingdom, Nordic, Spain, Japan, China, India, Malaysia, Thailand, Australia, GCC Countries, South Africa, Turkey |
| Key Market Segments Covered | Product, Application, End Use, Region |
| Key Companies Profiled |
Treofan Group, Toray Industries Inc., Bolloré Group, DuPont Teijin Films, SABIC, Kopaflim Elektrofolien GmbH, and Tervakoski Film. |
| Pricing | Available upon Request |
The global plastic dielectric films market is estimated to be valued at USD 1,292.0 million in 2025.
The market size for the plastic dielectric films market is projected to reach USD 1,930.9 million by 2035.
The plastic dielectric films market is expected to grow at a 4.1% CAGR between 2025 and 2035.
The key product types in plastic dielectric films market are ptef, pen, pet, pp, pps and pvdf.
In terms of application, electrical & electronics segment to command 47.6% share in the plastic dielectric films market in 2025.


Our Research Products

The "Full Research Suite" delivers actionable market intel, deep dives on markets or technologies, so clients act faster, cut risk, and unlock growth.

The Leaderboard benchmarks and ranks top vendors, classifying them as Established Leaders, Leading Challengers, or Disruptors & Challengers.

Locates where complements amplify value and substitutes erode it, forecasting net impact by horizon

We deliver granular, decision-grade intel: market sizing, 5-year forecasts, pricing, adoption, usage, revenue, and operational KPIs—plus competitor tracking, regulation, and value chains—across 60 countries broadly.

Spot the shifts before they hit your P&L. We track inflection points, adoption curves, pricing moves, and ecosystem plays to show where demand is heading, why it is changing, and what to do next across high-growth markets and disruptive tech

Real-time reads of user behavior. We track shifting priorities, perceptions of today’s and next-gen services, and provider experience, then pace how fast tech moves from trial to adoption, blending buyer, consumer, and channel inputs with social signals (#WhySwitch, #UX).

Partner with our analyst team to build a custom report designed around your business priorities. From analysing market trends to assessing competitors or crafting bespoke datasets, we tailor insights to your needs.
Supplier Intelligence
Discovery & Profiling
Capacity & Footprint
Performance & Risk
Compliance & Governance
Commercial Readiness
Who Supplies Whom
Scorecards & Shortlists
Playbooks & Docs
Category Intelligence
Definition & Scope
Demand & Use Cases
Cost Drivers
Market Structure
Supply Chain Map
Trade & Policy
Operating Norms
Deliverables
Buyer Intelligence
Account Basics
Spend & Scope
Procurement Model
Vendor Requirements
Terms & Policies
Entry Strategy
Pain Points & Triggers
Outputs
Pricing Analysis
Benchmarks
Trends
Should-Cost
Indexation
Landed Cost
Commercial Terms
Deliverables
Brand Analysis
Positioning & Value Prop
Share & Presence
Customer Evidence
Go-to-Market
Digital & Reputation
Compliance & Trust
KPIs & Gaps
Outputs
Full Research Suite comprises of:
Market outlook & trends analysis
Interviews & case studies
Strategic recommendations
Vendor profiles & capabilities analysis
5-year forecasts
8 regions and 60+ country-level data splits
Market segment data splits
12 months of continuous data updates
DELIVERED AS:
PDF EXCEL ONLINE
Plastic Tubes for Effervescent Tablets Market Size and Share Forecast Outlook 2025 to 2035
Plastic Banding Market Size and Share Forecast Outlook 2025 to 2035
Plastic Tube Market Size and Share Forecast Outlook 2025 to 2035
Plastic Jar Packaging Market Forecast and Outlook 2025 to 2035
Plastic Cases Market Size and Share Forecast Outlook 2025 to 2035
Plastic Jar Industry Analysis in the United States Size and Share Forecast Outlook 2025 to 2035
Plastic Cutlery Market Forecast and Outlook 2025 to 2035
Plastic Vial Market Forecast and Outlook 2025 to 2035
Plastic Hot and Cold Pipe Market Forecast and Outlook 2025 to 2035
Plastic Retort Can Market Size and Share Forecast Outlook 2025 to 2035
Plastic Gears Market Size and Share Forecast Outlook 2025 to 2035
Plastic Additive Market Size and Share Forecast Outlook 2025 to 2035
Plastic Market Size and Share Forecast Outlook 2025 to 2035
Plastic Vials and Ampoules Market Size and Share Forecast Outlook 2025 to 2035
Plastic Healthcare Packaging Market Size and Share Forecast Outlook 2025 to 2035
Plastic Bottle Industry Analysis in Malaysia Size and Share Forecast Outlook 2025 to 2035
Plastic Drum Industry Analysis in Malaysia Size and Share Forecast Outlook 2025 to 2035
Plastic Healthcare Packaging Industry Analysis in Western Europe Size and Share Forecast Outlook 2025 to 2035
Plastic Healthcare Packaging Industry Analysis in Korea Size and Share Forecast Outlook 2025 to 2035
Plastic Healthcare Packaging Industry Analysis in Japan Size and Share Forecast Outlook 2025 to 2035

Thank you!
You will receive an email from our Business Development Manager. Please be sure to check your SPAM/JUNK folder too.
Chat With
MaRIA