Plastic Rigid IBC Market Size and Share Forecast Outlook 2025 to 2035

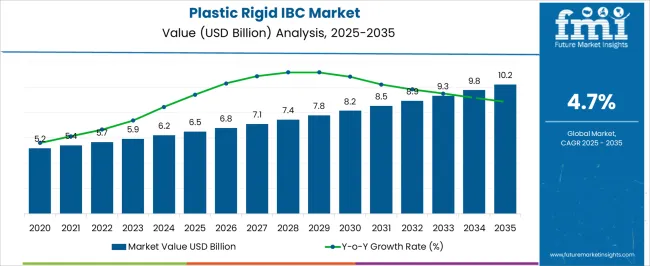
The Plastic Rigid IBC Market is estimated to be valued at USD 6.5 billion in 2025 and is projected to reach USD 10.2 billion by 2035, registering a compound annual growth rate (CAGR) of 4.7% over the forecast period.
Quick Stats for Plastic Rigid IBC Market

  • Plastic Rigid IBC Market Industry Value (2025): USD 6.5 billion
  • Plastic Rigid IBC Market Forecast Value (2035): USD 10.2 billion
  • Plastic Rigid IBC Market Forecast CAGR: 4.7%
  • Leading Segment in Plastic Rigid IBC Market in 2025: HDPE (39.8%)
  • Key Growth Region in Plastic Rigid IBC Market: North America, Asia-Pacific, Europe
  • Top Key Players in Plastic Rigid IBC Market: Greif Inc., Mauser Packaging Solutions, Schütz GmbH & Co. KGaA, Schoeller Allibert Services B.V., Elkhart Plastics (Myers Industries, Inc.), RIKUTEC Group, Snyder Industries, ACO Container Systems, Core Plastech International Inc., CL Smith, Auer Packaging, Time Technoplast Ltd., Pyramid IBC Containers, Bison IBC Ltd., MaschioPack GmbH, TranPak Inc., FACH-PAK Sp. z o.o., Horen Group

Plastic Rigid Ibc Market Market Value Analysis

Metric Value
Plastic Rigid IBC Market Estimated Value in (2025 E) USD 6.5 billion
Plastic Rigid IBC Market Forecast Value in (2035 F) USD 10.2 billion
Forecast CAGR (2025 to 2035) 4.7%

Rationale for Segmental Growth in the Plastic Rigid IBC Market

The plastic rigid IBC market is experiencing robust growth driven by increasing demand for safe and efficient bulk storage and transportation solutions across industrial and commercial sectors. Current market conditions are characterized by widespread adoption in chemical, food, pharmaceutical, and logistics applications, supported by the durability, chemical resistance, and cost-effectiveness of plastic IBCs.

Regulatory emphasis on safe handling and environmental compliance is influencing product design and material selection. The future outlook is shaped by expansion of industrial production capacities, growth in e-commerce and logistics networks, and rising awareness of operational efficiency and sustainability.

Technological innovations in container design, lightweight construction, and modular handling are enhancing usability and reducing operational costs Growth rationale is anchored on the versatility of IBCs in diverse storage and transport scenarios, the ability of manufacturers to provide standardized yet customizable solutions, and the strengthening of distribution and supply chain networks, which collectively ensure consistent market expansion and higher adoption across industrial and commercial end users.
Segmental Analysis

Insights into the Material Segment

Plastic Rigid Ibc Market Analysis By Material

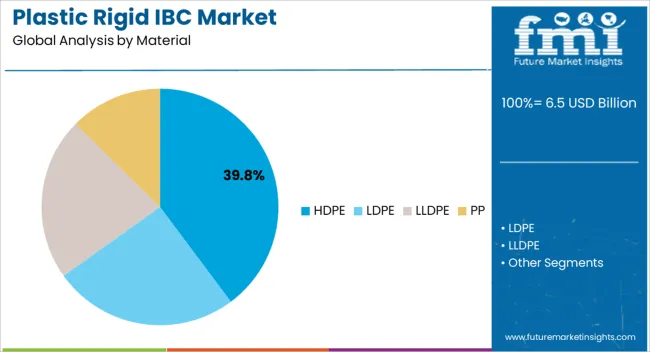
The HDPE segment, holding 39.80% of the material category, has been leading due to its high chemical resistance, durability, and adaptability for various industrial applications. Adoption has been supported by consistent performance in harsh chemical and environmental conditions, while ease of manufacturing and cost-effectiveness have reinforced its preference among buyers.

Market confidence has been strengthened through adherence to regulatory and safety standards, ensuring reliability in storage and transport. Technological improvements in HDPE formulation and molding processes have enhanced container strength, longevity, and recyclability.

Growth is further supported by increasing demand from industrial and commercial sectors requiring robust and reusable bulk containers HDPE IBCs are expected to maintain their market leadership due to their balanced performance, cost efficiency, and scalability in production.
Insights into the Capacity Segment

Plastic Rigid Ibc Market Analysis By Capacity

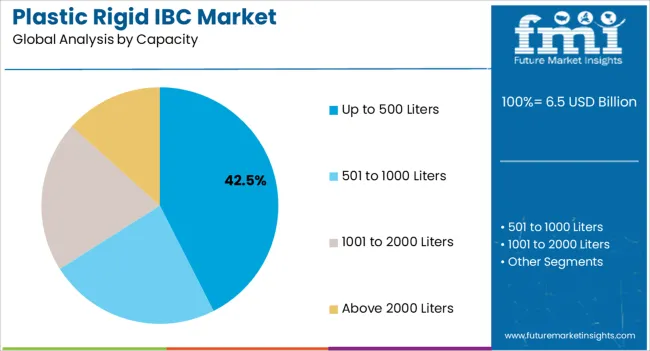
The up to 500 liters capacity segment, representing 42.50% of the capacity category, has maintained prominence due to its suitability for medium-scale industrial and commercial applications where handling, storage, and transport efficiency are critical. Adoption has been facilitated by compatibility with standard handling equipment, ease of stacking, and reduced footprint requirements.

Operational efficiency and safety compliance have strengthened preference among industrial buyers, while cost optimization and versatility in usage across chemicals, food, and pharmaceutical sectors have reinforced market dominance.

Continued innovation in container design, including ergonomic features and modular handling capabilities, is expected to sustain the segment’s market share and support steady growth across industries.
Insights into the End Use Segment

Plastic Rigid Ibc Market Analysis By End Use

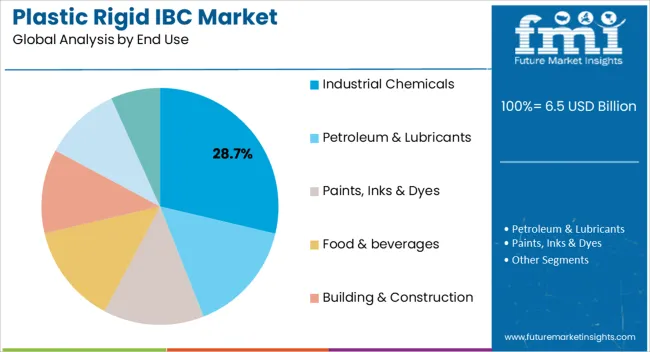
The industrial chemicals segment, accounting for 28.70% of the end-use category, has emerged as the leading application due to high demand for safe and chemically resistant storage solutions. Adoption has been driven by the need for reliable bulk containment, regulatory compliance, and operational efficiency in handling reactive and hazardous materials.

Performance consistency, durability, and adherence to industry safety standards have reinforced market confidence. Growth is further supported by increasing chemical production capacities, expansion of industrial infrastructure, and adoption of reusable containers to optimize cost and sustainability.

The segment is expected to maintain its market share as industrial chemical applications continue to rely on plastic rigid IBCs for safe and efficient storage and transportation.

Technological Disruption Limits the Global Plastic Rigid IBC Market Size

Various factors restrain global market growth. A few of these factors are as follows:

  • Regulatory and Compliance Constraints: Government compliance may significantly restrain the global market due to a lack of safety, legal issues, product labeling, and declining market growth.
  • Economic Factors: Rising inflation, currency exchange, economic recessions, and high interest rates are restraining the global market. These factors are affecting business investment and consumer spending.
  • Geopolitical Tensions: Trade disputes, conflicts, and political instability hinder countries' trade and disrupt supply chains.
  • Resource Scarcity: Limitations of raw materials, rare metals, and energy greatly impact costs that impact businesses in several industries.
  • Technological Disruptions: Some industries are unable to adopt new technologies that may restrain market growth. The innovations are rapid technological advancements that are limiting growth.
  • Shortage of Labor: The need for more labor in several industries is limiting the production capacity. This factor is a decline in the market growth.

Historical Performance and Future Growth of the Plastic Rigid IBC Market

The global market recorded remarkable historical growth, with a valuation of USD 6.5 billion in 2025. The increasing demand for storage of goods, liquids, and powders is raising the adoption of plastic rigid IBC. These IBCs are reducing the high cost of transportation. Plastic rigid IBCs are reusable containers that enhance the safety of goods. These are available in different shapes and sizes as per consumers' desire.

The plastic rigid IBCs can save nearly three-forth in storage and transportation works. The chemical, beverages, and other sectors are shifting their preferences towards plastic rigid IBC due to its durability and strength.

Country-wise Insights

Rapid Urbanization and Manufacturing Activities Upsurge China Market

China is estimated to secure a CAGR of 13.9% in the global market during the forecast period. China is influenced by several factors as follows:
  • Manufacturing and Export Hub: China is leading the manufacturing sector by developing unique and innovative goods. The large workforce, robust supply chain, and manufacturers are expanding China's plastic rigid IBC market growth.
  • Rapid Urbanization: The growing urbanization is increasing the demand for infrastructure development for packaging and surging the demand for plastic rigid IBCs.
  • Government initiatives: The Chinese government is playing a crucial role in developing high-tech manufacturing, international trade, and transportation, increasing the adoption of plastic rigid IBCs.
  • Consumer Market: China plays an essential role in consumer goods, widely increasing the demand for plastic rigid IBC to ensure safety.
  • Environment Regulations: The growing concerns towards the environmental crisis are increasing the demand for sustainable and eco-friendly packaging and advancing China plastic rigid IBC market growth.
  • E-commerce Boom: The expanding e-commerce and online shopping is a key solution to increasing the demand for bulk packaging for transporting goods and services.

Diverse Industries and Technologies Upsurge the United States Market

Plastic Rigid Ibc Market Country Value Analysis

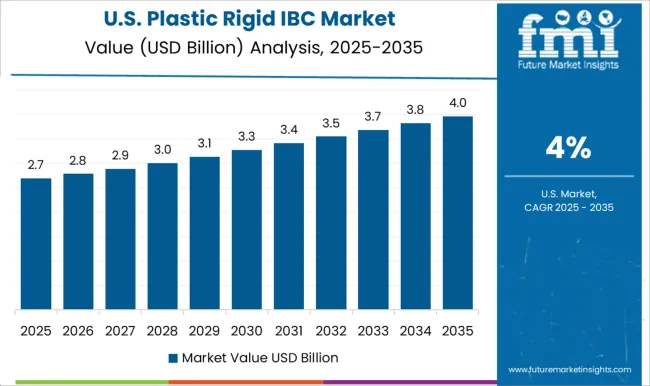
The United States is anticipated to dominate the global market by capturing a CAGR of 18.3% by 2035. The United States plastic rigid IBC market is significantly driving the global market through various aspects, including:
  • Diverse Industries: The United States is home to diverse industries such as agriculture, pharmaceuticals, food & beverages, and chemicals. These sectors significantly increase the demand for plastic rigid IBCs for handling bulk materials.
  • Regulatory Compliance: The growing stringent regulations on hazardous materials are increasing the adoption of UN/DOT-certified plastic rigid IBCs and are expanding the market growth.
  • Innovation and Technology: The growing innovation and technologies, such as the Internet of Things, to monitor and track goods and services during transportation.

Manufacturing Expertise Drives Germany Market

Plastic Rigid Ibc Market Europe Country Market Share Analysis, 2025 & 2035

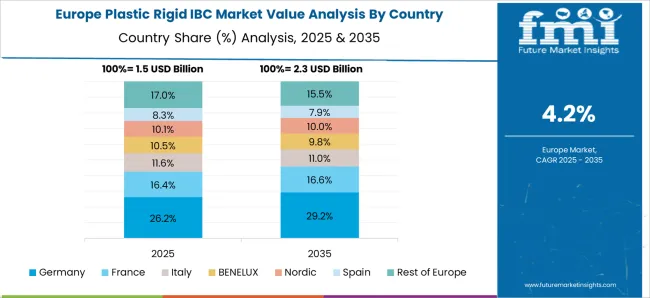
Germany is anticipated to capture a CAGR of 6.8% in the global market during the forecast period. Several factors robust to the German plastic rigid IBC market are as follows:

  • Manufacturing Expertise: Germany has a huge manufacturing and engineering sector that is accelerating the demand for standardized plastic rigid IBCs.
  • Chemical Sector Growth: The rapidly growing chemical industry is heavily reliant on plastic rigid IBC for durable and safe chemical transportation.
  • Environmental Consciousness: Industries are focused on reducing carbon emissions with their sustainability options, such as recyclable plastic rigid IBCs, which are advancing the German market.
  • Export and Logistics: Germany is a key exporter of logistics that increasing the adoption of plastic rigid IBC for export activities.

Food and Beverages Export Propel Canada Market

Canada is likely to register a CAGR of 3.0% in the global market during the forecast period. The following drives are enhancing Canada's plastic rigid IBC market.

  • Resource-based Industries: The rapidly growing resource-based industries such as agriculture, mining, and forestry hugely rely on plastic rigid IBC for transporting products and services. They are increasing the adoption of eco-friendly solutions to drive the Canadian market.
  • Exporting Food & Beverages: The increasing export activities of food & beverages at international markets are surging the demand for plastic rigid IBC for secure transport.
  • Transportation Infrastructure: Canada is rich in transporting infrastructure. They offer safe, convenient, cost-effective, and reliable transportation of materials with the adoption of plastic rigid IBC.

Government Initiatives and Rapid Industrialization Expand India Market

India is anticipated to secure a CAGR of 5.3% in the global market during the forecast period. A few factors are uplifting India’s plastic rigid IBC market.

  • Rapid Industrialization: The growing industries are increasing the adoption of plastic rigid IBCs to handle materials in bulk quantity. These industries are mining, agriculture, chemicals, and pharmaceuticals.
  • Initiatives: The government of India proposes various plans to enhance the domestic manufacturing sector. These initiatives boom the Indian market and increase the production of plastic rigid IBC.
  • Export Opportunities: The increasing export activities require huge quantities of plastic rigid IBCs for shipments, which are advancing Indian market revenue.

Category-wise Insights

PP Material Type is Highly Preferred in the Market

Based on material type, the PP material segment is likely to lead the global market by securing a share of 71.6% in the global market by 2035. PP is an excellent material type with chemical resistance, such as bases, acids, and solvents. The demand for PP is widely increasing due to its durability in harsh environmental conditions, and various industries popularly adopt it.

Top Segment PP Material
CAGR (2025 to 2035) 71.6%

PP has relatively low costs, and end users are surging its usage due to affordability, which is expanding the market reach. Due to its lightweight and thermal stability, end users, such as the automotive and packaging sector, are increasing its adoption. PP can easily be modified through advanced manufacturing techniques such as extrusion and blow molding, which are fueling the plastic rigid IBC market share.

The Chemical Sector is Highly Sought-after

Based on end use, the chemical sector is estimated to dominate the global market by capturing a share of 26.5% during the forecast period. The chemical industry is a huge sector that offers intermediates, raw materials, and other materials that are advancing market growth.

Top Segment Chemical Sector
CAGR (2025 to 2035) 26.5%

The chemical industry is a fundamental sector due to its wide range as compared to the automotive and construction sectors. The growing innovations and research activities are developing improved chemical compounds, processes, and materials to expand plastic rigid IBC market growth.
Competitive Landscape

Plastic Rigid Ibc Market Analysis By Company

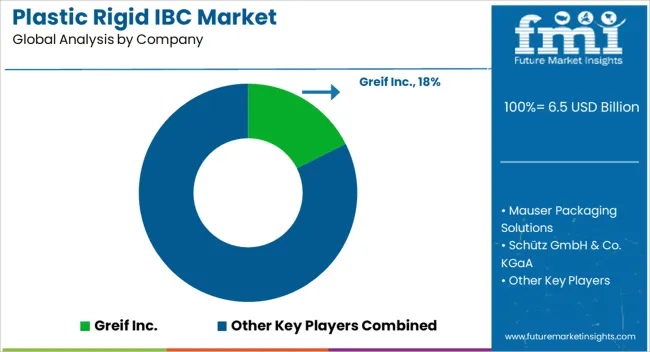
The global market is highly competitive because of prominent vendors globally. These prominent vendors are developing advanced and improved products by investing their million-dollar amount in research activities. They are carrying new ideas to expand their global reach.

Key players are the backbone that uplifts the global market through their innovations and marketing tactics. They are adopting various marketing methodologies such as mergers, agreements, collaborations, partnerships, and product launches.

Recent Developments in the Plastic Rigid IBC Market

  • In 2025, Mauser Packaging Solution, a Georgia-based packaging company, announced its expansion with the launch of a new product, UN-rated IBC.
  • In 2024, Grief Inc., a manufacturer of industrial packaging products, announced its newly launched product, rigid IBC, to expand its business portfolio.

Key Companies in the Plastic Rigid IBC Market

  • Greif Inc.
  • Mauser Packaging Solutions
  • Schütz GmbH & Co. KGaA
  • Schoeller Allibert Services B.V.
  • Elkhart Plastics (Myers Industries, Inc.)
  • RIKUTEC Group
  • Snyder Industries
  • ACO Container Systems
  • Core Plastech International Inc.
  • CL Smith
  • Auer Packaging
  • Time Technoplast Ltd.
  • Pyramid IBC Containers
  • Bison IBC Ltd.
  • MaschioPack GmbH
  • TranPak Inc.
  • FACH-PAK Sp. z o.o.
  • Horen Group

Key Segments in the Plastic Rigid IBC Market

By Material:

  • HDPE
  • LDPE
  • LLDPE
  • PP

By Capacity:

  • Up to 500 Liters
  • 501 to 1000 Liters
  • 1001 to 2000 Liters
  • Above 2000 Liters

By End Use:

  • Industrial Chemicals
  • Petroleum & Lubricants
  • Paints, Inks & Dyes
  • Food & beverages
  • Building & Construction
  • Pharmaceuticals
  • Others (Waste Disposal/Recycling & Silage, etc.)

By Region:

  • North America
  • Latin America
  • Europe
  • South Asia
  • East Asia
  • The Middle East & Africa
  • Oceania

Table of Content

  1. Executive Summary
    • Global Market Outlook
    • Demand-side Trends
    • Supply-side Trends
    • Technology Roadmap Analysis
    • Analysis and Recommendations
  2. Market Overview
    • Market Coverage / Taxonomy
    • Market Definition / Scope / Limitations
  3. Market Background
    • Market Dynamics
      • Drivers
      • Restraints
      • Opportunity
      • Trends
    • Scenario Forecast
      • Demand in Optimistic Scenario
      • Demand in Likely Scenario
      • Demand in Conservative Scenario
    • Opportunity Map Analysis
    • Product Life Cycle Analysis
    • Supply Chain Analysis
    • Investment Feasibility Matrix
    • Value Chain Analysis
    • PESTLE and Porter’s Analysis
    • Regulatory Landscape
    • Regional Parent Market Outlook
    • Production and Consumption Statistics
    • Import and Export Statistics
  4. Global Market Analysis 2020 to 2024 and Forecast, 2025 to 2035
    • Historical Market Size Value (USD Million) Analysis, 2020 to 2024
    • Current and Future Market Size Value (USD Million) Projections, 2025 to 2035
      • Y-o-Y Growth Trend Analysis
      • Absolute $ Opportunity Analysis
  5. Global Market Pricing Analysis 2020 to 2024 and Forecast 2025 to 2035
  6. Global Market Analysis 2020 to 2024 and Forecast 2025 to 2035, By Material
    • Introduction / Key Findings
    • Historical Market Size Value (USD Million) Analysis By Material , 2020 to 2024
    • Current and Future Market Size Value (USD Million) Analysis and Forecast By Material , 2025 to 2035
      • HDPE
      • LDPE
      • LLDPE
      • PP
    • Y-o-Y Growth Trend Analysis By Material , 2020 to 2024
    • Absolute $ Opportunity Analysis By Material , 2025 to 2035
  7. Global Market Analysis 2020 to 2024 and Forecast 2025 to 2035, By Capacity
    • Introduction / Key Findings
    • Historical Market Size Value (USD Million) Analysis By Capacity, 2020 to 2024
    • Current and Future Market Size Value (USD Million) Analysis and Forecast By Capacity, 2025 to 2035
      • Up to 500 Liters
      • 501 to 1000 Liters
      • 1001 to 2000 Liters
      • Above 2000 Liters
    • Y-o-Y Growth Trend Analysis By Capacity, 2020 to 2024
    • Absolute $ Opportunity Analysis By Capacity, 2025 to 2035
  8. Global Market Analysis 2020 to 2024 and Forecast 2025 to 2035, By End Use
    • Introduction / Key Findings
    • Historical Market Size Value (USD Million) Analysis By End Use, 2020 to 2024
    • Current and Future Market Size Value (USD Million) Analysis and Forecast By End Use, 2025 to 2035
      • Industrial Chemicals
      • Petroleum & Lubricants
      • Paints, Inks & Dyes
      • Food & beverages
      • Building & Construction
      • Pharmaceuticals
      • Others (Waste Disposal/Recycling & Silage, etc.)
    • Y-o-Y Growth Trend Analysis By End Use, 2020 to 2024
    • Absolute $ Opportunity Analysis By End Use, 2025 to 2035
  9. Global Market Analysis 2020 to 2024 and Forecast 2025 to 2035, By Region
    • Introduction
    • Historical Market Size Value (USD Million) Analysis By Region, 2020 to 2024
    • Current Market Size Value (USD Million) Analysis and Forecast By Region, 2025 to 2035
      • North America
      • Latin America
      • Western Europe
      • Eastern Europe
      • East Asia
      • South Asia and Pacific
      • Middle East & Africa
    • Market Attractiveness Analysis By Region
  10. North America Market Analysis 2020 to 2024 and Forecast 2025 to 2035, By Country
    • Historical Market Size Value (USD Million) Trend Analysis By Market Taxonomy, 2020 to 2024
    • Market Size Value (USD Million) Forecast By Market Taxonomy, 2025 to 2035
      • By Country
        • USA
        • Canada
        • Mexico
      • By Material
      • By Capacity
      • By End Use
    • Market Attractiveness Analysis
      • By Country
      • By Material
      • By Capacity
      • By End Use
    • Key Takeaways
  11. Latin America Market Analysis 2020 to 2024 and Forecast 2025 to 2035, By Country
    • Historical Market Size Value (USD Million) Trend Analysis By Market Taxonomy, 2020 to 2024
    • Market Size Value (USD Million) Forecast By Market Taxonomy, 2025 to 2035
      • By Country
        • Brazil
        • Chile
        • Rest of Latin America
      • By Material
      • By Capacity
      • By End Use
    • Market Attractiveness Analysis
      • By Country
      • By Material
      • By Capacity
      • By End Use
    • Key Takeaways
  12. Western Europe Market Analysis 2020 to 2024 and Forecast 2025 to 2035, By Country
    • Historical Market Size Value (USD Million) Trend Analysis By Market Taxonomy, 2020 to 2024
    • Market Size Value (USD Million) Forecast By Market Taxonomy, 2025 to 2035
      • By Country
        • Germany
        • UK
        • Italy
        • Spain
        • France
        • Nordic
        • BENELUX
        • Rest of Western Europe
      • By Material
      • By Capacity
      • By End Use
    • Market Attractiveness Analysis
      • By Country
      • By Material
      • By Capacity
      • By End Use
    • Key Takeaways
  13. Eastern Europe Market Analysis 2020 to 2024 and Forecast 2025 to 2035, By Country
    • Historical Market Size Value (USD Million) Trend Analysis By Market Taxonomy, 2020 to 2024
    • Market Size Value (USD Million) Forecast By Market Taxonomy, 2025 to 2035
      • By Country
        • Russia
        • Poland
        • Hungary
        • Balkan & Baltic
        • Rest of Eastern Europe
      • By Material
      • By Capacity
      • By End Use
    • Market Attractiveness Analysis
      • By Country
      • By Material
      • By Capacity
      • By End Use
    • Key Takeaways
  14. East Asia Market Analysis 2020 to 2024 and Forecast 2025 to 2035, By Country
    • Historical Market Size Value (USD Million) Trend Analysis By Market Taxonomy, 2020 to 2024
    • Market Size Value (USD Million) Forecast By Market Taxonomy, 2025 to 2035
      • By Country
        • China
        • Japan
        • South Korea
      • By Material
      • By Capacity
      • By End Use
    • Market Attractiveness Analysis
      • By Country
      • By Material
      • By Capacity
      • By End Use
    • Key Takeaways
  15. South Asia and Pacific Market Analysis 2020 to 2024 and Forecast 2025 to 2035, By Country
    • Historical Market Size Value (USD Million) Trend Analysis By Market Taxonomy, 2020 to 2024
    • Market Size Value (USD Million) Forecast By Market Taxonomy, 2025 to 2035
      • By Country
        • India
        • ASEAN
        • Australia & New Zealand
        • Rest of South Asia and Pacific
      • By Material
      • By Capacity
      • By End Use
    • Market Attractiveness Analysis
      • By Country
      • By Material
      • By Capacity
      • By End Use
    • Key Takeaways
  16. Middle East & Africa Market Analysis 2020 to 2024 and Forecast 2025 to 2035, By Country
    • Historical Market Size Value (USD Million) Trend Analysis By Market Taxonomy, 2020 to 2024
    • Market Size Value (USD Million) Forecast By Market Taxonomy, 2025 to 2035
      • By Country
        • Kingdom of Saudi Arabia
        • Other GCC Countries
        • Turkiye
        • South Africa
        • Other African Union
        • Rest of Middle East & Africa
      • By Material
      • By Capacity
      • By End Use
    • Market Attractiveness Analysis
      • By Country
      • By Material
      • By Capacity
      • By End Use
    • Key Takeaways
  17. Key Countries Market Analysis
    • USA
      • Pricing Analysis
      • Market Share Analysis, 2024
        • By Material
        • By Capacity
        • By End Use
    • Canada
      • Pricing Analysis
      • Market Share Analysis, 2024
        • By Material
        • By Capacity
        • By End Use
    • Mexico
      • Pricing Analysis
      • Market Share Analysis, 2024
        • By Material
        • By Capacity
        • By End Use
    • Brazil
      • Pricing Analysis
      • Market Share Analysis, 2024
        • By Material
        • By Capacity
        • By End Use
    • Chile
      • Pricing Analysis
      • Market Share Analysis, 2024
        • By Material
        • By Capacity
        • By End Use
    • Germany
      • Pricing Analysis
      • Market Share Analysis, 2024
        • By Material
        • By Capacity
        • By End Use
    • UK
      • Pricing Analysis
      • Market Share Analysis, 2024
        • By Material
        • By Capacity
        • By End Use
    • Italy
      • Pricing Analysis
      • Market Share Analysis, 2024
        • By Material
        • By Capacity
        • By End Use
    • Spain
      • Pricing Analysis
      • Market Share Analysis, 2024
        • By Material
        • By Capacity
        • By End Use
    • France
      • Pricing Analysis
      • Market Share Analysis, 2024
        • By Material
        • By Capacity
        • By End Use
    • India
      • Pricing Analysis
      • Market Share Analysis, 2024
        • By Material
        • By Capacity
        • By End Use
    • ASEAN
      • Pricing Analysis
      • Market Share Analysis, 2024
        • By Material
        • By Capacity
        • By End Use
    • Australia & New Zealand
      • Pricing Analysis
      • Market Share Analysis, 2024
        • By Material
        • By Capacity
        • By End Use
    • China
      • Pricing Analysis
      • Market Share Analysis, 2024
        • By Material
        • By Capacity
        • By End Use
    • Japan
      • Pricing Analysis
      • Market Share Analysis, 2024
        • By Material
        • By Capacity
        • By End Use
    • South Korea
      • Pricing Analysis
      • Market Share Analysis, 2024
        • By Material
        • By Capacity
        • By End Use
    • Russia
      • Pricing Analysis
      • Market Share Analysis, 2024
        • By Material
        • By Capacity
        • By End Use
    • Poland
      • Pricing Analysis
      • Market Share Analysis, 2024
        • By Material
        • By Capacity
        • By End Use
    • Hungary
      • Pricing Analysis
      • Market Share Analysis, 2024
        • By Material
        • By Capacity
        • By End Use
    • Kingdom of Saudi Arabia
      • Pricing Analysis
      • Market Share Analysis, 2024
        • By Material
        • By Capacity
        • By End Use
    • Turkiye
      • Pricing Analysis
      • Market Share Analysis, 2024
        • By Material
        • By Capacity
        • By End Use
    • South Africa
      • Pricing Analysis
      • Market Share Analysis, 2024
        • By Material
        • By Capacity
        • By End Use
  18. Market Structure Analysis
    • Competition Dashboard
    • Competition Benchmarking
    • Market Share Analysis of Top Players
      • By Regional
      • By Material
      • By Capacity
      • By End Use
  19. Competition Analysis
    • Competition Deep Dive
      • Greif Inc.
        • Overview
        • Product Portfolio
        • Profitability by Market Segments (Product/Age /Sales Channel/Region)
        • Sales Footprint
        • Strategy Overview
          • Marketing Strategy
          • Product Strategy
          • Channel Strategy
      • Mauser Packaging Solutions
      • Schütz GmbH & Co. KGaA
      • Schoeller Allibert Services B.V.
      • Elkhart Plastics (Myers Industries, Inc.)
      • RIKUTEC Group
      • Snyder Industries
      • ACO Container Systems
      • Core Plastech International Inc.
      • CL Smith
      • Auer Packaging
      • Time Technoplast Ltd.
      • Pyramid IBC Containers
      • Bison IBC Ltd.
      • MaschioPack GmbH
      • TranPak Inc.
      • FACH-PAK Sp. z o.o.
      • Horen Group
  20. Assumptions & Acronyms Used
  21. Research Methodology

List of Tables

  • Table 1: Global Market Value (USD Million) Forecast by Region, 2020 to 2035
  • Table 2: Global Market Value (USD Million) Forecast by Material , 2020 to 2035
  • Table 3: Global Market Value (USD Million) Forecast by Capacity, 2020 to 2035
  • Table 4: Global Market Value (USD Million) Forecast by End Use, 2020 to 2035
  • Table 5: North America Market Value (USD Million) Forecast by Country, 2020 to 2035
  • Table 6: North America Market Value (USD Million) Forecast by Material , 2020 to 2035
  • Table 7: North America Market Value (USD Million) Forecast by Capacity, 2020 to 2035
  • Table 8: North America Market Value (USD Million) Forecast by End Use, 2020 to 2035
  • Table 9: Latin America Market Value (USD Million) Forecast by Country, 2020 to 2035
  • Table 10: Latin America Market Value (USD Million) Forecast by Material , 2020 to 2035
  • Table 11: Latin America Market Value (USD Million) Forecast by Capacity, 2020 to 2035
  • Table 12: Latin America Market Value (USD Million) Forecast by End Use, 2020 to 2035
  • Table 13: Western Europe Market Value (USD Million) Forecast by Country, 2020 to 2035
  • Table 14: Western Europe Market Value (USD Million) Forecast by Material , 2020 to 2035
  • Table 15: Western Europe Market Value (USD Million) Forecast by Capacity, 2020 to 2035
  • Table 16: Western Europe Market Value (USD Million) Forecast by End Use, 2020 to 2035
  • Table 17: Eastern Europe Market Value (USD Million) Forecast by Country, 2020 to 2035
  • Table 18: Eastern Europe Market Value (USD Million) Forecast by Material , 2020 to 2035
  • Table 19: Eastern Europe Market Value (USD Million) Forecast by Capacity, 2020 to 2035
  • Table 20: Eastern Europe Market Value (USD Million) Forecast by End Use, 2020 to 2035
  • Table 21: East Asia Market Value (USD Million) Forecast by Country, 2020 to 2035
  • Table 22: East Asia Market Value (USD Million) Forecast by Material , 2020 to 2035
  • Table 23: East Asia Market Value (USD Million) Forecast by Capacity, 2020 to 2035
  • Table 24: East Asia Market Value (USD Million) Forecast by End Use, 2020 to 2035
  • Table 25: South Asia and Pacific Market Value (USD Million) Forecast by Country, 2020 to 2035
  • Table 26: South Asia and Pacific Market Value (USD Million) Forecast by Material , 2020 to 2035
  • Table 27: South Asia and Pacific Market Value (USD Million) Forecast by Capacity, 2020 to 2035
  • Table 28: South Asia and Pacific Market Value (USD Million) Forecast by End Use, 2020 to 2035
  • Table 29: Middle East & Africa Market Value (USD Million) Forecast by Country, 2020 to 2035
  • Table 30: Middle East & Africa Market Value (USD Million) Forecast by Material , 2020 to 2035
  • Table 31: Middle East & Africa Market Value (USD Million) Forecast by Capacity, 2020 to 2035
  • Table 32: Middle East & Africa Market Value (USD Million) Forecast by End Use, 2020 to 2035

List of Figures

  • Figure 1: Global Market Pricing Analysis
  • Figure 2: Global Market Value (USD Million) Forecast 2020-2035
  • Figure 3: Global Market Value Share and BPS Analysis by Material , 2025 and 2035
  • Figure 4: Global Market Y-o-Y Growth Comparison by Material , 2025-2035
  • Figure 5: Global Market Attractiveness Analysis by Material
  • Figure 6: Global Market Value Share and BPS Analysis by Capacity, 2025 and 2035
  • Figure 7: Global Market Y-o-Y Growth Comparison by Capacity, 2025-2035
  • Figure 8: Global Market Attractiveness Analysis by Capacity
  • Figure 9: Global Market Value Share and BPS Analysis by End Use, 2025 and 2035
  • Figure 10: Global Market Y-o-Y Growth Comparison by End Use, 2025-2035
  • Figure 11: Global Market Attractiveness Analysis by End Use
  • Figure 12: Global Market Value (USD Million) Share and BPS Analysis by Region, 2025 and 2035
  • Figure 13: Global Market Y-o-Y Growth Comparison by Region, 2025-2035
  • Figure 14: Global Market Attractiveness Analysis by Region
  • Figure 15: North America Market Incremental Dollar Opportunity, 2025-2035
  • Figure 16: Latin America Market Incremental Dollar Opportunity, 2025-2035
  • Figure 17: Western Europe Market Incremental Dollar Opportunity, 2025-2035
  • Figure 18: Eastern Europe Market Incremental Dollar Opportunity, 2025-2035
  • Figure 19: East Asia Market Incremental Dollar Opportunity, 2025-2035
  • Figure 20: South Asia and Pacific Market Incremental Dollar Opportunity, 2025-2035
  • Figure 21: Middle East & Africa Market Incremental Dollar Opportunity, 2025-2035
  • Figure 22: North America Market Value Share and BPS Analysis by Country, 2025 and 2035
  • Figure 23: North America Market Value Share and BPS Analysis by Material , 2025 and 2035
  • Figure 24: North America Market Y-o-Y Growth Comparison by Material , 2025-2035
  • Figure 25: North America Market Attractiveness Analysis by Material
  • Figure 26: North America Market Value Share and BPS Analysis by Capacity, 2025 and 2035
  • Figure 27: North America Market Y-o-Y Growth Comparison by Capacity, 2025-2035
  • Figure 28: North America Market Attractiveness Analysis by Capacity
  • Figure 29: North America Market Value Share and BPS Analysis by End Use, 2025 and 2035
  • Figure 30: North America Market Y-o-Y Growth Comparison by End Use, 2025-2035
  • Figure 31: North America Market Attractiveness Analysis by End Use
  • Figure 32: Latin America Market Value Share and BPS Analysis by Country, 2025 and 2035
  • Figure 33: Latin America Market Value Share and BPS Analysis by Material , 2025 and 2035
  • Figure 34: Latin America Market Y-o-Y Growth Comparison by Material , 2025-2035
  • Figure 35: Latin America Market Attractiveness Analysis by Material
  • Figure 36: Latin America Market Value Share and BPS Analysis by Capacity, 2025 and 2035
  • Figure 37: Latin America Market Y-o-Y Growth Comparison by Capacity, 2025-2035
  • Figure 38: Latin America Market Attractiveness Analysis by Capacity
  • Figure 39: Latin America Market Value Share and BPS Analysis by End Use, 2025 and 2035
  • Figure 40: Latin America Market Y-o-Y Growth Comparison by End Use, 2025-2035
  • Figure 41: Latin America Market Attractiveness Analysis by End Use
  • Figure 42: Western Europe Market Value Share and BPS Analysis by Country, 2025 and 2035
  • Figure 43: Western Europe Market Value Share and BPS Analysis by Material , 2025 and 2035
  • Figure 44: Western Europe Market Y-o-Y Growth Comparison by Material , 2025-2035
  • Figure 45: Western Europe Market Attractiveness Analysis by Material
  • Figure 46: Western Europe Market Value Share and BPS Analysis by Capacity, 2025 and 2035
  • Figure 47: Western Europe Market Y-o-Y Growth Comparison by Capacity, 2025-2035
  • Figure 48: Western Europe Market Attractiveness Analysis by Capacity
  • Figure 49: Western Europe Market Value Share and BPS Analysis by End Use, 2025 and 2035
  • Figure 50: Western Europe Market Y-o-Y Growth Comparison by End Use, 2025-2035
  • Figure 51: Western Europe Market Attractiveness Analysis by End Use
  • Figure 52: Eastern Europe Market Value Share and BPS Analysis by Country, 2025 and 2035
  • Figure 53: Eastern Europe Market Value Share and BPS Analysis by Material , 2025 and 2035
  • Figure 54: Eastern Europe Market Y-o-Y Growth Comparison by Material , 2025-2035
  • Figure 55: Eastern Europe Market Attractiveness Analysis by Material
  • Figure 56: Eastern Europe Market Value Share and BPS Analysis by Capacity, 2025 and 2035
  • Figure 57: Eastern Europe Market Y-o-Y Growth Comparison by Capacity, 2025-2035
  • Figure 58: Eastern Europe Market Attractiveness Analysis by Capacity
  • Figure 59: Eastern Europe Market Value Share and BPS Analysis by End Use, 2025 and 2035
  • Figure 60: Eastern Europe Market Y-o-Y Growth Comparison by End Use, 2025-2035
  • Figure 61: Eastern Europe Market Attractiveness Analysis by End Use
  • Figure 62: East Asia Market Value Share and BPS Analysis by Country, 2025 and 2035
  • Figure 63: East Asia Market Value Share and BPS Analysis by Material , 2025 and 2035
  • Figure 64: East Asia Market Y-o-Y Growth Comparison by Material , 2025-2035
  • Figure 65: East Asia Market Attractiveness Analysis by Material
  • Figure 66: East Asia Market Value Share and BPS Analysis by Capacity, 2025 and 2035
  • Figure 67: East Asia Market Y-o-Y Growth Comparison by Capacity, 2025-2035
  • Figure 68: East Asia Market Attractiveness Analysis by Capacity
  • Figure 69: East Asia Market Value Share and BPS Analysis by End Use, 2025 and 2035
  • Figure 70: East Asia Market Y-o-Y Growth Comparison by End Use, 2025-2035
  • Figure 71: East Asia Market Attractiveness Analysis by End Use
  • Figure 72: South Asia and Pacific Market Value Share and BPS Analysis by Country, 2025 and 2035
  • Figure 73: South Asia and Pacific Market Value Share and BPS Analysis by Material , 2025 and 2035
  • Figure 74: South Asia and Pacific Market Y-o-Y Growth Comparison by Material , 2025-2035
  • Figure 75: South Asia and Pacific Market Attractiveness Analysis by Material
  • Figure 76: South Asia and Pacific Market Value Share and BPS Analysis by Capacity, 2025 and 2035
  • Figure 77: South Asia and Pacific Market Y-o-Y Growth Comparison by Capacity, 2025-2035
  • Figure 78: South Asia and Pacific Market Attractiveness Analysis by Capacity
  • Figure 79: South Asia and Pacific Market Value Share and BPS Analysis by End Use, 2025 and 2035
  • Figure 80: South Asia and Pacific Market Y-o-Y Growth Comparison by End Use, 2025-2035
  • Figure 81: South Asia and Pacific Market Attractiveness Analysis by End Use
  • Figure 82: Middle East & Africa Market Value Share and BPS Analysis by Country, 2025 and 2035
  • Figure 83: Middle East & Africa Market Value Share and BPS Analysis by Material , 2025 and 2035
  • Figure 84: Middle East & Africa Market Y-o-Y Growth Comparison by Material , 2025-2035
  • Figure 85: Middle East & Africa Market Attractiveness Analysis by Material
  • Figure 86: Middle East & Africa Market Value Share and BPS Analysis by Capacity, 2025 and 2035
  • Figure 87: Middle East & Africa Market Y-o-Y Growth Comparison by Capacity, 2025-2035
  • Figure 88: Middle East & Africa Market Attractiveness Analysis by Capacity
  • Figure 89: Middle East & Africa Market Value Share and BPS Analysis by End Use, 2025 and 2035
  • Figure 90: Middle East & Africa Market Y-o-Y Growth Comparison by End Use, 2025-2035
  • Figure 91: Middle East & Africa Market Attractiveness Analysis by End Use
  • Figure 92: Global Market - Tier Structure Analysis
  • Figure 93: Global Market - Company Share Analysis

Frequently Asked Questions

How big is the plastic rigid ibc market in 2025?

The global plastic rigid ibc market is estimated to be valued at USD 6.5 billion in 2025.

What will be the size of plastic rigid ibc market in 2035?

The market size for the plastic rigid ibc market is projected to reach USD 10.2 billion by 2035.

How much will be the plastic rigid ibc market growth between 2025 and 2035?

The plastic rigid ibc market is expected to grow at a 4.7% CAGR between 2025 and 2035.

What are the key product types in the plastic rigid ibc market?

The key product types in plastic rigid ibc market are hdpe, ldpe, lldpe and pp.

Which capacity segment to contribute significant share in the plastic rigid ibc market in 2025?

In terms of capacity, up to 500 liters segment to command 42.5% share in the plastic rigid ibc market in 2025.

Explore Similar Insights

Future Market Insights

Plastic Rigid IBC Market

Chat With MaRIA

Chat With

MaRIA

Hi There, I am MaRIA, Your Market Research Intelligence Assistant. How may I help you?