Plastic Bottles Market Outlook for 2023 to 2033

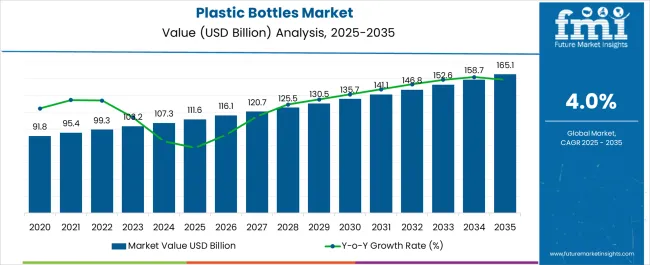
The plastic bottles market size is estimated to be worth US$ 102.8 billion in 2023. The market outlook is even brighter for 2033, with expectations exceeding US$ 155.2 billion by 2033. This upward trajectory is supported by a sluggish CAGR of 4.2% over the forecast period.

Demand Analysis in the Plastic Bottles

  • Plastic bottle demand forecast is expected to be particularly strong in developing countries, where population growth and rising disposable incomes create a new middle class with a growing appetite for consumer goods.
  • The growing popularity of sustainable plastic bottles is creating new opportunities for businesses in the plastic bottle industry, such as the development of recycled plastic bottles and biodegradable plastic bottles.
  • Several factors, including the growing consumer awareness of the environmental impact of plastic bottles and the increasing availability of recycled plastic materials, drive the demand for recycled plastic bottles.
  • eCommerce retailers are increasingly using plastic bottles to package and ship their products due to their lightweight, durable, and affordable nature.
  • New technologies are being developed to improve the sustainability and performance of plastic bottles, such as biodegradable and PET plastic bottles.
  • The growing consumer awareness of the environmental impact of plastic bottles is driving demand for more sustainable plastic bottle packaging, such as recycled plastic bottles and biodegradable plastic bottles.
  • The growing demand for healthy beverages is boosting demand for plastic bottles used to package these products, many of which are now made from recycled or biodegradable materials.
  • Changing consumer preferences for plastic bottles is leading to a shift towards reusable plastic bottles and plastic bottles with unique designs, as consumers increasingly demand sustainable, convenient, and aesthetically pleasing bottles.
  • In regions with limited access to clean drinking water, there is a growing demand for packaged water in plastic bottles.
Attributes Details
Plastic Bottles Market Value for 2023 US$ 102.8 billion
Plastic Bottles Market Value for 2033 US$ 155.2 billion
Plastic Bottles Market Forecast CAGR for 2023 to 2033 4.2%

Don't pay for what you don't need

Customize your report by selecting specific countries or regions and save 30%!

Historical Performance and Future Growth of Plastic Bottles Market

The plastic bottles industry has demonstrated steady resilience and growth from 2018 to 2022. This upward trajectory underscores its adaptability to changing consumer preferences and technological advancements.

Moving forward, we anticipate this favorable trend to continue, with a projected CAGR of 4.2%. This adjusted growth rate aligns with the industry's maturity and evolving consumer preferences. As the plastic bottle sector evolves, this rate reflects its enduring stability and potential for sustained expansion.

Short-term Analysis of Plastic Bottles Market from 2018 to 2022

The plastic bottles market experienced a CAGR of 4.1% from 2018 to 2022. This market expanded from US$ 84.1 billion in 2018 to US$ 102.8 billion in 2022. Key drivers during this phase included increased consumer demand for packaged beverages, the convenience of plastic bottles, and sustainability initiatives promoting recyclability.

The market's adaptability to changing consumer preferences and innovations in bottle design and materials played pivotal roles in this growth. The short-term analysis underscores the market's agility in responding to evolving trends and the enduring consumer appeal of plastic bottles.

Mid-term Analysis of Plastic Bottles Market from 2023 to 2028

In the mid-term, the market value is estimated to be worth US$ 102.8 billion in 2023 and is projected to reach US$ 125.67 billion by 2028. From 2023 to 2028, the plastic bottles market is expected to maintain steady growth.

During this phase, factors such as sustainable packaging practices, advancements in lightweight bottle designs, and the growing demand for bottled water are expected to sustain steady growth. Additionally, consumer awareness of the environmental impact of plastic bottles is anticipated to drive innovations in recyclability and eco-friendly materials. Increasing environmental awareness is boosting the plastic bottle recycling market, as sustainable practices gain momentum. The mid-term analysis reflects the market's stability and its alignment with evolving sustainability trends.

Long-term Analysis of Plastic Bottles Market from 2028 to 2033

In the long-term analysis spanning 2028 to 2033, the plastic bottles market is projected to reach a substantial US$ 155.2 billion. This prolonged growth trajectory is underpinned by several factors, including ongoing efforts to reduce single-use plastic waste through recycling and circular economy initiatives.

Innovations in biodegradable plastics and alternative packaging solutions are also expected to contribute to the market's expansion. Furthermore, the enduring consumer preference for the convenience and affordability of plastic bottles is likely to sustain demand. The long-term analysis underscores the industry's commitment to sustainability and its potential for significant growth well into the future.

Key Plastic Bottles Market Trends

  • Anti-Microbial Coatings: Plastic bottles with anti-microbial coatings are gaining prominence, ensuring hygiene and safety, especially for the healthcare and food industries.
  • Single-Use Plastic Alternatives: Increasing awareness of plastic pollution is driving the development of innovative single-use plastic alternatives, such as edible packaging and dissolvable bottles.
  • Hybrid Materials: Manufacturers are exploring hybrid materials, combining plastic with biodegradable components or natural fibers to enhance sustainability.
  • Eco-packaging Partnerships: Collaborations between plastic bottle manufacturers and environmental organizations are fostering sustainable practices and eco-friendly packaging solutions.
  • Niche Beverage Packaging: Specialized bottles for niche beverages like craft beers, kombucha, and artisanal spirits are on the rise, catering to diverse consumer preferences.
  • Connected Packaging: Beyond smart bottles, packaging is incorporating technologies like NFC (Near Field Communication) for interactive consumer engagement and product information.
  • Child-resistant Designs: Child-resistant plastic bottle designs are gaining importance, particularly for packaging pharmaceuticals and cannabis-infused products.
  • Supply Chain Transparency: Brands are using QR codes and blockchain technology to enhance transparency by providing consumers with information about the bottle's journey, from production to recycling.
  • 3D Printing: The adoption of 3D printing in bottle manufacturing allows for intricate and customized designs, reducing waste and production time.
  • Alternative Filling Materials: Some companies are exploring alternative filling materials like seaweed-based capsules, offering eco-friendly and biodegradable options for liquid products.
Ismail Sutaria
Ismail Sutaria

Principal Consultant

Talk to Analyst

Find your sweet spots for generating winning opportunities in this market.

Category-wise Insights

In this dedicated section, FMI Analysts conduct a comprehensive analysis of the plastic bottles industry. We delve into key segments, providing valuable insights into prevailing consumer preferences and emerging market trends that shape the industry's trajectory. In a period marked by substantial growth and transformation, grasping the significance and consequences of these segments is vital for industry participants and stakeholders alike.

High-performance PE Plastic Segment Leading the Charge in the Market

Attributes Details
Top Material Type PE
Market Share in 2023 34.3%

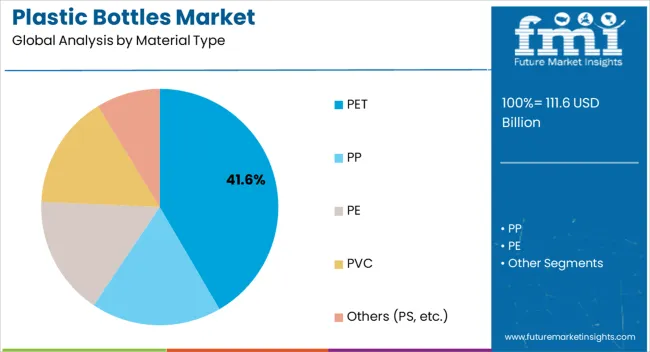
High-performance PE plastic, with a substantial market share of 34.3% in 2023, spearheads the plastic bottle industry. This dominance can be attributed to its remarkable durability, excellent chemical resistance, and widespread applicability across various sectors. Particularly in demanding applications like pharmaceuticals and industrial chemicals, high-performance PE plastic bottles have emerged as the preferred choice. Their ability to withstand extreme conditions, coupled with a focus on sustainability through recyclability, positions this segment as a frontrunner in the market's evolution. The blow-molded plastic bottles market is poised for expansion as industries seek cost-effective and lightweight packaging solutions.

Sustaining Consumer Trust and Convenience Drives the Growth in Food Packaging Segment

Attributes Details
Top End Use Food
Market Share in 2023 36.1%

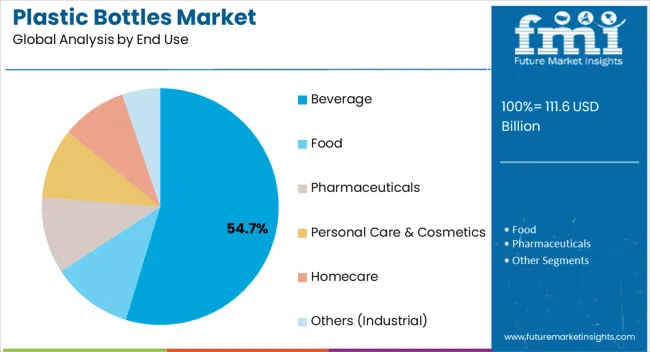
The food packaging segment stands tall, with a market share of 36.1% in 2023, making it a pivotal force in the plastic bottles industry. Its prominence stems from the perpetual demand for convenient and hygienic food storage solutions. Consumers prioritize freshness and safety, and plastic bottles designed for food meet these criteria efficiently. Additionally, innovative designs that enhance shelf appeal and ensure product integrity have further bolstered this segment's dominance. Amidst evolving dietary trends and global food consumption patterns, food packaging remains a dynamic and influential market force.
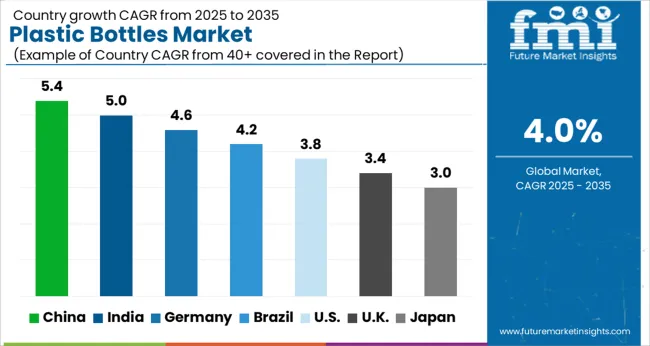
Country-wise Insights

In this exclusive segment, our team of FMI analysts ventures into the intricate tapestry of the plastic bottles market with a global perspective. We delve into the market's multifaceted landscape, peering through the lens of individual countries to unveil the distinct dynamics at play. This journey unveils the diverse opportunities and developing trends that can be instrumental in molding the future of the plastic bottle industry on a global scale.

North America Plastic Bottles Market

Country Market Share in 2023
United States 21.3%
Canada 3.1%

Sustainability Pioneers and Pragmatists in the United States Plastic Bottles Market

In North America, the United States pharmaceutical plastic bottles market emerges as a trailblazer in the global plastic bottles market, boasting a substantial 21.3% market share in 2023. The growth is underpinned by a robust shift towards sustainable plastic solutions. As environmental concerns take center stage, manufacturers are increasingly adopting recyclable materials and innovative eco-friendly designs. Consumer demand for eco-conscious packaging aligns perfectly with this trend, propelling the United States market forward.

Canada, with a 3.1% market share in 2023, is also making strides in sustainability but at a more measured pace. While eco-friendly initiatives are on the rise, the market here is marked by a pragmatic approach. Canadian consumers prioritize the reduction of single-use plastics, which has led to innovative solutions like reusable bottles. The country's commitment to recycling and a gradual transition towards sustainable packaging solutions contribute to its steady growth.

Europe Plastic Bottles Market

Country Market Share in 2023
Germany 4.3%
United Kingdom 2.8%
Spain 2.0%
France 1.6%
Italy 1.2%

In Europe, Germany commands a 4.3% market share in 2023, driven by a relentless pursuit of innovation. The German market is characterized by a penchant for cutting-edge technologies, leading to the development of advanced plastic bottle designs. Consumers here favor smart and user-friendly packaging, which has fueled the adoption of features like tamper-evident caps and interactive labels. The strong presence of the automotive and pharmaceutical industries further boosts demand for specialized plastic bottles.

The United Kingdom, with a 2.8% market share in 2023, stands out as a leader in embracing sustainability within the plastic bottles market. The driving force behind this growth is the rising environmental consciousness among consumers, which has prompted a notable shift towards recyclable materials and a reduction in plastic waste. Additionally, the surge in eCommerce has created a heightened demand for secure and efficient packaging solutions, further bolstering the plastic bottles market in the region.

Spain, contributing 2.0% to the market in 2023, demonstrates steady growth driven by evolving consumer preferences and the expansion of various industries. The Spanish market distinguishes itself with its adaptability and a clear preference for cost-effective packaging solutions. Spanish consumers favor practical and economically viable packaging options that align with their lifestyle choices and economic considerations.

France, holding a 1.6% market share, places significant emphasis on quality and aesthetics within the plastic bottles industry. This market caters to discerning consumers, particularly in the pharmaceutical and cosmetics sectors, where unique and high-performance packaging designs thrive. The growth in France's plastic bottles market is sustained by a firm commitment to delivering packaging solutions that are visually appealing and functionally efficient.

Italy, with a 1.2% market share, adopts a well-rounded approach by prioritizing both sustainability and innovation. Its strategic geographical location near key European manufacturing hubs enables agile responses to evolving trends and consumer demands. The Italian market seamlessly integrates eco-conscious practices with cutting-edge packaging solutions, resulting in a dynamic and responsive market landscape.

Asia Pacific Plastic Bottles Market

Country Market Share in 2023
China 15.5%
India 7.2%
Japan 5.4%
South Korea 3.3%
Thailand 1.9%

China dominates the Asia Pacific with an impressive 15.5% market share in 2023. This commanding position stems from factors such as rapid urbanization and the expanding middle class. With the middle class seeking an array of consumer products, the plastic bottles market has experienced a substantial boost. Furthermore, China is placing a growing emphasis on sustainability, leading manufacturers to invest in recyclable materials and environmentally responsible packaging, aligning perfectly with the evolving preferences of Chinese consumers.

India plastic bottle market is thriving, holding a substantial 7.2% market share. Key drivers include the country's food and beverage industry's rapid expansion and heightened hygiene awareness. These factors are significantly boosting the demand for plastic bottles. Additionally, the surge in eCommerce activities in India has resulted in an increased need for secure and dependable packaging solutions, further fueling the market's growth.

Japan, with its mature market, maintains a 5.4% market share in 2023. Japanese consumers highly value unique designs and high-performance packaging solutions, emphasizing innovation and quality. Significant demand generators for plastic bottles include the pharmaceutical and cosmetic industries. Japan's market reflects a discerning consumer base that sets a premium on packaging excellence.

South Korea, mirroring Japan's preference for high-quality packaging, contributes to the region with a 3.3% market share. South Koreans prioritize packaging that is sophisticated and aesthetically appealing. Industries such as cosmetics and hygiene, where presentation and functionality are paramount, favor plastic vessels, contributing to their prevalence in the market.

Thailand, holding a 1.9% market share in the plastic bottles sector, exhibits consistent growth driven primarily by the thriving tourism and hospitality industries. Plastic bottles are preferred for on-the-go consumption due to their portability and convenience. As Thailand advances its recycling infrastructure, sustainability is emerging as a significant factor shaping the market's evolution, aligning with global trends in responsible packaging.

Get the data you need at a Fraction of the cost

Personalize your report by choosing insights you need
and save 40%!

Key Players Shaping the Future Outlook of the Plastic Bottles Industry

The plastic bottles industry is marked by intense competition, with several prominent players vying for dominance. The most compelling opportunity lies in the sustainable packaging trend. Investors and industry players can capitalize on this by shifting towards eco-friendly materials, promoting recycling practices, and innovating in sustainable packaging solutions. Consumer and regulatory preferences are increasingly favoring sustainable options, making this a strategic move to secure long-term growth and success in the industry.

The key players in the plastic bottles industry face substantial challenges, primarily stemming from stringent environmental regulations and the growing scrutiny of single-use plastics. Navigating these challenges necessitates substantial investments in sustainable production practices and alternative materials. Furthermore, competition from alternative packaging materials such as glass and metal demands continuous innovation to maintain market share

The adoption of recycled plastics offers a promising avenue, with companies investing in closed-loop recycling systems and consumer education. The rise of eCommerce has generated a demand for specialized packaging solutions, opening doors for innovation. Customization and personalization trends also provide scope to cater to niche markets, fostering consumer loyalty.
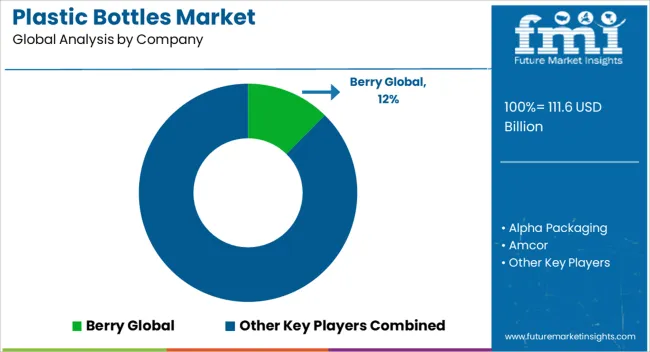
Recent Developments in the Plastic Bottles Industry

  • Amcor's recyclable flexible packaging for water bottles. Amcor, a global packaging company, has developed a new recyclable flexible packaging for water bottles.
  • Berry Global's sustainable plastic bottle caps. Berry Global, a manufacturer of plastic packaging products, has developed a new line of sustainable plastic bottle caps.
  • Danone's recycled plastic water bottles. Danone, a multinational food products company, has announced to switch to using 100% recycled plastic for its water bottles by 2025.
  • Nestlé's reusable plastic water bottles. Nestlé, a multinational food and drink company, has launched a new line of reusable plastic water bottles.
  • PepsiCo's recycled plastic bottles. PepsiCo, a multinational beverage and snack food company, has announced to use 100% recycled plastic for its water bottles by 2030.

Key Companies in the Market

  • Berry Global
  • Alpha Packaging
  • Amcor
  • Comar LLC
  • Graham Packaging
  • Cospack America Corporation
  • Bericap Gmbh & Co. KG
  • Plastic Holdings Inc
  • CKS Packaging Inc
  • Weener Plastics Group BV
  • Container Corporation of Canada
  • Ontario Plastic Container Producers Ltd.
  • Constar Internationals, Inc.
  • Alpack Plastics
  • Plastipak Holdings, Inc.
  • Resilux NV
  • Greiner Packaging
  • Silgan Holdings
  • Altium Packaging
  • Rexam Inc.

Key Segments

By Material Type:

  • PET
  • PP
  • PE
  • PVC
  • Others (PS, etc.)

By Capacity:

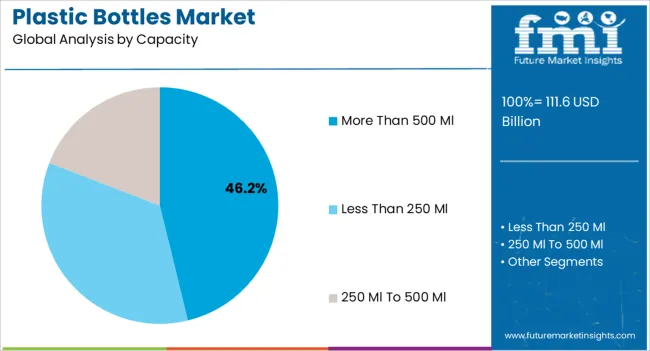
  • Less than 250 ml
  • 250 ml to 500 ml
  • More than 500 ml

By End Use:

  • Food
  • Beverage
  • Pharmaceuticals
  • Personal Care & Cosmetics
  • Homecare
  • Others (Industrial)

By Region:

  • North America
  • Latin America
  • Europe
  • South Asia
  • East Asia
  • Oceania
  • The Middle East and Africa

Frequently Asked Questions

What is the Market Potential for Plastic Bottles?

The plastic bottles market is projected to expand at a CAGR of 4.2% between 2023 and 2033.

What is the Plastic Bottles Market Growth Outlook by 2033?

The plastic bottles market is anticipated to surpass US$ 155.2 billion by 2033.

What is the Size of the Plastic Water Bottle Market in India?

The plastic bottle market in India is expanding, with a sizable 7.2% market share in 2023.

How Big is the Plastic Bottles Market in 2023?

The plastic bottles market is estimated to be worth US$ 102.8 billion in 2023.

Why are Plastic Bottles Getting Higher Demand?

The shift toward sustainable packaging solutions and the increasing emphasis on reducing single-use plastics drives the demand for plastic bottles.

Which End-use Industry Dominates the Market in 2023?

The food packaging segment dominates the market.

Which Countries Hold Significant Market Shares In 2023?

The United States leads with 21.3% in the global plastic bottles market.

Table of Content
1. Executive Summary
    1.1. Global Market Outlook
    1.2. Demand-side Trends
    1.3. Supply-side Trends
    1.4. Technology Roadmap Analysis
    1.5. Analysis and Recommendations
2. Market Overview
    2.1. Market Coverage / Taxonomy
    2.2. Market Definition / Scope / Limitations
3. Market Background
    3.1. Market Dynamics
        3.1.1. Drivers
        3.1.2. Restraints
        3.1.3. Opportunity
        3.1.4. Trends
    3.2. Scenario Forecast
        3.2.1. Demand in Optimistic Scenario
        3.2.2. Demand in Likely Scenario
        3.2.3. Demand in Conservative Scenario
    3.3. Opportunity Map Analysis
    3.4. Product Life Cycle Analysis
    3.5. Supply Chain Analysis
        3.5.1. Supply Side Participants and their Roles
            3.5.1.1. Producers
            3.5.1.2. Mid-Level Participants (Traders/ Agents/ Brokers)
            3.5.1.3. Wholesalers and Distributors
        3.5.2. Value Added and Value Created at Node in the Supply Chain
        3.5.3. List of Raw Material Suppliers
        3.5.4. List of Existing and Potential Buyer’s
    3.6. Investment Feasibility Matrix
    3.7. Value Chain Analysis
        3.7.1. Profit Margin Analysis
        3.7.2. Wholesalers and Distributors
        3.7.3. Retailers
    3.8. PESTLE and Porter’s Analysis
    3.9. Regulatory Landscape
        3.9.1. By Key Regions
        3.9.2. By Key Countries
    3.10. Regional Parent Market Outlook
    3.11. Production and Consumption Statistics
    3.12. Import and Export Statistics
4. Global Market Analysis 2018 to 2022 and Forecast, 2023 to 2033
    4.1. Historical Market Size Value (US$ Million) & Volume (Units) Analysis, 2018 to 2022
    4.2. Current and Future Market Size Value (US$ Million) & Volume (Units) Projections, 2023 to 2033
        4.2.1. Y-o-Y Growth Trend Analysis
        4.2.2. Absolute $ Opportunity Analysis
5. Global Market Analysis 2018 to 2022 and Forecast 2023 to 2033, By Material Type
    5.1. Introduction / Key Findings
    5.2. Historical Market Size Value (US$ Million) & Volume (Units) Analysis By Material Type, 2018 to 2022
    5.3. Current and Future Market Size Value (US$ Million) & Volume (Units) Analysis and Forecast By Material Type, 2023 to 2033
        5.3.1. PET
        5.3.2. PP
        5.3.3. PE
        5.3.4. PVC
        5.3.5. Others
    5.4. Y-o-Y Growth Trend Analysis By Material Type, 2018 to 2022
    5.5. Absolute $ Opportunity Analysis By Material Type, 2023 to 2033
6. Global Market Analysis 2018 to 2022 and Forecast 2023 to 2033, By Capacity
    6.1. Introduction / Key Findings
    6.2. Historical Market Size Value (US$ Million) & Volume (Units) Analysis By Capacity, 2018 to 2022
    6.3. Current and Future Market Size Value (US$ Million) & Volume (Units) Analysis and Forecast By Capacity, 2023 to 2033
        6.3.1. Less than 250 ml
        6.3.2. 250 ml to 500 ml
        6.3.3. More than 500 ml
    6.4. Y-o-Y Growth Trend Analysis By Capacity, 2018 to 2022
    6.5. Absolute $ Opportunity Analysis By Capacity, 2023 to 2033
7. Global Market Analysis 2018 to 2022 and Forecast 2023 to 2033, By End Use
    7.1. Introduction / Key Findings
    7.2. Historical Market Size Value (US$ Million) & Volume (Units) Analysis By End Use, 2018 to 2022
    7.3. Current and Future Market Size Value (US$ Million) & Volume (Units) Analysis and Forecast By End Use, 2023 to 2033
        7.3.1. Food
        7.3.2. Beverage
        7.3.3. Pharmaceuticals
        7.3.4. Personal Care & Cosmetics
        7.3.5. Homecare
        7.3.6. Others
    7.4. Y-o-Y Growth Trend Analysis By End Use, 2018 to 2022
    7.5. Absolute $ Opportunity Analysis By End Use, 2023 to 2033
8. Global Market Analysis 2018 to 2022 and Forecast 2023 to 2033, By Region
    8.1. Introduction
    8.2. Historical Market Size Value (US$ Million) & Volume (Units) Analysis By Region, 2018 to 2022
    8.3. Current Market Size Value (US$ Million) & Volume (Units) Analysis and Forecast By Region, 2023 to 2033
        8.3.1. North America
        8.3.2. Latin America
        8.3.3. Western Europe
        8.3.4. Eastern Europe
        8.3.5. South Asia and Pacific
        8.3.6. East Asia
        8.3.7. Middle East and Africa
    8.4. Market Attractiveness Analysis By Region
9. North America Market Analysis 2018 to 2022 and Forecast 2023 to 2033, By Country
    9.1. Historical Market Size Value (US$ Million) & Volume (Units) Trend Analysis By Market Taxonomy, 2018 to 2022
    9.2. Market Size Value (US$ Million) & Volume (Units) Forecast By Market Taxonomy, 2023 to 2033
        9.2.1. By Country
            9.2.1.1. USA
            9.2.1.2. Canada
        9.2.2. By Material Type
        9.2.3. By Capacity
        9.2.4. By End Use
    9.3. Market Attractiveness Analysis
        9.3.1. By Country
        9.3.2. By Material Type
        9.3.3. By Capacity
        9.3.4. By End Use
    9.4. Key Takeaways
10. Latin America Market Analysis 2018 to 2022 and Forecast 2023 to 2033, By Country
    10.1. Historical Market Size Value (US$ Million) & Volume (Units) Trend Analysis By Market Taxonomy, 2018 to 2022
    10.2. Market Size Value (US$ Million) & Volume (Units) Forecast By Market Taxonomy, 2023 to 2033
        10.2.1. By Country
            10.2.1.1. Brazil
            10.2.1.2. Mexico
            10.2.1.3. Rest of Latin America
        10.2.2. By Material Type
        10.2.3. By Capacity
        10.2.4. By End Use
    10.3. Market Attractiveness Analysis
        10.3.1. By Country
        10.3.2. By Material Type
        10.3.3. By Capacity
        10.3.4. By End Use
    10.4. Key Takeaways
11. Western Europe Market Analysis 2018 to 2022 and Forecast 2023 to 2033, By Country
    11.1. Historical Market Size Value (US$ Million) & Volume (Units) Trend Analysis By Market Taxonomy, 2018 to 2022
    11.2. Market Size Value (US$ Million) & Volume (Units) Forecast By Market Taxonomy, 2023 to 2033
        11.2.1. By Country
            11.2.1.1. Germany
            11.2.1.2. UK
            11.2.1.3. France
            11.2.1.4. Spain
            11.2.1.5. Italy
            11.2.1.6. Rest of Western Europe
        11.2.2. By Material Type
        11.2.3. By Capacity
        11.2.4. By End Use
    11.3. Market Attractiveness Analysis
        11.3.1. By Country
        11.3.2. By Material Type
        11.3.3. By Capacity
        11.3.4. By End Use
    11.4. Key Takeaways
12. Eastern Europe Market Analysis 2018 to 2022 and Forecast 2023 to 2033, By Country
    12.1. Historical Market Size Value (US$ Million) & Volume (Units) Trend Analysis By Market Taxonomy, 2018 to 2022
    12.2. Market Size Value (US$ Million) & Volume (Units) Forecast By Market Taxonomy, 2023 to 2033
        12.2.1. By Country
            12.2.1.1. Poland
            12.2.1.2. Russia
            12.2.1.3. Czech Republic
            12.2.1.4. Romania
            12.2.1.5. Rest of Eastern Europe
        12.2.2. By Material Type
        12.2.3. By Capacity
        12.2.4. By End Use
    12.3. Market Attractiveness Analysis
        12.3.1. By Country
        12.3.2. By Material Type
        12.3.3. By Capacity
        12.3.4. By End Use
    12.4. Key Takeaways
13. South Asia and Pacific Market Analysis 2018 to 2022 and Forecast 2023 to 2033, By Country
    13.1. Historical Market Size Value (US$ Million) & Volume (Units) Trend Analysis By Market Taxonomy, 2018 to 2022
    13.2. Market Size Value (US$ Million) & Volume (Units) Forecast By Market Taxonomy, 2023 to 2033
        13.2.1. By Country
            13.2.1.1. India
            13.2.1.2. Bangladesh
            13.2.1.3. Australia
            13.2.1.4. New Zealand
            13.2.1.5. Rest of South Asia and Pacific
        13.2.2. By Material Type
        13.2.3. By Capacity
        13.2.4. By End Use
    13.3. Market Attractiveness Analysis
        13.3.1. By Country
        13.3.2. By Material Type
        13.3.3. By Capacity
        13.3.4. By End Use
    13.4. Key Takeaways
14. East Asia Market Analysis 2018 to 2022 and Forecast 2023 to 2033, By Country
    14.1. Historical Market Size Value (US$ Million) & Volume (Units) Trend Analysis By Market Taxonomy, 2018 to 2022
    14.2. Market Size Value (US$ Million) & Volume (Units) Forecast By Market Taxonomy, 2023 to 2033
        14.2.1. By Country
            14.2.1.1. China
            14.2.1.2. Japan
            14.2.1.3. South Korea
        14.2.2. By Material Type
        14.2.3. By Capacity
        14.2.4. By End Use
    14.3. Market Attractiveness Analysis
        14.3.1. By Country
        14.3.2. By Material Type
        14.3.3. By Capacity
        14.3.4. By End Use
    14.4. Key Takeaways
15. Middle East and Africa Market Analysis 2018 to 2022 and Forecast 2023 to 2033, By Country
    15.1. Historical Market Size Value (US$ Million) & Volume (Units) Trend Analysis By Market Taxonomy, 2018 to 2022
    15.2. Market Size Value (US$ Million) & Volume (Units) Forecast By Market Taxonomy, 2023 to 2033
        15.2.1. By Country
            15.2.1.1. GCC Countries
            15.2.1.2. South Africa
            15.2.1.3. Israel
            15.2.1.4. Rest of MEA
        15.2.2. By Material Type
        15.2.3. By Capacity
        15.2.4. By End Use
    15.3. Market Attractiveness Analysis
        15.3.1. By Country
        15.3.2. By Material Type
        15.3.3. By Capacity
        15.3.4. By End Use
    15.4. Key Takeaways
16. Key Countries Market Analysis
    16.1. USA
        16.1.1. Pricing Analysis
        16.1.2. Market Share Analysis, 2022
            16.1.2.1. By Material Type
            16.1.2.2. By Capacity
            16.1.2.3. By End Use
    16.2. Canada
        16.2.1. Pricing Analysis
        16.2.2. Market Share Analysis, 2022
            16.2.2.1. By Material Type
            16.2.2.2. By Capacity
            16.2.2.3. By End Use
    16.3. Brazil
        16.3.1. Pricing Analysis
        16.3.2. Market Share Analysis, 2022
            16.3.2.1. By Material Type
            16.3.2.2. By Capacity
            16.3.2.3. By End Use
    16.4. Mexico
        16.4.1. Pricing Analysis
        16.4.2. Market Share Analysis, 2022
            16.4.2.1. By Material Type
            16.4.2.2. By Capacity
            16.4.2.3. By End Use
    16.5. Germany
        16.5.1. Pricing Analysis
        16.5.2. Market Share Analysis, 2022
            16.5.2.1. By Material Type
            16.5.2.2. By Capacity
            16.5.2.3. By End Use
    16.6. UK
        16.6.1. Pricing Analysis
        16.6.2. Market Share Analysis, 2022
            16.6.2.1. By Material Type
            16.6.2.2. By Capacity
            16.6.2.3. By End Use
    16.7. France
        16.7.1. Pricing Analysis
        16.7.2. Market Share Analysis, 2022
            16.7.2.1. By Material Type
            16.7.2.2. By Capacity
            16.7.2.3. By End Use
    16.8. Spain
        16.8.1. Pricing Analysis
        16.8.2. Market Share Analysis, 2022
            16.8.2.1. By Material Type
            16.8.2.2. By Capacity
            16.8.2.3. By End Use
    16.9. Italy
        16.9.1. Pricing Analysis
        16.9.2. Market Share Analysis, 2022
            16.9.2.1. By Material Type
            16.9.2.2. By Capacity
            16.9.2.3. By End Use
    16.10. Poland
        16.10.1. Pricing Analysis
        16.10.2. Market Share Analysis, 2022
            16.10.2.1. By Material Type
            16.10.2.2. By Capacity
            16.10.2.3. By End Use
    16.11. Russia
        16.11.1. Pricing Analysis
        16.11.2. Market Share Analysis, 2022
            16.11.2.1. By Material Type
            16.11.2.2. By Capacity
            16.11.2.3. By End Use
    16.12. Czech Republic
        16.12.1. Pricing Analysis
        16.12.2. Market Share Analysis, 2022
            16.12.2.1. By Material Type
            16.12.2.2. By Capacity
            16.12.2.3. By End Use
    16.13. Romania
        16.13.1. Pricing Analysis
        16.13.2. Market Share Analysis, 2022
            16.13.2.1. By Material Type
            16.13.2.2. By Capacity
            16.13.2.3. By End Use
    16.14. India
        16.14.1. Pricing Analysis
        16.14.2. Market Share Analysis, 2022
            16.14.2.1. By Material Type
            16.14.2.2. By Capacity
            16.14.2.3. By End Use
    16.15. Bangladesh
        16.15.1. Pricing Analysis
        16.15.2. Market Share Analysis, 2022
            16.15.2.1. By Material Type
            16.15.2.2. By Capacity
            16.15.2.3. By End Use
    16.16. Australia
        16.16.1. Pricing Analysis
        16.16.2. Market Share Analysis, 2022
            16.16.2.1. By Material Type
            16.16.2.2. By Capacity
            16.16.2.3. By End Use
    16.17. New Zealand
        16.17.1. Pricing Analysis
        16.17.2. Market Share Analysis, 2022
            16.17.2.1. By Material Type
            16.17.2.2. By Capacity
            16.17.2.3. By End Use
    16.18. China
        16.18.1. Pricing Analysis
        16.18.2. Market Share Analysis, 2022
            16.18.2.1. By Material Type
            16.18.2.2. By Capacity
            16.18.2.3. By End Use
    16.19. Japan
        16.19.1. Pricing Analysis
        16.19.2. Market Share Analysis, 2022
            16.19.2.1. By Material Type
            16.19.2.2. By Capacity
            16.19.2.3. By End Use
    16.20. South Korea
        16.20.1. Pricing Analysis
        16.20.2. Market Share Analysis, 2022
            16.20.2.1. By Material Type
            16.20.2.2. By Capacity
            16.20.2.3. By End Use
    16.21. GCC Countries
        16.21.1. Pricing Analysis
        16.21.2. Market Share Analysis, 2022
            16.21.2.1. By Material Type
            16.21.2.2. By Capacity
            16.21.2.3. By End Use
    16.22. South Africa
        16.22.1. Pricing Analysis
        16.22.2. Market Share Analysis, 2022
            16.22.2.1. By Material Type
            16.22.2.2. By Capacity
            16.22.2.3. By End Use
    16.23. Israel
        16.23.1. Pricing Analysis
        16.23.2. Market Share Analysis, 2022
            16.23.2.1. By Material Type
            16.23.2.2. By Capacity
            16.23.2.3. By End Use
17. Market Structure Analysis
    17.1. Competition Dashboard
    17.2. Competition Benchmarking
    17.3. Market Share Analysis of Top Players
        17.3.1. By Regional
        17.3.2. By Material Type
        17.3.3. By Capacity
        17.3.4. By End Use
18. Competition Analysis
    18.1. Competition Deep Dive
        18.1.1. Berry Global
            18.1.1.1. Overview
            18.1.1.2. Product Portfolio
            18.1.1.3. Profitability by Market Segments
            18.1.1.4. Sales Footprint
            18.1.1.5. Strategy Overview
                18.1.1.5.1. Marketing Strategy
                18.1.1.5.2. Product Strategy
                18.1.1.5.3. Channel Strategy
        18.1.2. Alpha Packaging
            18.1.2.1. Overview
            18.1.2.2. Product Portfolio
            18.1.2.3. Profitability by Market Segments
            18.1.2.4. Sales Footprint
            18.1.2.5. Strategy Overview
                18.1.2.5.1. Marketing Strategy
                18.1.2.5.2. Product Strategy
                18.1.2.5.3. Channel Strategy
        18.1.3. Amcor
            18.1.3.1. Overview
            18.1.3.2. Product Portfolio
            18.1.3.3. Profitability by Market Segments
            18.1.3.4. Sales Footprint
            18.1.3.5. Strategy Overview
                18.1.3.5.1. Marketing Strategy
                18.1.3.5.2. Product Strategy
                18.1.3.5.3. Channel Strategy
        18.1.4. Comar LLC
            18.1.4.1. Overview
            18.1.4.2. Product Portfolio
            18.1.4.3. Profitability by Market Segments
            18.1.4.4. Sales Footprint
            18.1.4.5. Strategy Overview
                18.1.4.5.1. Marketing Strategy
                18.1.4.5.2. Product Strategy
                18.1.4.5.3. Channel Strategy
        18.1.5. Graham Packaging
            18.1.5.1. Overview
            18.1.5.2. Product Portfolio
            18.1.5.3. Profitability by Market Segments
            18.1.5.4. Sales Footprint
            18.1.5.5. Strategy Overview
                18.1.5.5.1. Marketing Strategy
                18.1.5.5.2. Product Strategy
                18.1.5.5.3. Channel Strategy
        18.1.6. Cospack America Corporation
            18.1.6.1. Overview
            18.1.6.2. Product Portfolio
            18.1.6.3. Profitability by Market Segments
            18.1.6.4. Sales Footprint
            18.1.6.5. Strategy Overview
                18.1.6.5.1. Marketing Strategy
                18.1.6.5.2. Product Strategy
                18.1.6.5.3. Channel Strategy
        18.1.7. Bericap Gmbh & Co. KG
            18.1.7.1. Overview
            18.1.7.2. Product Portfolio
            18.1.7.3. Profitability by Market Segments
            18.1.7.4. Sales Footprint
            18.1.7.5. Strategy Overview
                18.1.7.5.1. Marketing Strategy
                18.1.7.5.2. Product Strategy
                18.1.7.5.3. Channel Strategy
        18.1.8. Plastic Holdings Inc
            18.1.8.1. Overview
            18.1.8.2. Product Portfolio
            18.1.8.3. Profitability by Market Segments
            18.1.8.4. Sales Footprint
            18.1.8.5. Strategy Overview
                18.1.8.5.1. Marketing Strategy
                18.1.8.5.2. Product Strategy
                18.1.8.5.3. Channel Strategy
        18.1.9. CKS Packaging Inc
            18.1.9.1. Overview
            18.1.9.2. Product Portfolio
            18.1.9.3. Profitability by Market Segments
            18.1.9.4. Sales Footprint
            18.1.9.5. Strategy Overview
                18.1.9.5.1. Marketing Strategy
                18.1.9.5.2. Product Strategy
                18.1.9.5.3. Channel Strategy
        18.1.10. Weener Plastics Group BV
            18.1.10.1. Overview
            18.1.10.2. Product Portfolio
            18.1.10.3. Profitability by Market Segments
            18.1.10.4. Sales Footprint
            18.1.10.5. Strategy Overview
                18.1.10.5.1. Marketing Strategy
                18.1.10.5.2. Product Strategy
                18.1.10.5.3. Channel Strategy
        18.1.11. Container Corporation of Canada
            18.1.11.1. Overview
            18.1.11.2. Product Portfolio
            18.1.11.3. Profitability by Market Segments
            18.1.11.4. Sales Footprint
            18.1.11.5. Strategy Overview
                18.1.11.5.1. Marketing Strategy
                18.1.11.5.2. Product Strategy
                18.1.11.5.3. Channel Strategy
        18.1.12. Ontario Plastic Container Producers Ltd.
            18.1.12.1. Overview
            18.1.12.2. Product Portfolio
            18.1.12.3. Profitability by Market Segments
            18.1.12.4. Sales Footprint
            18.1.12.5. Strategy Overview
                18.1.12.5.1. Marketing Strategy
                18.1.12.5.2. Product Strategy
                18.1.12.5.3. Channel Strategy
        18.1.13. Constar Internationals, Inc.
            18.1.13.1. Overview
            18.1.13.2. Product Portfolio
            18.1.13.3. Profitability by Market Segments
            18.1.13.4. Sales Footprint
            18.1.13.5. Strategy Overview
                18.1.13.5.1. Marketing Strategy
                18.1.13.5.2. Product Strategy
                18.1.13.5.3. Channel Strategy
        18.1.14. Alpack Plastics
            18.1.14.1. Overview
            18.1.14.2. Product Portfolio
            18.1.14.3. Profitability by Market Segments
            18.1.14.4. Sales Footprint
            18.1.14.5. Strategy Overview
                18.1.14.5.1. Marketing Strategy
                18.1.14.5.2. Product Strategy
                18.1.14.5.3. Channel Strategy
        18.1.15. Plastipak Holdings, Inc.
            18.1.15.1. Overview
            18.1.15.2. Product Portfolio
            18.1.15.3. Profitability by Market Segments
            18.1.15.4. Sales Footprint
            18.1.15.5. Strategy Overview
                18.1.15.5.1. Marketing Strategy
                18.1.15.5.2. Product Strategy
                18.1.15.5.3. Channel Strategy
        18.1.16. Resilux NV
            18.1.16.1. Overview
            18.1.16.2. Product Portfolio
            18.1.16.3. Profitability by Market Segments
            18.1.16.4. Sales Footprint
            18.1.16.5. Strategy Overview
                18.1.16.5.1. Marketing Strategy
                18.1.16.5.2. Product Strategy
                18.1.16.5.3. Channel Strategy
        18.1.17. Greiner Packaging
            18.1.17.1. Overview
            18.1.17.2. Product Portfolio
            18.1.17.3. Profitability by Market Segments
            18.1.17.4. Sales Footprint
            18.1.17.5. Strategy Overview
                18.1.17.5.1. Marketing Strategy
                18.1.17.5.2. Product Strategy
                18.1.17.5.3. Channel Strategy
19. Assumptions & Acronyms Used
20. Research Methodology
Recommendations

Packaging

Bottle Shippers Market

July 2023

REP-GB-8890

250 pages

Packaging

PET Bottles Market

December 2024

REP-GB-7570

Upcoming

Explore Packaging Insights

View Reports
Future Market Insights

Plastic Bottles Market

Schedule a Call