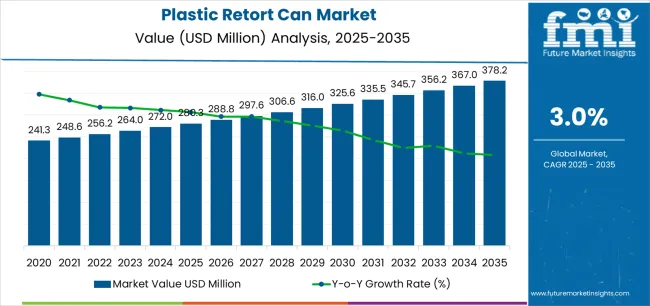
The Plastic Retort Can Market is estimated to be valued at USD 280.3 million in 2025 and is projected to reach USD 378.2 million by 2035, registering a compound annual growth rate (CAGR) of 3.0% over the forecast period.
The Plastic Retort Can market is witnessing steady growth, driven by increasing demand for convenient, durable, and shelf-stable packaging solutions across the food and beverage industry. Rising consumer preference for ready-to-eat and on-the-go meal options is fueling the adoption of retortable packaging, which provides extended shelf life while maintaining product quality and safety. Advancements in high-barrier plastics and multi-layer polymer technologies are enhancing product protection, reducing contamination risks, and ensuring compliance with food safety regulations.
The market is further supported by the growing focus on sustainable and lightweight packaging that reduces logistics costs and environmental impact. Manufacturers are increasingly integrating automation and innovative sealing technologies to improve production efficiency and product consistency.
As urbanization, busy lifestyles, and organized retail expansion continue to accelerate, demand for retortable plastic cans is expected to grow significantly Investments in research for enhanced barrier properties, recyclability, and customization capabilities are positioning the market for long-term expansion, while end users increasingly value convenience, hygiene, and portability, which continue to shape market dynamics.
| Metric | Value |
|---|---|
| Plastic Retort Can Market Estimated Value in (2025 E) | USD 280.3 million |
| Plastic Retort Can Market Forecast Value in (2035 F) | USD 378.2 million |
| Forecast CAGR (2025 to 2035) | 3.0% |
The market is segmented by Material, Capacity, and End Use and region. By Material, the market is divided into Polyethylene, Polypropylene, and Polyethylene Terephthalate. In terms of Capacity, the market is classified into Up To 150 Ml, 151 To 300 Ml, 301 To 500 Ml, and Above 500 Ml. Based on End Use, the market is segmented into Food, Beverages, Pharmaceuticals, and Other Industrial. Regionally, the market is classified into North America, Latin America, Western Europe, Eastern Europe, Balkan & Baltic Countries, Russia & Belarus, Central Asia, East Asia, South Asia & Pacific, and the Middle East & Africa.
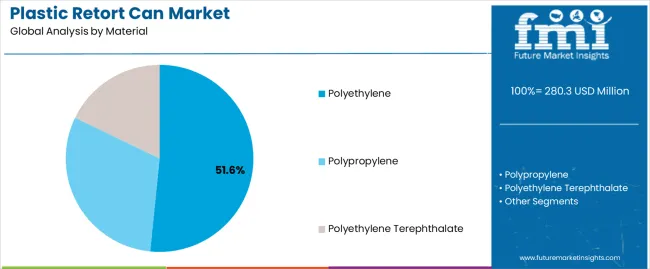
The polyethylene material segment is projected to hold 51.6% of the market revenue in 2025, establishing it as the leading material type. Growth in this segment is driven by its versatility, chemical resistance, and cost-effectiveness, which make it ideal for retortable packaging applications. Polyethylene provides excellent barrier properties against moisture, oxygen, and light, ensuring the preservation of food quality and safety.
The material’s lightweight nature reduces transportation costs and enhances ease of handling for both manufacturers and consumers. Polyethylene is compatible with multi-layer constructions and sealing technologies, allowing for extended shelf life of packaged products. Increasing consumer preference for hygienic and portable packaging formats is further supporting adoption.
Environmental initiatives promoting recyclability and sustainable polymer solutions are encouraging manufacturers to optimize polyethylene use As demand for ready-to-eat meals and on-the-go food options continues to rise, the polyethylene segment is expected to maintain its leading position, driven by a combination of functional benefits, production efficiency, and consumer acceptance in global markets.
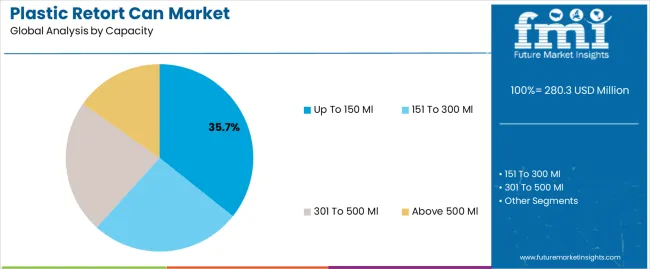
The up to 150 ml capacity segment is anticipated to account for 35.7% of the market revenue in 2025, making it the leading capacity category. Its prominence is being driven by increasing demand for small, single-serve packaging formats that cater to on-the-go consumption and portion control. This capacity size is particularly favored in ready-to-eat meals, beverages, and snack products where convenience and portability are key considerations.
Manufacturers benefit from reduced material usage and lower logistics costs while maintaining product quality. The format allows for easier handling and storage in retail and household environments, supporting widespread adoption. Growing urbanization, busy lifestyles, and increased consumer preference for individual servings are further boosting demand.
As food safety regulations emphasize hygienic packaging and preservation, the up to 150 ml segment is expected to retain its leadership in the market Manufacturers continue to optimize production and sealing technologies for this size, enhancing shelf life, consumer convenience, and operational efficiency.
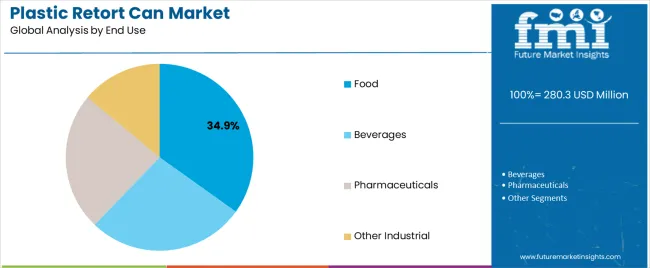
The food end use segment is expected to hold 34.9% of the market revenue in 2025, establishing it as the leading end-use category. Growth is driven by the rising consumption of packaged and ready-to-eat foods that require durable, safe, and long-lasting containers. Plastic retort cans provide extended shelf life, maintaining taste, nutritional value, and hygiene, which is critical for consumer acceptance.
The format supports a wide range of food products, including meals, snacks, and beverages, making it highly versatile. Increasing demand from convenience stores, retail chains, and online food delivery platforms is contributing to adoption. Regulatory standards for food safety, combined with consumer expectations for packaging that preserves quality and ensures portability, are further reinforcing the segment’s position.
Manufacturers are focusing on innovations such as multi-layer polyethylene structures, improved sealing mechanisms, and lightweight designs to optimize performance As consumer preferences continue to favor convenience, safety, and shelf-stable food solutions, the food segment is expected to remain the largest revenue contributor in the Plastic Retort Can market.
The scope for plastic retort can rose at a 2.6% CAGR between 2020 and 2025. The global market is achieving heights to grow at a moderate CAGR of 3.2% over the forecast period 2025 to 2035. The market experienced significant growth during the historical period, attributed to the rising demand for convenience foods.
Plastic retort cans gained popularity as a convenient packaging solution for ready to eat meals, soups, sauces, and other shelf stable products. Advancements in plastic manufacturing processes and materials also LED to the development of more durable, heat resistant, as well as cost effective plastic retort cans during the historical period.
Improved manufacturing techniques and material innovations enhanced the performance and sustainability of plastic retort cans, driving their adoption across various industries. The forecast period will experience increased market penetration of plastic retort cans in the healthcare and personal care segments.
The cans offer sterile and tamper evident packaging solutions suitable for pharmaceuticals, medical supplies, and personal care products, fueling market diversification and growth. There is an increasing demand for durable and secure packaging solutions, with the continued growth of e-commerce platforms.
Plastic retort cans with robust packaging attributes, such as tamper resistance and product protection, will witness heightened demand from e-commerce retailers and consumers.
The below table showcases revenues in terms of the top 5 leading countries, spearheaded by India and China. The countries will lead the market through 2035.
| Countries | Forecast CAGRs from 2025 to 2035 |
|---|---|
| The United States | 1.9% |
| The United Kingdom | 1.5% |
| China | 4.7% |
| Japan | 1.9% |
| India | 6.5% |
The plastic retort can market in the United States will expand at a CAGR of 1.9% through 2035. Ongoing advancements in packaging technology have LED to the development of plastic retort cans with improved barrier properties, heat resistance, and durability.
The technological innovations ensure the preservation of food products without compromising on quality, augmenting their adoption in the market. The busy lifestyles of consumers in the country drive the demand for convenient, on the go food options.
Plastic retort cans offer a convenient packaging solution for a wide range of shelf stable foods such as soups, sauces, ready meals, and snacks, catering to the needs of busy consumers seeking quick and easy meal solutions.
The plastic retort can market in the United Kingdom to expand at a CAGR of 1.5% through 2035. The country has a diverse retail landscape, including supermarkets, convenience stores, online retailers, and specialty shops.
Plastic retort cans with versatile packaging formats and robust packaging attributes are well suited for distribution across various retail channels, driving their adoption and growth in the market. Plastic retort cans are lightweight compared to traditional metal cans, reducing transportation costs and environmental impact.
Advancements in sustainable plastics, such as recyclable and biodegradable materials, make plastic retort cans more environmentally friendly, aligning with consumer preferences for sustainable packaging solutions in the United Kingdom.
Plastic retort can trend in China are taking a turn for the better. A 4.7% CAGR is forecast for the country from 2025 to 2035. China has a rapidly growing food industry, driven by population growth, urbanization, and changing dietary preferences.
Plastic retort cans find applications across a wide range of food products, including traditional Chinese cuisine, ready to eat meals, sauces, and beverages, contributing to market growth in the Chinese food industry.
The Chinese government has implemented policies and regulations to promote food safety and packaging standards. Plastic retort cans that meet regulatory requirements for food contact materials and packaging safety offer manufacturers assurance of product compliance and consumer confidence in the Chinese market.
The plastic retort can market in Japan is poised to expand at a CAGR of 1.9% through 2035. Stringent regulations and standards govern food safety and packaging requirements in Japan.
Plastic retort cans that meet regulatory requirements for food contact materials and packaging safety offer manufacturers assurance of product compliance and consumer confidence in the Japanese market.
Convenience stores play a significant role in the Japanese retail landscape, offering a wide range of packaged food products to consumers. Plastic retort cans with convenient packaging formats and attractive branding appeal to consumers in convenience stores and retail outlets, driving their adoption and growth in the Japanese market.
The plastic retort can market in India will expand at a CAGR of 6.5% through 2035. The diverse cultural landscape in India includes a wide variety of regional cuisines and ethnic foods.
Plastic retort cans provide a convenient packaging solution for preserving and distributing traditional regional dishes, catering to the preferences of consumers seeking authentic flavors and culinary experiences. The proliferation of quick service restaurants and food delivery services in urban and semi urban areas has increased the demand for packaged food products.
Plastic retort cans offer convenient packaging options for QSRs and food delivery services, allowing for easy storage, transportation, and consumption of ready to eat meals.
The below table highlights how polyethylene terephthalate segment is leading the market in terms of material, and will account for a share of 51.6% in 2025. Based on end use, the food segment is gaining heights and will to account for a share of 34.9% in 2025.
| Category | Shares in 2025 |
|---|---|
| Polyethylene Terephthalate | 51.6% |
| Food | 34.9% |
Based on material, the polyethylene terephthalate segment will dominate the plastic retort can market. PET is known for its excellent strength to weight ratio and durability, making it suitable for packaging applications requiring robust and reliable containers.
PET plastic retort cans can withstand the rigors of retort processing, ensuring product integrity and safety throughout the distribution and storage process.
PET offers excellent barrier properties against moisture, oxygen, and other external contaminants, thereby preserving the freshness, flavor, and quality of packaged products. Plastic retort cans made from PET provide effective protection against spoilage, extending the shelf life of food and beverage products.
In terms of end use, the food segment will dominate the plastic retort can market. Plastic retort cans are designed to withstand high temperatures during the retort sterilization process, ensuring the preservation of food products without the need for refrigeration.
The extended shelf life offered by plastic retort cans enhances food safety, reduces food waste, and allows for longer distribution and storage periods, driving their adoption in the food industry.
There is a growing consumer preference for convenient and ready to eat food options, driven by busy lifestyles and urbanization. Plastic retort cans provide a convenient packaging solution for a wide range of shelf stable food products, including soups, sauces, ready meals, and pet foods, catering to the needs of consumers seeking quick and easy meal solutions.
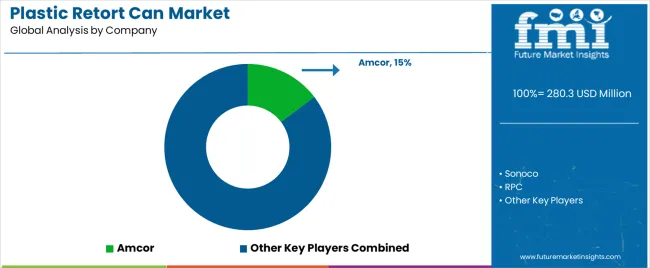
The plastic retort can market is characterized by intense competition among key players striving to maintain or enhance their market share through strategic initiatives, product innovation, and differentiation strategies.
Company Portfolio:
| Attribute | Details |
|---|---|
| Estimated Market Size in 2025 | USD 271.6 million |
| Projected Market Valuation in 2035 | USD 372.1 million |
| Value-based CAGR 2025 to 2035 | 3.2% |
| Forecast Period | 2025 to 2035 |
| Historical Data Available for | 2020 to 2025 |
| Market Analysis | Value in USD Million |
| Key Regions Covered | North America; Latin America; Western Europe; Eastern Europe; South Asia and Pacific; East Asia; The Middle East & Africa |
| Key Market Segments Covered | Material, Capacity, End Use, Region |
| Key Countries Profiled | The United States, Canada, Brazil, Mexico, Germany, France, France, Spain, Italy, Russia, Poland, Czech Republic, Romania, India, Bangladesh, Australia, New Zealand, China, Japan, South Korea, GCC countries, South Africa, Israel |
| Key Companies Profiled | Kortec; Sonoco; Klear Can; SOPAKCO; Amcor; Bemis; Milacron Co-Injection Systems; Winpack; RPC; Tekni-Plex |
The global plastic retort can market is estimated to be valued at USD 280.3 million in 2025.
The market size for the plastic retort can market is projected to reach USD 378.2 million by 2035.
The plastic retort can market is expected to grow at a 3.0% CAGR between 2025 and 2035.
The key product types in plastic retort can market are polyethylene, polypropylene and polyethylene terephthalate.
In terms of capacity, up to 150 ml segment to command 35.7% share in the plastic retort can market in 2025.


Full Research Suite comprises of:
Market outlook & trends analysis
Interviews & case studies
Strategic recommendations
Vendor profiles & capabilities analysis
5-year forecasts
8 regions and 60+ country-level data splits
Market segment data splits
12 months of continuous data updates
DELIVERED AS:
PDF EXCEL ONLINE
Industry Share & Competitive Positioning in Plastic Retort Can
Plastic Cutlery Market Forecast and Outlook 2025 to 2035
Plastic Vial Market Forecast and Outlook 2025 to 2035
Plastic Tube Market Forecast and Outlook 2025 to 2035
Plastic Hot and Cold Pipe Market Forecast and Outlook 2025 to 2035
Plastic Gears Market Size and Share Forecast Outlook 2025 to 2035
Plastic Additive Market Size and Share Forecast Outlook 2025 to 2035
Plastic Market Size and Share Forecast Outlook 2025 to 2035
Plastic Vials and Ampoules Market Size and Share Forecast Outlook 2025 to 2035
Plastic Healthcare Packaging Market Size and Share Forecast Outlook 2025 to 2035
Plastic Bottle Industry Analysis in Malaysia Size and Share Forecast Outlook 2025 to 2035
Plastic Drum Industry Analysis in Malaysia Size and Share Forecast Outlook 2025 to 2035
Plastic Healthcare Packaging Industry Analysis in Western Europe Size and Share Forecast Outlook 2025 to 2035
Plastic Healthcare Packaging Industry Analysis in Korea Size and Share Forecast Outlook 2025 to 2035
Plastic Healthcare Packaging Industry Analysis in Japan Size and Share Forecast Outlook 2025 to 2035
Plastic Bottles Market Size and Share Forecast Outlook 2025 to 2035
Plastic Rigid IBC Market Size and Share Forecast Outlook 2025 to 2035
Plastic Packaging For Food and Beverage Market Size and Share Forecast Outlook 2025 to 2035
Plastic Bag Market Size and Share Forecast Outlook 2025 to 2035
Plastic-free Packaging Market Size and Share Forecast Outlook 2025 to 2035

Thank you!
You will receive an email from our Business Development Manager. Please be sure to check your SPAM/JUNK folder too.
Chat With
MaRIA