Malaysia Plastic Drum Market Size and Share Forecast Outlook From 2025 to 2035

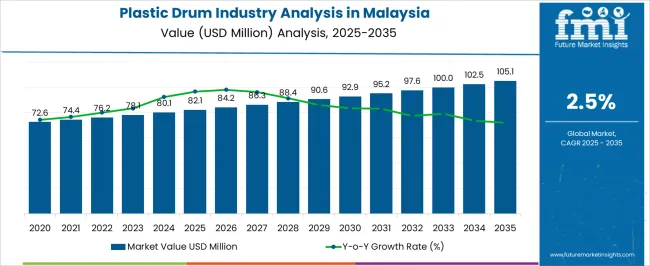
The Plastic Drum Industry Analysis in Malaysia is estimated to be valued at USD 82.1 million in 2025 and is projected to reach USD 105.1 million by 2035, registering a compound annual growth rate (CAGR) of 2.5% over the forecast period.
Quick Stats for Plastic Drum Industry Analysis in Malaysia

  • Plastic Drum Industry Analysis in Malaysia Industry Value (2025): USD 82.1 million
  • Plastic Drum Industry Analysis in Malaysia Forecast Value (2035): USD 105.1 million
  • Plastic Drum Industry Analysis in Malaysia Forecast CAGR: 2.5%
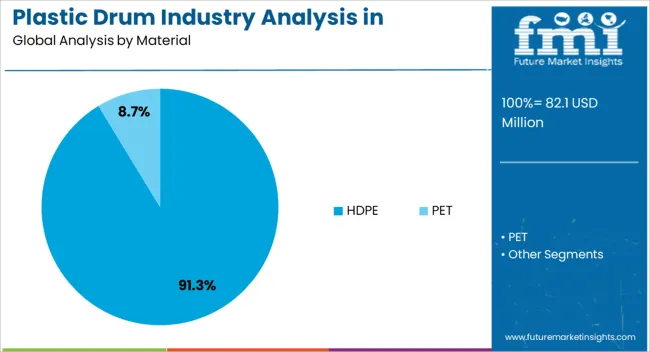
  • Leading Segment in Plastic Drum Industry Analysis in Malaysia in 2025: HDPE (91.3%)
  • Key Growth Region in Plastic Drum Industry Analysis in Malaysia: North America, Asia-Pacific, Europe
  • Top Key Players in Plastic Drum Industry Analysis in Malaysia: Qpack Industries, Taiko Drum Industries, SCHÜTZ GmbH & Co. KGaA, Mauser Packaging Solutions, Greif Malaysia, Time Technoplast Ltd, TPL Plastech Limited

Plastic Drum Industry Analysis In Malaysia Market Value Analysis

Metric Value
Plastic Drum Industry Analysis in Malaysia Estimated Value in (2025 E) USD 82.1 million
Plastic Drum Industry Analysis in Malaysia Forecast Value in (2035 F) USD 105.1 million
Forecast CAGR (2025 to 2035) 2.5%

Rationale for Segmental Growth in the Plastic Drum Industry in Malaysia

The plastic drum industry in Malaysia is expanding steadily, supported by rising demand from the chemicals, food and beverages, and pharmaceuticals sectors where safe and efficient bulk storage is essential. The industry benefits from the country’s strategic role as a manufacturing hub in Southeast Asia, with strong logistics infrastructure and increasing exports driving higher adoption of plastic-based containers.

Durability, lightweight handling, and chemical resistance have positioned plastic drums as a preferred choice over traditional metal options. Current growth is reinforced by heightened safety standards and regulatory compliance requirements in hazardous material storage.

With innovations in high-performance polymers and growing sustainability initiatives such as recyclable and reusable designs, the market outlook remains positive. The long-term trajectory is supported by industrial growth, rising export activities, and the adaptability of plastic drums across both domestic and international supply chains.
Segmental Analysis

Insights into the HDPE Segment

Plastic Drum Industry Analysis In Malaysia Analysis By Material

The HDPE segment dominates the material category with approximately 91.3% share, attributed to its superior strength, chemical resistance, and cost efficiency compared to alternative materials. HDPE drums provide high durability under extreme handling conditions, making them suitable for transporting hazardous chemicals, oils, and food-grade products.

The widespread availability of HDPE resin and established molding processes have further strengthened its adoption in Malaysia’s industrial landscape. The segment benefits from its recyclability and alignment with sustainability practices, which are increasingly prioritized by manufacturers and end-users.

With HDPE’s proven performance in maintaining product safety and extending container lifespan, this segment is projected to maintain its leading position over the forecast horizon.
Insights into the Above 210 Liters Segment

Plastic Drum Industry Analysis In Malaysia Analysis By Capacity

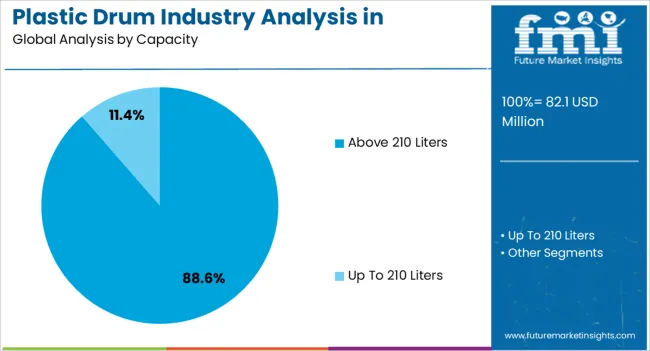
The above 210 liters segment accounts for approximately 88.6% of the capacity category in Malaysia’s plastic drum industry. This dominance reflects its critical role in large-scale bulk handling and storage requirements across industries.

Larger capacity drums reduce logistical complexity by minimizing handling frequency and optimizing transport efficiency. The segment has gained traction in sectors such as chemicals, lubricants, and food processing, where high-volume packaging ensures streamlined supply chain operations.

Its prevalence is reinforced by cost-effectiveness in per-liter storage and compatibility with global shipping standards. With industrial expansion and rising bulk export activities, the above 210 liters segment is expected to remain the preferred capacity choice in the Malaysian market.
Insights into the Closed Head Segment

Plastic Drum Industry Analysis In Malaysia Analysis By Head Type

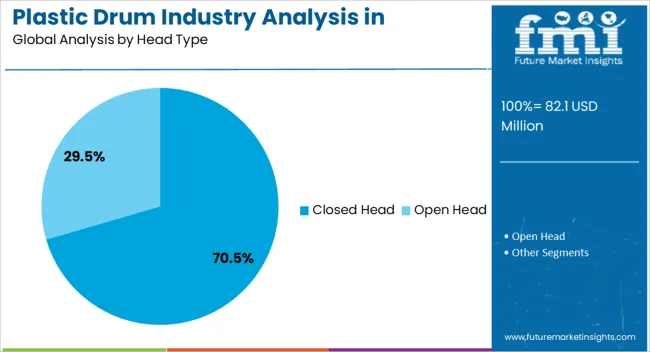
The closed head segment leads the head type category with approximately 70.5% share, supported by its effectiveness in securing liquids and semi-liquids during transport and storage. Closed head designs offer enhanced leak resistance, tamper-proof sealing, and durability under pressure, making them ideal for hazardous materials and sensitive products.

The segment benefits from widespread adoption in chemical, petrochemical, and food-grade applications where product integrity is critical. Manufacturing advancements in drum molding have improved precision in closed head designs, reinforcing their reliability.

With industries demanding high safety assurance in logistics, the closed head segment is projected to maintain its dominant position in Malaysia’s plastic drum market.

Top Dynamics and Industry Trends Shaping the Malaysia Plastic Drum Market

Rising Need for Oleochemicals in Malaysia Boosting Plastic Drum Demand

Malaysia is currently supplying around 20% of the world's oleochemical capacity, and is a leading producer as well as user of oleochemicals. The country’s oleo chemical sector grew significantly in 2025, with exports amounting to USD 7.7 billion.

The growing usage of oleochemicals is important in several applications like cosmetics and personal care which is a key factor driving this demand spike. In order to meet this demand, oleochemical manufacturers are increasing derivative and value-added capacity, thereby gaining a bigger portion of the value chain.

As Malaysia solidifies its position as one of the world's primary oleochemical producers and exporters, the plastic packaging sector is subjected to gain benefit from the same. The need for efficient storage and transportation of oleo chemicals, coupled with the country’s significant role in this sector, is set to drive demand for HDPE and PET drums from 2025 to 2035.

Malaysia's Free Trade Agreements Opening Doors for Development

Malaysia is one of the 15 signatory nations of the Regional Comprehensive Economic Partnership (RCEP), a significant free trade agreement. In this agreement, the country holds a key position representing 30% of the global population and GDP, which is further expected to increase up to 50% by 2035.

Malaysia currently holds 16 Free Trade Agreements (FTAs), with the potential size extending up to USD 3.3 billion people. The nation has signed bilateral FTAs with key players like Japan, Pakistan, India, New Zealand, Chile, Australia, and Türkiye. These ties will flourish the trading between Malaysia and other countries, resulting in more requirements for packaging solutions like HDPE and PET drums for efficient transportation.

Industrial-grade containers like HDPE drums that are lightweight and cost-effective are being widely used for transportation and shipping of bulk materials. The drums also comply with the UN regulations for packaging hazardous materials, making these safe for shipping.

The widespread applications of PET and HDPE drums across different sectors supported by the free trade agreements are set to create opportunities for expansion. Similarly, favorable government policies will benefit the sector through 2035.

Increasing Plastic Pollution Limiting Growth

Several factors are negatively impacting the target sector. These include increasing plastic pollution levels, growing environmental concerns, and implementation of stringent regulations.

Challenges in plastic waste management impact the overall sustainability of HDPE drums. These include insufficient quality of local plastic waste, limited recycling capacity, and a lack of alternative end-of-life solutions.

The absence of macro data to monitor plastic production, consumption, waste collection, and materials recovery hampers informed decision-making and strategic planning for the industry. This can be addressed by providing fully recyclable and biodegradable drums that can fulfill these circular economy goals.

Comparison of Historical vs Future Outlook on Changing Consumer Trends for Malaysia Plastic Drum Industry

Plastic drum sales in Malaysia recorded a sluggish CAGR of 1.9% during the historical period between 2020 and 2025. The total size of the country reached around USD 82.1 million at the end of 2025.

The outbreak of the COVID-19 pandemic resulted in worldwide lockdowns and a halt in import-export activities. This, in turn, reduced the demand for packaging solutions, especially large industrial-grade drums.

The Malaysian government also implemented regulations to limit the usage of plastic products. This encouraged industries to opt for sustainable or reusable packaging alternatives like IBC tanks or metal drums.

The future plastic drum industry forecast looks bright in Malaysia. This is attributable to growing demand for safe and secure packaging solutions across several industries.

The target sector in Malaysia will have a moderate growth rate in the future. Increasing adoption of HDPE drums across industries like chemicals, pharmaceuticals, industrial chemicals, and food and beverages.

HDPE and PET drums meet the requirements of chemical and pharmaceutical manufacturers. This is due to lightweight, durable, and cost-efficient features of these rigid packaging solutions. Government norms for the adoption of biodegradable materials are anticipated to positively impact the plastic drum industry's growth.

Plastic drums are generally not reactive to the materials, such as chemicals, oils, and lubricants present inside. As a result, these are often used for storing and transporting a wide variety of chemicals and other products.

The increasing demand for packaged food will further boost growth of plastic drum sector in the country. Similarly, advances in recycling and biodegradable packaging are anticipated to benefit manufacturers.

Analysis of Key Sub-regions Producing, Certifying, Distributing, and Using Plastic Drums in Malaysia

The section below covers the future forecast for HDPE and PET drums in sub-regions of Malaysia. Information on key sub-regions of the country, including southern, northern, east, and others, is provided in this section. The central part of Malaysia leads the sector with the topmost share. Southern Peninsula is projected to witness a prominent CAGR of 3.3% through 2035.

Sub-region Value CAGR 2025 to 2035
Southern Peninsula 3.3%
East Coast 2.9%
Northern Peninsula 2.5%

Southern Malaysia Remains at the Epicenter of Growth

Southern Malaysia is becoming a manufacturing hub for plastic industry due to presence of several manufacturing companies for various products. The region has a favorable business environment for the drum industry to rise.

Increasing export of various goods, especially in packaging formats like drums, is set to boost growth. Similarly, the booming food and beverage, healthcare, and personal care industries are anticipated to create opportunities for growth.

East Coast to Witness Substantial Growth

East Coast is going through a transformation and witnessing significant industrial development. The region has the presence of petrochemical companies and refineries which is generating a substantial demand for plastic drums.

The East Coast region has several ports that are used for international trading. Plastic packaging solutions like drums are commonly used for shipping. Hence, developed ports in the region will lead to a steady demand for HDPE and PET drums.

Initiatives taken by governments, such as the formation of the East Coast Economic Region (ECER), are anticipated to create opportunities for plastic drum manufacturers. As a result, the East Coast is predicted to register a CAGR of 2.9% from 2025 to 2035.

Northern Peninsula to Create Lucrative Prospects for Manufacturers

The Northern Peninsula is poised to record a CAGR of 2.5% between 2025 and 2035. This is attributable to thriving chemical sector and growing demand for cost-effective packaging solutions.

HDPE and PET drums are widely employed for storing and transporting several chemicals, including resins, solvents, and industrial cleaners. As the demand for these chemicals continues to surge in the Northern Peninsula, so will sales of plastic drums.

Malaysia Plastic Drum Industry Analysis by Top Investment Segments

The section contains information about the leading segments in Malaysia. HDPE drums currently hold 91.3% of value share in 2025, fueled by widespread adoption across diverse sectors. Plastic drums with closed ends are set to dominate the sector, accounting for a value share of 70.5% in 2025. On the other hand, demand for open-top plastic drums in Malaysia is set to increase significantly through 2035.

HDPE to be Ideal for Manufacturing Drums due to Unique Properties

Segment HDPE (Material)
Value Share (2025) 91.3%

HDPE remains preferred across Malaysia for manufacturing drums. This is attributable to several excellent properties, including high strength, versatility, corrosion resistance, lightweight, and cost-effectiveness.

Sales of HDPE drums in Malaysia are projected to total USD 105.1 million in 2035, accounting for a value share of 88%. Further, a CAGR of 5.7% has been estimated for the target segment between 2025 and 2035.

HDPE drums have high molecular weight and density, which makes these suitable for transportation and shipping of various materials. The inertness and resistance to different PH levels make these suitable for a variety of hazardous and non-hazardous chemicals.

HDPE drums fulfill the regulations and standards required for shipping and warehousing. The strength and protection provided by HDPE drums are boosting adoption. Hence, the target segment will likely retain its dominance through 2035.

Closed Head Remains Popular Type across Malaysia

Segment Close Head (Head Type)
Value Share (2025) 70.5%

Closed-head plastic drums currently account for over 70.5% of value share. Over the forecast period, demand for closed-head drums is projected to increase at 3.5%, propelled by high adoption on account of advantages like leak prevention, durability, and tamper-evident nature.

Closed-head drums are without a removable lid which completely seals the drum from both openings. These drums have two designated small openings for running the liquid materials, which are secured with a stopper. This sealing helps in secured transportation and storage of liquid materials.

Closed-head drums help to easily fill and remove liquids without product spillage. Such packaging solutions work well with oil, chemicals, and beverages of large quality, leading to the segment’s dominance in Malaysia.
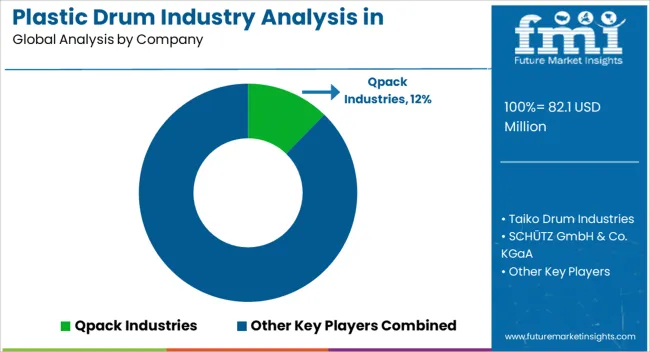
Key Malaysia Plastic Drum Market Players and Concentration

Plastic Drum Industry Analysis In Malaysia Analysis By Company

The plastic drum industry in Malaysia is becoming competitive, with Tier 1 players accounting for 40% to 55% of the total share. A wide range of strategies, including new product launches and innovative facility establishments are adopted by leading producers of plastic drums in Malaysia to succeed.

With sustainability taking center stage, key manufacturers are focusing on using recycled materials in novel products to woo eco-conscious customers. Several companies are also innovating to develop drums that are more efficient, durable, or stackable.

Certain plastic drum companies in Malaysia are utilizing novel manufacturing technologies to reduce product costs and enhance quality. Implementing strategies like partnerships, mergers, acquisitions, and collaborations are also becoming common among Malaysian drum suppliers and manufacturers. Few of the leading companies are focusing on joining hands with government agencies to provide industries with sustainable drums to reduce carbon footprint.

Industry Updates

  • In April 2025, Grief Malaysia strengthened its global presence with a new IBC manufacturing facility in Malaysia.
  • In March 2025, United States-based Grief, Inc. completed the acquisition of Ipackchem Group SAS. This will help the company to further broaden as a global leader in high-performance small plastic containers and jerrycans. Also, the company focuses on strengthening presence in nations like India, Malaysia, and Thailand.

Leading Suppliers of Plastic Drums in Malaysia

  • Qpack Industries
  • Taiko Drum Industries
  • SCHÜTZ GmbH & Co. KGaA
  • Mauser Packaging Solutions
  • Greif Malaysia
  • Time Technoplast Ltd
  • TPL Plastech Limited
  • Mapo Industries Sdn Bhd
  • TEGS Asia Sdn Bhd
  • Ralco Corporation Bhd
  • FT Hardware Sdn Bhd
  • MISUMI Malaysia Sdn. Bhd

Top Segments Studied in the Malaysia Plastic Drum Market Report

By Material:

On the basis of material, the sector is segregated into HDPE and PET.

By Capacity:

In terms of capacity, the sector is divided into up to 210 liters and above 210 liters.

By Head Type:

Few of the important head types include open head and closed head.

By End Use:

By end-use, the target sector is segmented into cosmetic and perfumery, oleo chemicals, agrochemicals, industrial chemicals, pharmaceuticals, food and beverages, flavor and fragrances, petroleum and lubricants, and others (home care and personal care).

By Sub-region:

Malaysia is further categorized into Northern Peninsula, Southern Peninsula, Central, East Coast, and East Malaysia.

Frequently Asked Questions

How big is the plastic drum industry analysis in Malaysia in 2025?

The global plastic drum industry analysis in Malaysia is estimated to be valued at USD 82.1 million in 2025.

What will be the size of plastic drum industry analysis in Malaysia in 2035?

The market size for the plastic drum industry analysis in Malaysia is projected to reach USD 105.1 million by 2035.

How much will be the plastic drum industry analysis in Malaysia growth between 2025 and 2035?

The plastic drum industry analysis in Malaysia is expected to grow at a 2.5% CAGR between 2025 and 2035.

What are the key product types in the plastic drum industry analysis in malaysia?

The key product types in plastic drum industry analysis in Malaysia are hdpe and pet.

Which capacity segment to contribute significant share in the plastic drum industry analysis in Malaysia in 2025?

In terms of capacity, above 210 liters segment to command 88.6% share in the plastic drum industry analysis in Malaysia in 2025.

Table of Content

  1. Executive Summary
    • Global Market Outlook
    • Demand-side Trends
    • Supply-side Trends
    • Technology Roadmap Analysis
    • Analysis and Recommendations
  2. Market Overview
    • Market Coverage / Taxonomy
    • Market Definition / Scope / Limitations
  3. Market Background
    • Market Dynamics
      • Drivers
      • Restraints
      • Opportunity
      • Trends
    • Scenario Forecast
      • Demand in Optimistic Scenario
      • Demand in Likely Scenario
      • Demand in Conservative Scenario
    • Opportunity Map Analysis
    • Product Life Cycle Analysis
    • Supply Chain Analysis
    • Investment Feasibility Matrix
    • Value Chain Analysis
    • PESTLE and Porter’s Analysis
    • Regulatory Landscape
    • Regional Parent Market Outlook
    • Production and Consumption Statistics
    • Import and Export Statistics
  4. Global Industry Analysis in Malaysia Analysis 2020 to 2024 and Forecast, 2025 to 2035
    • Historical Market Size Value (USD Million) Analysis, 2020 to 2024
    • Current and Future Market Size Value (USD Million) Projections, 2025 to 2035
      • Y-o-Y Growth Trend Analysis
      • Absolute $ Opportunity Analysis
  5. Global Industry Analysis in Malaysia Pricing Analysis 2020 to 2024 and Forecast 2025 to 2035
  6. Global Industry Analysis in Malaysia Analysis 2020 to 2024 and Forecast 2025 to 2035, By Material
    • Introduction / Key Findings
    • Historical Market Size Value (USD Million) Analysis By Material , 2020 to 2024
    • Current and Future Market Size Value (USD Million) Analysis and Forecast By Material , 2025 to 2035
      • HDPE
      • PET
    • Y-o-Y Growth Trend Analysis By Material , 2020 to 2024
    • Absolute $ Opportunity Analysis By Material , 2025 to 2035
  7. Global Industry Analysis in Malaysia Analysis 2020 to 2024 and Forecast 2025 to 2035, By Capacity
    • Introduction / Key Findings
    • Historical Market Size Value (USD Million) Analysis By Capacity, 2020 to 2024
    • Current and Future Market Size Value (USD Million) Analysis and Forecast By Capacity, 2025 to 2035
      • Above 210 Liters
      • Up To 210 Liters
    • Y-o-Y Growth Trend Analysis By Capacity, 2020 to 2024
    • Absolute $ Opportunity Analysis By Capacity, 2025 to 2035
  8. Global Industry Analysis in Malaysia Analysis 2020 to 2024 and Forecast 2025 to 2035, By Head Type
    • Introduction / Key Findings
    • Historical Market Size Value (USD Million) Analysis By Head Type, 2020 to 2024
    • Current and Future Market Size Value (USD Million) Analysis and Forecast By Head Type, 2025 to 2035
      • Closed Head
      • Open Head
    • Y-o-Y Growth Trend Analysis By Head Type, 2020 to 2024
    • Absolute $ Opportunity Analysis By Head Type, 2025 to 2035
  9. Global Industry Analysis in Malaysia Analysis 2020 to 2024 and Forecast 2025 to 2035, By End Use
    • Introduction / Key Findings
    • Historical Market Size Value (USD Million) Analysis By End Use, 2020 to 2024
    • Current and Future Market Size Value (USD Million) Analysis and Forecast By End Use, 2025 to 2035
      • Industrial Chemicals
      • Cosmetic And Perfumery
      • Oleo Chemicals
      • Agrochemicals
      • Pharmaceuticals
      • Food & Beverages
      • Flavor & Fragrances
      • Petroleum & Lubricants
      • Others (Homecare & Personal Care)
    • Y-o-Y Growth Trend Analysis By End Use, 2020 to 2024
    • Absolute $ Opportunity Analysis By End Use, 2025 to 2035
  10. Global Industry Analysis in Malaysia Analysis 2020 to 2024 and Forecast 2025 to 2035, By Region
    • Introduction
    • Historical Market Size Value (USD Million) Analysis By Region, 2020 to 2024
    • Current Market Size Value (USD Million) Analysis and Forecast By Region, 2025 to 2035
      • North America
      • Latin America
      • Western Europe
      • Eastern Europe
      • East Asia
      • South Asia and Pacific
      • Middle East & Africa
    • Market Attractiveness Analysis By Region
  11. North America Industry Analysis in Malaysia Analysis 2020 to 2024 and Forecast 2025 to 2035, By Country
    • Historical Market Size Value (USD Million) Trend Analysis By Market Taxonomy, 2020 to 2024
    • Market Size Value (USD Million) Forecast By Market Taxonomy, 2025 to 2035
      • By Country
        • USA
        • Canada
        • Mexico
      • By Material
      • By Capacity
      • By Head Type
      • By End Use
    • Market Attractiveness Analysis
      • By Country
      • By Material
      • By Capacity
      • By Head Type
      • By End Use
    • Key Takeaways
  12. Latin America Industry Analysis in Malaysia Analysis 2020 to 2024 and Forecast 2025 to 2035, By Country
    • Historical Market Size Value (USD Million) Trend Analysis By Market Taxonomy, 2020 to 2024
    • Market Size Value (USD Million) Forecast By Market Taxonomy, 2025 to 2035
      • By Country
        • Brazil
        • Chile
        • Rest of Latin America
      • By Material
      • By Capacity
      • By Head Type
      • By End Use
    • Market Attractiveness Analysis
      • By Country
      • By Material
      • By Capacity
      • By Head Type
      • By End Use
    • Key Takeaways
  13. Western Europe Industry Analysis in Malaysia Analysis 2020 to 2024 and Forecast 2025 to 2035, By Country
    • Historical Market Size Value (USD Million) Trend Analysis By Market Taxonomy, 2020 to 2024
    • Market Size Value (USD Million) Forecast By Market Taxonomy, 2025 to 2035
      • By Country
        • Germany
        • UK
        • Italy
        • Spain
        • France
        • Nordic
        • BENELUX
        • Rest of Western Europe
      • By Material
      • By Capacity
      • By Head Type
      • By End Use
    • Market Attractiveness Analysis
      • By Country
      • By Material
      • By Capacity
      • By Head Type
      • By End Use
    • Key Takeaways
  14. Eastern Europe Industry Analysis in Malaysia Analysis 2020 to 2024 and Forecast 2025 to 2035, By Country
    • Historical Market Size Value (USD Million) Trend Analysis By Market Taxonomy, 2020 to 2024
    • Market Size Value (USD Million) Forecast By Market Taxonomy, 2025 to 2035
      • By Country
        • Russia
        • Poland
        • Hungary
        • Balkan & Baltic
        • Rest of Eastern Europe
      • By Material
      • By Capacity
      • By Head Type
      • By End Use
    • Market Attractiveness Analysis
      • By Country
      • By Material
      • By Capacity
      • By Head Type
      • By End Use
    • Key Takeaways
  15. East Asia Industry Analysis in Malaysia Analysis 2020 to 2024 and Forecast 2025 to 2035, By Country
    • Historical Market Size Value (USD Million) Trend Analysis By Market Taxonomy, 2020 to 2024
    • Market Size Value (USD Million) Forecast By Market Taxonomy, 2025 to 2035
      • By Country
        • China
        • Japan
        • South Korea
      • By Material
      • By Capacity
      • By Head Type
      • By End Use
    • Market Attractiveness Analysis
      • By Country
      • By Material
      • By Capacity
      • By Head Type
      • By End Use
    • Key Takeaways
  16. South Asia and Pacific Industry Analysis in Malaysia Analysis 2020 to 2024 and Forecast 2025 to 2035, By Country
    • Historical Market Size Value (USD Million) Trend Analysis By Market Taxonomy, 2020 to 2024
    • Market Size Value (USD Million) Forecast By Market Taxonomy, 2025 to 2035
      • By Country
        • India
        • ASEAN
        • Australia & New Zealand
        • Rest of South Asia and Pacific
      • By Material
      • By Capacity
      • By Head Type
      • By End Use
    • Market Attractiveness Analysis
      • By Country
      • By Material
      • By Capacity
      • By Head Type
      • By End Use
    • Key Takeaways
  17. Middle East & Africa Industry Analysis in Malaysia Analysis 2020 to 2024 and Forecast 2025 to 2035, By Country
    • Historical Market Size Value (USD Million) Trend Analysis By Market Taxonomy, 2020 to 2024
    • Market Size Value (USD Million) Forecast By Market Taxonomy, 2025 to 2035
      • By Country
        • Kingdom of Saudi Arabia
        • Other GCC Countries
        • Turkiye
        • South Africa
        • Other African Union
        • Rest of Middle East & Africa
      • By Material
      • By Capacity
      • By Head Type
      • By End Use
    • Market Attractiveness Analysis
      • By Country
      • By Material
      • By Capacity
      • By Head Type
      • By End Use
    • Key Takeaways
  18. Key Countries Industry Analysis in Malaysia Analysis
    • USA
      • Pricing Analysis
      • Market Share Analysis, 2024
        • By Material
        • By Capacity
        • By Head Type
        • By End Use
    • Canada
      • Pricing Analysis
      • Market Share Analysis, 2024
        • By Material
        • By Capacity
        • By Head Type
        • By End Use
    • Mexico
      • Pricing Analysis
      • Market Share Analysis, 2024
        • By Material
        • By Capacity
        • By Head Type
        • By End Use
    • Brazil
      • Pricing Analysis
      • Market Share Analysis, 2024
        • By Material
        • By Capacity
        • By Head Type
        • By End Use
    • Chile
      • Pricing Analysis
      • Market Share Analysis, 2024
        • By Material
        • By Capacity
        • By Head Type
        • By End Use
    • Germany
      • Pricing Analysis
      • Market Share Analysis, 2024
        • By Material
        • By Capacity
        • By Head Type
        • By End Use
    • UK
      • Pricing Analysis
      • Market Share Analysis, 2024
        • By Material
        • By Capacity
        • By Head Type
        • By End Use
    • Italy
      • Pricing Analysis
      • Market Share Analysis, 2024
        • By Material
        • By Capacity
        • By Head Type
        • By End Use
    • Spain
      • Pricing Analysis
      • Market Share Analysis, 2024
        • By Material
        • By Capacity
        • By Head Type
        • By End Use
    • France
      • Pricing Analysis
      • Market Share Analysis, 2024
        • By Material
        • By Capacity
        • By Head Type
        • By End Use
    • India
      • Pricing Analysis
      • Market Share Analysis, 2024
        • By Material
        • By Capacity
        • By Head Type
        • By End Use
    • ASEAN
      • Pricing Analysis
      • Market Share Analysis, 2024
        • By Material
        • By Capacity
        • By Head Type
        • By End Use
    • Australia & New Zealand
      • Pricing Analysis
      • Market Share Analysis, 2024
        • By Material
        • By Capacity
        • By Head Type
        • By End Use
    • China
      • Pricing Analysis
      • Market Share Analysis, 2024
        • By Material
        • By Capacity
        • By Head Type
        • By End Use
    • Japan
      • Pricing Analysis
      • Market Share Analysis, 2024
        • By Material
        • By Capacity
        • By Head Type
        • By End Use
    • South Korea
      • Pricing Analysis
      • Market Share Analysis, 2024
        • By Material
        • By Capacity
        • By Head Type
        • By End Use
    • Russia
      • Pricing Analysis
      • Market Share Analysis, 2024
        • By Material
        • By Capacity
        • By Head Type
        • By End Use
    • Poland
      • Pricing Analysis
      • Market Share Analysis, 2024
        • By Material
        • By Capacity
        • By Head Type
        • By End Use
    • Hungary
      • Pricing Analysis
      • Market Share Analysis, 2024
        • By Material
        • By Capacity
        • By Head Type
        • By End Use
    • Kingdom of Saudi Arabia
      • Pricing Analysis
      • Market Share Analysis, 2024
        • By Material
        • By Capacity
        • By Head Type
        • By End Use
    • Turkiye
      • Pricing Analysis
      • Market Share Analysis, 2024
        • By Material
        • By Capacity
        • By Head Type
        • By End Use
    • South Africa
      • Pricing Analysis
      • Market Share Analysis, 2024
        • By Material
        • By Capacity
        • By Head Type
        • By End Use
  19. Market Structure Analysis
    • Competition Dashboard
    • Competition Benchmarking
    • Market Share Analysis of Top Players
      • By Regional
      • By Material
      • By Capacity
      • By Head Type
      • By End Use
  20. Competition Analysis
    • Competition Deep Dive
      • Qpack Industries
        • Overview
        • Product Portfolio
        • Profitability by Market Segments (Product/Age /Sales Channel/Region)
        • Sales Footprint
        • Strategy Overview
          • Marketing Strategy
          • Product Strategy
          • Channel Strategy
      • Taiko Drum Industries
      • SCHÜTZ GmbH & Co. KGaA
      • Mauser Packaging Solutions
      • Greif Malaysia
      • Time Technoplast Ltd
      • TPL Plastech Limited
  21. Assumptions & Acronyms Used
  22. Research Methodology

List of Tables

  • Table 1: Global Industry Analysis in Malaysia Value (USD Million) Forecast by Region, 2020 to 2035
  • Table 2: Global Industry Analysis in Malaysia Value (USD Million) Forecast by Material , 2020 to 2035
  • Table 3: Global Industry Analysis in Malaysia Value (USD Million) Forecast by Capacity, 2020 to 2035
  • Table 4: Global Industry Analysis in Malaysia Value (USD Million) Forecast by Head Type, 2020 to 2035
  • Table 5: Global Industry Analysis in Malaysia Value (USD Million) Forecast by End Use, 2020 to 2035
  • Table 6: North America Industry Analysis in Malaysia Value (USD Million) Forecast by Country, 2020 to 2035
  • Table 7: North America Industry Analysis in Malaysia Value (USD Million) Forecast by Material , 2020 to 2035
  • Table 8: North America Industry Analysis in Malaysia Value (USD Million) Forecast by Capacity, 2020 to 2035
  • Table 9: North America Industry Analysis in Malaysia Value (USD Million) Forecast by Head Type, 2020 to 2035
  • Table 10: North America Industry Analysis in Malaysia Value (USD Million) Forecast by End Use, 2020 to 2035
  • Table 11: Latin America Industry Analysis in Malaysia Value (USD Million) Forecast by Country, 2020 to 2035
  • Table 12: Latin America Industry Analysis in Malaysia Value (USD Million) Forecast by Material , 2020 to 2035
  • Table 13: Latin America Industry Analysis in Malaysia Value (USD Million) Forecast by Capacity, 2020 to 2035
  • Table 14: Latin America Industry Analysis in Malaysia Value (USD Million) Forecast by Head Type, 2020 to 2035
  • Table 15: Latin America Industry Analysis in Malaysia Value (USD Million) Forecast by End Use, 2020 to 2035
  • Table 16: Western Europe Industry Analysis in Malaysia Value (USD Million) Forecast by Country, 2020 to 2035
  • Table 17: Western Europe Industry Analysis in Malaysia Value (USD Million) Forecast by Material , 2020 to 2035
  • Table 18: Western Europe Industry Analysis in Malaysia Value (USD Million) Forecast by Capacity, 2020 to 2035
  • Table 19: Western Europe Industry Analysis in Malaysia Value (USD Million) Forecast by Head Type, 2020 to 2035
  • Table 20: Western Europe Industry Analysis in Malaysia Value (USD Million) Forecast by End Use, 2020 to 2035
  • Table 21: Eastern Europe Industry Analysis in Malaysia Value (USD Million) Forecast by Country, 2020 to 2035
  • Table 22: Eastern Europe Industry Analysis in Malaysia Value (USD Million) Forecast by Material , 2020 to 2035
  • Table 23: Eastern Europe Industry Analysis in Malaysia Value (USD Million) Forecast by Capacity, 2020 to 2035
  • Table 24: Eastern Europe Industry Analysis in Malaysia Value (USD Million) Forecast by Head Type, 2020 to 2035
  • Table 25: Eastern Europe Industry Analysis in Malaysia Value (USD Million) Forecast by End Use, 2020 to 2035
  • Table 26: East Asia Industry Analysis in Malaysia Value (USD Million) Forecast by Country, 2020 to 2035
  • Table 27: East Asia Industry Analysis in Malaysia Value (USD Million) Forecast by Material , 2020 to 2035
  • Table 28: East Asia Industry Analysis in Malaysia Value (USD Million) Forecast by Capacity, 2020 to 2035
  • Table 29: East Asia Industry Analysis in Malaysia Value (USD Million) Forecast by Head Type, 2020 to 2035
  • Table 30: East Asia Industry Analysis in Malaysia Value (USD Million) Forecast by End Use, 2020 to 2035
  • Table 31: South Asia and Pacific Industry Analysis in Malaysia Value (USD Million) Forecast by Country, 2020 to 2035
  • Table 32: South Asia and Pacific Industry Analysis in Malaysia Value (USD Million) Forecast by Material , 2020 to 2035
  • Table 33: South Asia and Pacific Industry Analysis in Malaysia Value (USD Million) Forecast by Capacity, 2020 to 2035
  • Table 34: South Asia and Pacific Industry Analysis in Malaysia Value (USD Million) Forecast by Head Type, 2020 to 2035
  • Table 35: South Asia and Pacific Industry Analysis in Malaysia Value (USD Million) Forecast by End Use, 2020 to 2035
  • Table 36: Middle East & Africa Industry Analysis in Malaysia Value (USD Million) Forecast by Country, 2020 to 2035
  • Table 37: Middle East & Africa Industry Analysis in Malaysia Value (USD Million) Forecast by Material , 2020 to 2035
  • Table 38: Middle East & Africa Industry Analysis in Malaysia Value (USD Million) Forecast by Capacity, 2020 to 2035
  • Table 39: Middle East & Africa Industry Analysis in Malaysia Value (USD Million) Forecast by Head Type, 2020 to 2035
  • Table 40: Middle East & Africa Industry Analysis in Malaysia Value (USD Million) Forecast by End Use, 2020 to 2035

List of Figures

  • Figure 1: Global Industry Analysis in Malaysia Pricing Analysis
  • Figure 2: Global Industry Analysis in Malaysia Value (USD Million) Forecast 2020 to 2035
  • Figure 3: Global Industry Analysis in Malaysia Value Share and BPS Analysis by Material , 2025 and 2035
  • Figure 4: Global Industry Analysis in Malaysia Y-o-Y Growth Comparison by Material , 2025 to 2035
  • Figure 5: Global Industry Analysis in Malaysia Attractiveness Analysis by Material
  • Figure 6: Global Industry Analysis in Malaysia Value Share and BPS Analysis by Capacity, 2025 and 2035
  • Figure 7: Global Industry Analysis in Malaysia Y-o-Y Growth Comparison by Capacity, 2025 to 2035
  • Figure 8: Global Industry Analysis in Malaysia Attractiveness Analysis by Capacity
  • Figure 9: Global Industry Analysis in Malaysia Value Share and BPS Analysis by Head Type, 2025 and 2035
  • Figure 10: Global Industry Analysis in Malaysia Y-o-Y Growth Comparison by Head Type, 2025 to 2035
  • Figure 11: Global Industry Analysis in Malaysia Attractiveness Analysis by Head Type
  • Figure 12: Global Industry Analysis in Malaysia Value Share and BPS Analysis by End Use, 2025 and 2035
  • Figure 13: Global Industry Analysis in Malaysia Y-o-Y Growth Comparison by End Use, 2025 to 2035
  • Figure 14: Global Industry Analysis in Malaysia Attractiveness Analysis by End Use
  • Figure 15: Global Industry Analysis in Malaysia Value (USD Million) Share and BPS Analysis by Region, 2025 and 2035
  • Figure 16: Global Industry Analysis in Malaysia Y-o-Y Growth Comparison by Region, 2025 to 2035
  • Figure 17: Global Industry Analysis in Malaysia Attractiveness Analysis by Region
  • Figure 18: North America Industry Analysis in Malaysia Incremental Dollar Opportunity, 2025 to 2035
  • Figure 19: Latin America Industry Analysis in Malaysia Incremental Dollar Opportunity, 2025 to 2035
  • Figure 20: Western Europe Industry Analysis in Malaysia Incremental Dollar Opportunity, 2025 to 2035
  • Figure 21: Eastern Europe Industry Analysis in Malaysia Incremental Dollar Opportunity, 2025 to 2035
  • Figure 22: East Asia Industry Analysis in Malaysia Incremental Dollar Opportunity, 2025 to 2035
  • Figure 23: South Asia and Pacific Industry Analysis in Malaysia Incremental Dollar Opportunity, 2025 to 2035
  • Figure 24: Middle East & Africa Industry Analysis in Malaysia Incremental Dollar Opportunity, 2025 to 2035
  • Figure 25: North America Industry Analysis in Malaysia Value Share and BPS Analysis by Country, 2025 and 2035
  • Figure 26: North America Industry Analysis in Malaysia Value Share and BPS Analysis by Material , 2025 and 2035
  • Figure 27: North America Industry Analysis in Malaysia Y-o-Y Growth Comparison by Material , 2025 to 2035
  • Figure 28: North America Industry Analysis in Malaysia Attractiveness Analysis by Material
  • Figure 29: North America Industry Analysis in Malaysia Value Share and BPS Analysis by Capacity, 2025 and 2035
  • Figure 30: North America Industry Analysis in Malaysia Y-o-Y Growth Comparison by Capacity, 2025 to 2035
  • Figure 31: North America Industry Analysis in Malaysia Attractiveness Analysis by Capacity
  • Figure 32: North America Industry Analysis in Malaysia Value Share and BPS Analysis by Head Type, 2025 and 2035
  • Figure 33: North America Industry Analysis in Malaysia Y-o-Y Growth Comparison by Head Type, 2025 to 2035
  • Figure 34: North America Industry Analysis in Malaysia Attractiveness Analysis by Head Type
  • Figure 35: North America Industry Analysis in Malaysia Value Share and BPS Analysis by End Use, 2025 and 2035
  • Figure 36: North America Industry Analysis in Malaysia Y-o-Y Growth Comparison by End Use, 2025 to 2035
  • Figure 37: North America Industry Analysis in Malaysia Attractiveness Analysis by End Use
  • Figure 38: Latin America Industry Analysis in Malaysia Value Share and BPS Analysis by Country, 2025 and 2035
  • Figure 39: Latin America Industry Analysis in Malaysia Value Share and BPS Analysis by Material , 2025 and 2035
  • Figure 40: Latin America Industry Analysis in Malaysia Y-o-Y Growth Comparison by Material , 2025 to 2035
  • Figure 41: Latin America Industry Analysis in Malaysia Attractiveness Analysis by Material
  • Figure 42: Latin America Industry Analysis in Malaysia Value Share and BPS Analysis by Capacity, 2025 and 2035
  • Figure 43: Latin America Industry Analysis in Malaysia Y-o-Y Growth Comparison by Capacity, 2025 to 2035
  • Figure 44: Latin America Industry Analysis in Malaysia Attractiveness Analysis by Capacity
  • Figure 45: Latin America Industry Analysis in Malaysia Value Share and BPS Analysis by Head Type, 2025 and 2035
  • Figure 46: Latin America Industry Analysis in Malaysia Y-o-Y Growth Comparison by Head Type, 2025 to 2035
  • Figure 47: Latin America Industry Analysis in Malaysia Attractiveness Analysis by Head Type
  • Figure 48: Latin America Industry Analysis in Malaysia Value Share and BPS Analysis by End Use, 2025 and 2035
  • Figure 49: Latin America Industry Analysis in Malaysia Y-o-Y Growth Comparison by End Use, 2025 to 2035
  • Figure 50: Latin America Industry Analysis in Malaysia Attractiveness Analysis by End Use
  • Figure 51: Western Europe Industry Analysis in Malaysia Value Share and BPS Analysis by Country, 2025 and 2035
  • Figure 52: Western Europe Industry Analysis in Malaysia Value Share and BPS Analysis by Material , 2025 and 2035
  • Figure 53: Western Europe Industry Analysis in Malaysia Y-o-Y Growth Comparison by Material , 2025 to 2035
  • Figure 54: Western Europe Industry Analysis in Malaysia Attractiveness Analysis by Material
  • Figure 55: Western Europe Industry Analysis in Malaysia Value Share and BPS Analysis by Capacity, 2025 and 2035
  • Figure 56: Western Europe Industry Analysis in Malaysia Y-o-Y Growth Comparison by Capacity, 2025 to 2035
  • Figure 57: Western Europe Industry Analysis in Malaysia Attractiveness Analysis by Capacity
  • Figure 58: Western Europe Industry Analysis in Malaysia Value Share and BPS Analysis by Head Type, 2025 and 2035
  • Figure 59: Western Europe Industry Analysis in Malaysia Y-o-Y Growth Comparison by Head Type, 2025 to 2035
  • Figure 60: Western Europe Industry Analysis in Malaysia Attractiveness Analysis by Head Type
  • Figure 61: Western Europe Industry Analysis in Malaysia Value Share and BPS Analysis by End Use, 2025 and 2035
  • Figure 62: Western Europe Industry Analysis in Malaysia Y-o-Y Growth Comparison by End Use, 2025 to 2035
  • Figure 63: Western Europe Industry Analysis in Malaysia Attractiveness Analysis by End Use
  • Figure 64: Eastern Europe Industry Analysis in Malaysia Value Share and BPS Analysis by Country, 2025 and 2035
  • Figure 65: Eastern Europe Industry Analysis in Malaysia Value Share and BPS Analysis by Material , 2025 and 2035
  • Figure 66: Eastern Europe Industry Analysis in Malaysia Y-o-Y Growth Comparison by Material , 2025 to 2035
  • Figure 67: Eastern Europe Industry Analysis in Malaysia Attractiveness Analysis by Material
  • Figure 68: Eastern Europe Industry Analysis in Malaysia Value Share and BPS Analysis by Capacity, 2025 and 2035
  • Figure 69: Eastern Europe Industry Analysis in Malaysia Y-o-Y Growth Comparison by Capacity, 2025 to 2035
  • Figure 70: Eastern Europe Industry Analysis in Malaysia Attractiveness Analysis by Capacity
  • Figure 71: Eastern Europe Industry Analysis in Malaysia Value Share and BPS Analysis by Head Type, 2025 and 2035
  • Figure 72: Eastern Europe Industry Analysis in Malaysia Y-o-Y Growth Comparison by Head Type, 2025 to 2035
  • Figure 73: Eastern Europe Industry Analysis in Malaysia Attractiveness Analysis by Head Type
  • Figure 74: Eastern Europe Industry Analysis in Malaysia Value Share and BPS Analysis by End Use, 2025 and 2035
  • Figure 75: Eastern Europe Industry Analysis in Malaysia Y-o-Y Growth Comparison by End Use, 2025 to 2035
  • Figure 76: Eastern Europe Industry Analysis in Malaysia Attractiveness Analysis by End Use
  • Figure 77: East Asia Industry Analysis in Malaysia Value Share and BPS Analysis by Country, 2025 and 2035
  • Figure 78: East Asia Industry Analysis in Malaysia Value Share and BPS Analysis by Material , 2025 and 2035
  • Figure 79: East Asia Industry Analysis in Malaysia Y-o-Y Growth Comparison by Material , 2025 to 2035
  • Figure 80: East Asia Industry Analysis in Malaysia Attractiveness Analysis by Material
  • Figure 81: East Asia Industry Analysis in Malaysia Value Share and BPS Analysis by Capacity, 2025 and 2035
  • Figure 82: East Asia Industry Analysis in Malaysia Y-o-Y Growth Comparison by Capacity, 2025 to 2035
  • Figure 83: East Asia Industry Analysis in Malaysia Attractiveness Analysis by Capacity
  • Figure 84: East Asia Industry Analysis in Malaysia Value Share and BPS Analysis by Head Type, 2025 and 2035
  • Figure 85: East Asia Industry Analysis in Malaysia Y-o-Y Growth Comparison by Head Type, 2025 to 2035
  • Figure 86: East Asia Industry Analysis in Malaysia Attractiveness Analysis by Head Type
  • Figure 87: East Asia Industry Analysis in Malaysia Value Share and BPS Analysis by End Use, 2025 and 2035
  • Figure 88: East Asia Industry Analysis in Malaysia Y-o-Y Growth Comparison by End Use, 2025 to 2035
  • Figure 89: East Asia Industry Analysis in Malaysia Attractiveness Analysis by End Use
  • Figure 90: South Asia and Pacific Industry Analysis in Malaysia Value Share and BPS Analysis by Country, 2025 and 2035
  • Figure 91: South Asia and Pacific Industry Analysis in Malaysia Value Share and BPS Analysis by Material , 2025 and 2035
  • Figure 92: South Asia and Pacific Industry Analysis in Malaysia Y-o-Y Growth Comparison by Material , 2025 to 2035
  • Figure 93: South Asia and Pacific Industry Analysis in Malaysia Attractiveness Analysis by Material
  • Figure 94: South Asia and Pacific Industry Analysis in Malaysia Value Share and BPS Analysis by Capacity, 2025 and 2035
  • Figure 95: South Asia and Pacific Industry Analysis in Malaysia Y-o-Y Growth Comparison by Capacity, 2025 to 2035
  • Figure 96: South Asia and Pacific Industry Analysis in Malaysia Attractiveness Analysis by Capacity
  • Figure 97: South Asia and Pacific Industry Analysis in Malaysia Value Share and BPS Analysis by Head Type, 2025 and 2035
  • Figure 98: South Asia and Pacific Industry Analysis in Malaysia Y-o-Y Growth Comparison by Head Type, 2025 to 2035
  • Figure 99: South Asia and Pacific Industry Analysis in Malaysia Attractiveness Analysis by Head Type
  • Figure 100: South Asia and Pacific Industry Analysis in Malaysia Value Share and BPS Analysis by End Use, 2025 and 2035
  • Figure 101: South Asia and Pacific Industry Analysis in Malaysia Y-o-Y Growth Comparison by End Use, 2025 to 2035
  • Figure 102: South Asia and Pacific Industry Analysis in Malaysia Attractiveness Analysis by End Use
  • Figure 103: Middle East & Africa Industry Analysis in Malaysia Value Share and BPS Analysis by Country, 2025 and 2035
  • Figure 104: Middle East & Africa Industry Analysis in Malaysia Value Share and BPS Analysis by Material , 2025 and 2035
  • Figure 105: Middle East & Africa Industry Analysis in Malaysia Y-o-Y Growth Comparison by Material , 2025 to 2035
  • Figure 106: Middle East & Africa Industry Analysis in Malaysia Attractiveness Analysis by Material
  • Figure 107: Middle East & Africa Industry Analysis in Malaysia Value Share and BPS Analysis by Capacity, 2025 and 2035
  • Figure 108: Middle East & Africa Industry Analysis in Malaysia Y-o-Y Growth Comparison by Capacity, 2025 to 2035
  • Figure 109: Middle East & Africa Industry Analysis in Malaysia Attractiveness Analysis by Capacity
  • Figure 110: Middle East & Africa Industry Analysis in Malaysia Value Share and BPS Analysis by Head Type, 2025 and 2035
  • Figure 111: Middle East & Africa Industry Analysis in Malaysia Y-o-Y Growth Comparison by Head Type, 2025 to 2035
  • Figure 112: Middle East & Africa Industry Analysis in Malaysia Attractiveness Analysis by Head Type
  • Figure 113: Middle East & Africa Industry Analysis in Malaysia Value Share and BPS Analysis by End Use, 2025 and 2035
  • Figure 114: Middle East & Africa Industry Analysis in Malaysia Y-o-Y Growth Comparison by End Use, 2025 to 2035
  • Figure 115: Middle East & Africa Industry Analysis in Malaysia Attractiveness Analysis by End Use
  • Figure 116: Global Industry Analysis in Malaysia – Tier Structure Analysis
  • Figure 117: Global Industry Analysis in Malaysia – Company Share Analysis
Dashboard
Dashboard
Dashboard
Dashboard
Dashboard
Dashboard

Full Research Suite comprises of:

Market outlook & trends analysis

Market outlook & trends analysis

Interviews & case studies

Interviews & case studies

Strategic recommendations

Strategic recommendations

Vendor profiles & capabilities analysis

Vendor profiles & capabilities analysis

5-year forecasts

5-year forecasts

8 regions and 60+ country-level data splits

8 regions and 60+ country-level data splits

Market segment data splits

Market segment data splits

12 months of continuous data updates

12 months of continuous data updates

DELIVERED AS:

PDF EXCEL ONLINE

Full Research Suite


$5000

$7500

$10000

Buy Report Now
Similar Industry Reports

Similar Industry Reports

Plastic Gears Market

Plastic Gears Market Size and Share Forecast Outlook 2025 to 2035

Plastic Additive Market

Plastic Additive Market Size and Share Forecast Outlook 2025 to 2035

Plastic Market
Plastic Market

Plastic Market Size and Share Forecast Outlook 2025 to 2035

Plastic Vials and Ampoules Market

Plastic Vials and Ampoules Market Size and Share Forecast Outlook 2025 to 2035

Plastic Bottles Market

Plastic Bottles Market Size and Share Forecast Outlook 2025 to 2035

Plastic Rigid IBC Market

Plastic Rigid IBC Market Size and Share Forecast Outlook 2025 to 2035

Plastic Bag Market
Plastic Bag Market

Plastic Bag Market Size and Share Forecast Outlook 2025 to 2035

Plastic Dielectric Films Market

Plastic Dielectric Films Market Size and Share Forecast Outlook 2025 to 2035

Plastic Crates Market

Plastic Crates Market Size and Share Forecast Outlook 2025 to 2035

Plastic Transistors Market

Plastic Transistors Market Size and Share Forecast Outlook 2025 to 2035

Plastic Pallets Market

Plastic Pallets Market Size and Share Forecast Outlook 2025 to 2035

Plastics-To-Fuel (PTF) Market

Plastics-To-Fuel (PTF) Market Size and Share Forecast Outlook 2025 to 2035

Plastic Tumblers Market

Plastic Tumblers Market Size and Share Forecast Outlook 2025 to 2035

Plastic Fillers Market

Plastic Fillers Market Size and Share Forecast Outlook 2025 to 2035

Plastic Bathtub Market

Plastic Bathtub Market Size and Share Forecast Outlook 2025 to 2035

Plastic Fasteners Market

Plastic Fasteners Market Analysis by Product Type, End Use, and Region Forecast Through 2035

Plastic Caulk Tube Market

Plastic Caulk Tube Market: Global Industry Analysis 2020 to 2024 and Opportunity Assessment 2025 to 2035

Plastic Pails Market

Plastic Pails Market Growth - Demand & Forecast 2025 to 2035

Plastic Corrugated Sheets Market

Plastic Corrugated Sheets Market Insights - Growth & Forecast 2025 to 2035

Plastic Sterilization Trays Market

Plastic Sterilization Trays Market Growth - Size & Forecast 2025 to 2035

Future Market Insights

Plastic Drum Industry Analysis in Malaysia

Chat With MaRIA

Chat With

MaRIA

Hi There, I am MaRIA, Your Market Research Intelligence Assistant. How may I help you?