Plastic Cutlery Market
Market Insights on Plastic Cutlery covering sales outlook, demand forecast & up-to-date key trends
Plastic Cutlery Market By Product, Sales Channel, End User & Region - Forecast 2022-2032
Plastic Cutlery Market Overview (2022-2032)
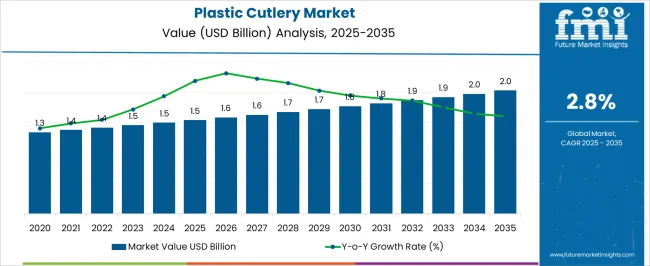
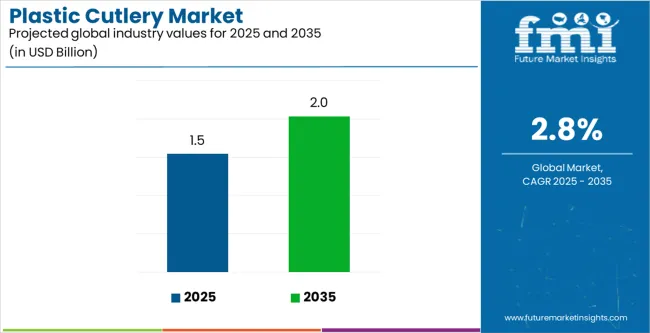
[250 Pages Report] The plastic cutlery market is projected to register a CAGR of 4% during the forecast period, up from US$ 1.6 Bn in 2021 to reach a valuation of US$ 2.47 Bn by 2032.
The plastic cutlery market is anticipated to show promising growth prospecs during the forecast period as a result of growing competition. New competitors are offering a variety of options at reasonable pricing to fulfil the demand for plastic cutlery making it more accessible to customers in the global plastic cutlery market.
Plastic cutlery is a one-time-use, throwaway item. Restaurants that carry meals to customers' homes, planes, and events, as well as camping and catering businesses and fast-food restaurants, employ them frequently. Boosting sales of plastic cutlery is due to being inexpensive, handy, and long-lasting for holding any food. Manufacturers are aided by the widespread availability of raw materials results in the sales of plastic cutlery.
Report Attribute |
Details |
Estimated Base Year Value (2021) |
US$ 1.6 Billion |
Expected Market Value (2022) |
US$ 1.67 Billion |
Anticipated Forecast Value (2032) |
US$ 2.47 Billion |
Projected Growth Rate (2022-2032) |
4% CAGR |
Gaining demand for plastic cutlery owing to its cost-effectiveness when compared to traditional silverware types such as wood and glass. They are both flexible and recyclable, reducing the environmental effect of plastic. Plastic cutlery comes in the form of forks, spoons, and knives and is lightweight and portable.
Sales of plastic cutlery are expected to rise significantly. In addition to this, demand for plastic cutlery is rising on account of US$ 1.95 Bn by 2026. Increasing demand for plastic cutlery is also projected to contribute to the growth of the plastic cutlery market share.
Manufacturers in the plastic cutlery market get a big platform from which to serve the whole demand for plastic cutlery. The worldwide plastic cutlery market is seeing increased competition. With growing competition, new competitors are offering a variety of options at reasonable pricing, fulfilling the demand for plastic cutlery more accessible to customers.
Sales of plastic cutlery are also rising due to its applications of being lightweight. It's simple to store, sanitary and appealing since it is available in a wide range of colours. Demand for plastic cutlery is high for outdoor events such as weddings, parties, meetings, and celebrations; thus, the sales of plastic cutlery are constantly growing.
Solia, Dart Container Corporation, Eco-Products, Inc., Fuling Global Inc., Biopac India Corporation Ltd., DOpla, TrueChoicePack Corporation, Lollicup USA Inc., Huhtamaki Oyj, Genpak LLC are some of the leading participants in the plastic cutlery market.
Let us know your requirement to get
100% FREE customization
What is the Key Growth to the Plastic Cutlery Market Share?
Foodservice disposables are increasing the sales of plastic cutlery due to the growing number of international quick-service restaurants (QSRs) across the world. Such food service establishments do not allocate money to the cleaning and upkeep of serving containers.
This aids chain operators in lowering labour expenses, consequently propelling the demand for plastic cutlery market forward. In the food and beverage industry, there has been a dynamic movement in customer consumption patterns.
Online meal delivery systems in growing markets like India, on average, provide a return on investment (ROI) of over 40%. This is resulting in fierce rivalry among foodservice providers across meal delivery platforms, providing lucrative potential for food disposables and good opportunity in sales of plastic cutlery. One of the primary factors propelling the demand for plastic cutlery in emerging nations is this.
Which is the Leading Region in the Plastic Cutlery Market?
Saudi Arabia's foodservice and sales of plastic cutlery are expanding as a result of increased urbanisation, quick development of meal delivery services, an increase in the number of young adults and working population, and rising disposable income.
Chained consumer food services are growing at a rapid rate hence increasing the opportunities for sales of plastic cutlery, thanks to the popularity of fast food and informal dining. The number of casual dining restaurants in the United States is growing, with worldwide names like Applebee's, Chili's, Outback Steakhouse, and TGI Fridays making their impact on sales of plastic cutlery.
Furthermore, via intelligent menu alterations, worldwide chains have adopted the strategy of customisation and localization. Such overseas expansions are also propelling the North American foodservice disposable plastic cutlery market forward.
Sardi Arabia’s food home delivery service business is being pushed by a rise in the number of existing restaurant mergers and acquisitions (M&A) hence resulting in boosting sales of plastic cutlery. Hellofood purchased HungerStation, an online food delivery business (a division of the Food Panda, an online food delivery service provider).
Find your sweet spots for generating winning opportunities in this market.
Talk to AnalystHow Strong is the Competition in the Plastic Cutlery Market?
Solia, Dart Container Corporation, Eco-Products, Inc., Fuling Global Inc., Biopac India Corporation Ltd., DOpla, TrueChoicePack Corporation, Lollicup USA Inc., Huhtamaki Oyj, Genpak LLC are some of the leading participants in the plastic cutlery market.
Recent developments in the Plastic Cutlery Market:
- Pactiv LLC spent US$ 4.5 million in its Columbus, Ohio plant in December 2015 to build two new manufacturing lines.
- D&W Fine Pack LLC introduced Cruiser Ware oblong containers and lids in October 2016 as a solution for take-out, to-go, and prepared dishes.
- Dart Container Corporation spent US$ 40 million in the establishment of an innovation centre in Michigan, United States, in August 2017.
- Excel Displays and Packaging, a retail packaging and point-of-purchase display company, was bought by Georgia-Pacific LLC in March 2016.
Scope of Report
Report Attribute |
Details |
Growth rate |
CAGR of 4% from 2022 to 2032 |
Base year for estimation |
2021 |
Historical data |
2014 - 2020 |
Forecast period |
2022 - 2032 |
Quantitative units |
Revenue in USD Million and CAGR from 2022 to 2032 |
Report coverage |
Revenue forecast, volume forecast, company ranking, competitive landscape, growth factors, and trends, Pricing Analysis, |
Segments covered |
Product, sales channel, end user, region |
Regional scope |
North America; Western Europe, Eastern Europe, Middle East, Africa, ASEAN, South Asia, Rest of Asia, Australia and New Zealand |
Country scope |
U.S.; Canada; Mexico; Germany; U.K.; France; Italy; Spain; Russia; Belgium; Poland; Czech Republic; China; India; Japan; Australia; Brazil; Argentina; Colombia; Saudi Arabia; UAE; Iran; South Africa |
Key companies profiled |
|
Customization scope |
Free report customization (equivalent to up to 8 analysts working days) with purchase. Addition or alteration to country, regional & segment scope. |
Pricing and purchase options |
Avail of customized purchase options to meet your exact research needs. |

An unified Market Research Subscription Platform, built for today’s disparate research needs.
Key Segments For Plastic Cutlery Market
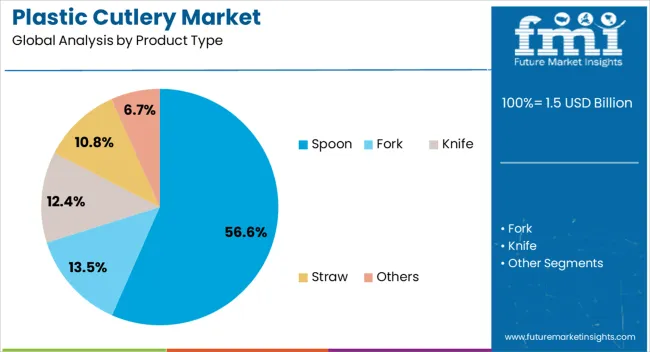
By Product Type:
- Spoon
- Fork
- Knife
- Straw
- Others
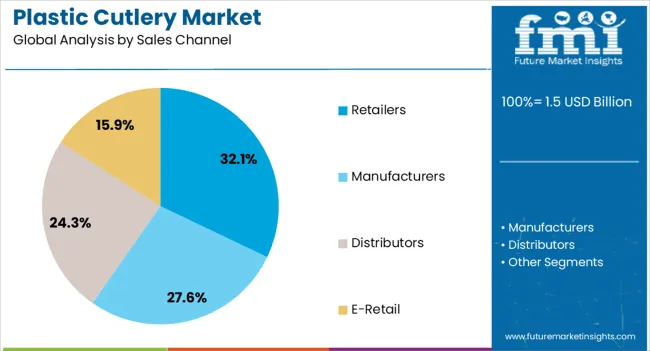
By Sales Channel:
- Retailers
- Manufacturers
- Distributors
- E-retail
By End User:
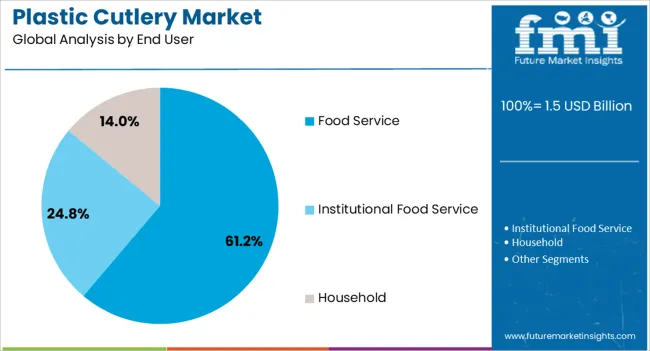
- Household
- Food service outlets
- Institutional food service
By Region:
- North America (U.S., Canada)
- Latin America (Mexico, Brazil)
- Europe (Germany, U.K., France, Italy, Spain, Poland, Russia)
- East Asia (China, Japan, South Korea)
- South Asia (India, Thailand, Malaysia, Vietnam, Indonesia)
- Oceania (Australia, New Zealand)
- Middle East & Africa (GCC Countries, Turkey, Northern Africa, South Africa)
Frequently Asked Questions
The plastic cutlery market is predicted to register a CAGR of 4% during the forecast period.
Solia, Dart Container Corporation, Eco-Products, Inc., Fuling Global Inc., are some of the leading participants in the plastic cutlery market.
As per the analysis, the plastic cutlery market share is likely to be US$ 1.95 Bn by 2026.
Demand for plastic cutlery is likely to rise due to its applications of being lightweight. It's simple to store, sanitary and appealing since it is available in a wide range of colours.
1. Executive Summary
1.1. Global Market Outlook
1.2. Demand-side Trends
1.3. Supply-side Trends
1.4. Technology Roadmap Analysis
1.5. Analysis and Recommendations
2. Market Overview
2.1. Market Coverage / Taxonomy
2.2. Market Definition / Scope / Limitations
3. Market Background
3.1. Market Dynamics
3.1.1. Drivers
3.1.2. Restraints
3.1.3. Opportunity
3.1.4. Trends
3.2. Impact of Covid-19
3.2.1. Demand in Optimistic Scenario
3.2.2. Demand in Likely Scenario
3.2.3. Demand in Conservative Scenario
3.3. Macro Factors and Forecast Factors
3.4. Value Chain Analysis
3.4.1. Profit Margin Analysis
3.4.2. Raw Material Suppliers
3.4.3. Manufacturers, Wholesalers and Distributors
3.4.4. End Users/ Customers
3.5. Regional Parent Market Outlook
3.6. Production and Consumption Statistics
3.7. Global Average Pricing Analysis Benchmark
4. Global Plastic Cutlery Market Analysis 2015-2021 and Forecast, 2022-2032
4.1. Historical Market Size Value (US$ Mn) & Volume (Units) Analysis, 2015-2021
4.2. Current and Future Market Size Value (US$ Mn) & Volume (Units) Projections, 2022-2032
4.2.1. Y-o-Y Growth Trend Analysis
4.2.2. Absolute $ Opportunity Analysis
5. Global Plastic Cutlery Market Analysis 2015–2021 and Forecast 2022–2032, By Material
5.1. Introduction / Key Findings
5.2. Historical Market Size Value (US$ Mn) & Volume (Units) Analysis By Material, 2015-2021
5.3. Current and Future Market Size Value (US$ Mn) & Volume (Units) Analysis and Forecast By Material, 2022-2032
5.3.1. Polypropylene (PP)
5.3.2. Polyethylene (PE)
5.3.3. Polystyrene (PS)
5.3.4. Poly lactic Acid (PLA)
5.3.5. Polyethylene terephthalate (PET)
5.4. Y-o-Y Growth Trend Analysis By Material, 2015-2021
5.5. Absolute $ Opportunity Analysis By Material, 2022-2032
6. Global Plastic Cutlery Market Analysis 2015–2021 and Forecast 2022–2032, By Product Type
6.1. Introduction / Key Findings
6.2. Historical Market Size Value (US$ Mn) & Volume (Units) Analysis By Product Type, 2015-2021
6.3. Current and Future Market Size Value (US$ Mn) & Volume (Units) Analysis and Forecast By Product Type, 2022-2032
6.3.1. Spoon
6.3.2. Fork
6.3.3. Knife
6.3.4. Straw
6.4. Y-o-Y Growth Trend Analysis By Product Type, 2015-2021
6.5. Absolute $ Opportunity Analysis By Product Type, 2022-2032
7. Global Plastic Cutlery Market Analysis 2015–2021 and Forecast 2022–2032, By End-user
7.1. Introduction / Key Findings
7.2. Historical Market Size Value (US$ Mn) & Volume (Units) Analysis By End-user, 2015-2021
7.3. Current and Future Market Size Value (US$ Mn) & Volume (Units) Analysis and Forecast By End-user, 2022-2032
7.3.1. Commercial
7.3.2. Institutional
7.3.3. Household
7.4. Y-o-Y Growth Trend Analysis By End-user, 2015-2021
7.5. Absolute $ Opportunity Analysis By End-user, 2022-2032
8. Global Plastic Cutlery Market Analysis 2015–2021 and Forecast 2022–2032, By Region
8.1. Introduction / Key Findings
8.2. Historical Market Size Value (US$ Mn) & Volume (Units) Analysis By Region, 2015-2021
8.3. Current and Future Market Size Value (US$ Mn) & Volume (Units) Analysis and Forecast By Region, 2022-2032
8.3.1. North America
8.3.2. Latin America
8.3.3. Europe
8.3.4. East Asia
8.3.5. South Asia
8.3.6. Oceania
8.3.7. Middle East and Africa (MEA)
8.4. Market Attractiveness Analysis, by Region
9. North America Plastic Cutlery Market Analysis 2015–2021 and Forecast 2022–2032, By Country
9.1. Historical Market Size Value (US$ Mn) & Volume (Units) Trend Analysis By Market Taxonomy, 2015-2021
9.2. Market Size Value (US$ Mn) & Volume (Units) Forecast By Market Taxonomy, 2022-2032
9.2.1. By Country
9.2.1.1. U.S.
9.2.1.2. Canada
9.2.2. By Material
9.2.3. By Product Type
9.2.4. By End-user
9.3. Market Attractiveness Analysis
9.3.1. By Country
9.3.2. By Material
9.3.3. By Product Type
9.3.4. By End-user
9.4. Key Takeaways
10. Latin America Plastic Cutlery Market Analysis 2015–2021 and Forecast 2022–2032, By Country
10.1. Historical Market Size Value (US$ Mn) & Volume (Units) Trend Analysis By Market Taxonomy, 2015-2021
10.2. Market Size Value (US$ Mn) & Volume (Units) Forecast By Market Taxonomy, 2022-2032
10.2.1. By Country
10.2.1.1. Brazil
10.2.1.2. Mexico
10.2.1.3. Argentina
10.2.1.4. Chile
10.2.1.5. Peru
10.2.1.6. Rest of Latin America
10.2.2. By Material
10.2.3. By Product Type
10.2.4. By End-user
10.3. Market Attractiveness Analysis
10.3.1. By Country
10.3.2. By Material
10.3.3. By Product Type
10.3.4. By End-user
10.4. Key Takeaways
11. Europe Plastic Cutlery Market Analysis 2015–2021 and Forecast 2022–2032, By Country
11.1. Historical Market Size Value (US$ Mn) & Volume (Units) Trend Analysis By Market Taxonomy, 2015-2021
11.2. Market Size Value (US$ Mn) & Volume (Units) Forecast By Market Taxonomy, 2022-2032
11.2.1. By Country
11.2.1.1. Germany
11.2.1.2. Italy
11.2.1.3. France
11.2.1.4. U.K.
11.2.1.5. Spain
11.2.1.6. BENELUX
11.2.1.7. Nordic
11.2.1.8. Russia
11.2.1.9. Poland
11.2.1.10. Rest of Europe
11.2.2. By Material
11.2.3. By Product Type
11.2.4. By End-user
11.3. Market Attractiveness Analysis
11.3.1. By Country
11.3.2. By Material
11.3.3. By Product Type
11.3.4. By End-user
11.4. Key Takeaways
12. East Asia Plastic Cutlery Market Analysis 2015–2021 and Forecast 2022–2032, By Country
12.1. Historical Market Size Value (US$ Mn) & Volume (Units) Trend Analysis By Market Taxonomy, 2015-2021
12.2. Market Size Value (US$ Mn) & Volume (Units) Forecast By Market Taxonomy, 2022-2032
12.2.1. By Country
12.2.1.1. China
12.2.1.2. Japan
12.2.1.3. South Korea
12.2.2. By Material
12.2.3. By Product Type
12.2.4. By End-user
12.3. Market Attractiveness Analysis
12.3.1. By Country
12.3.2. By Material
12.3.3. By Product Type
12.3.4. By End-user
12.4. Key Takeaways
13. South Asia Plastic Cutlery Market Analysis 2015–2021 and Forecast 2022–2032, By Country
13.1. Historical Market Size Value (US$ Mn) & Volume (Units) Trend Analysis By Market Taxonomy, 2015-2021
13.2. Market Size Value (US$ Mn) & Volume (Units) Forecast By Market Taxonomy, 2022-2032
13.2.1. By Country
13.2.1.1. India
13.2.1.2. Thailand
13.2.1.3. Malaysia
13.2.1.4. Indonesia
13.2.1.5. Rest of South Asia
13.2.2. By Material
13.2.3. By Product Type
13.2.4. By End-user
13.3. Market Attractiveness Analysis
13.3.1. By Country
13.3.2. By Material
13.3.3. By Product Type
13.3.4. By End-user
13.4. Key Takeaways
14. Oceania Plastic Cutlery Market Analysis 2015–2021 and Forecast 2022–2032, By Country
14.1. Historical Market Size Value (US$ Mn) & Volume (Units) Trend Analysis By Market Taxonomy, 2015-2021
14.2. Market Size Value (US$ Mn) & Volume (Units) Forecast By Market Taxonomy, 2022-2032
14.2.1. By Country
14.2.1.1. Australia
14.2.1.2. New Zealand
14.2.2. By Material
14.2.3. By Product Type
14.2.4. By End-user
14.3. Market Attractiveness Analysis
14.3.1. By Country
14.3.2. By Material
14.3.3. By Product Type
14.3.4. By End-user
14.4. Key Takeaways
15. Middle East & Africa Plastic Cutlery Market Analysis 2015–2021 and Forecast 2022–2032, By Country
15.1. Historical Market Size Value (US$ Mn) & Volume (Units) Trend Analysis By Market Taxonomy, 2015-2021
15.2. Market Size Value (US$ Mn) & Volume (Units) Forecast By Market Taxonomy, 2022-2032
15.2.1. By Country
15.2.1.1. GCC Countries
15.2.1.2. Turkey
15.2.1.3. Northern Africa
15.2.1.4. South Africa
15.2.1.5. Rest of MEA
15.2.2. By Material
15.2.3. By Product Type
15.2.4. By End-user
15.3. Market Attractiveness Analysis
15.3.1. By Country
15.3.2. By Material
15.3.3. By Product Type
15.3.4. By End-user
15.4. Key Takeaways
16. Country wise Plastic Cutlery Market Analysis
16.1. United States (U.S.)
16.1.1. Market Share Analysis, 2022
16.1.2. By Material
16.1.3. By Product Type
16.1.4. By End-user
16.2. Canada
16.2.1. Market Share Analysis, 2022
16.2.2. By Material
16.2.3. By Product Type
16.2.4. By End-user
16.3. Brazil
16.3.1. Market Share Analysis, 2022
16.3.2. By Material
16.3.3. By Product Type
16.3.4. By End-user
16.4. Mexico
16.4.1. Market Share Analysis, 2022
16.4.2. By Material
16.4.3. By Product Type
16.4.4. By End-user
16.5. Germany
16.5.1. Market Share Analysis, 2022
16.5.2. By Material
16.5.3. By Product Type
16.5.4. By End-user
16.6. Italy
16.6.1. Market Share Analysis, 2022
16.6.2. By Material
16.6.3. By Product Type
16.6.4. By End-user
16.7. France
16.7.1. Market Share Analysis, 2022
16.7.2. By Material
16.7.3. By Product Type
16.7.4. By End-user
16.8. Spain
16.8.1. Market Share Analysis, 2022
16.8.2. By Material
16.8.3. By Product Type
16.8.4. By End-user
16.9. U.K.
16.9.1. Market Share Analysis, 2022
16.9.2. By Material
16.9.3. By Product Type
16.9.4. By End-user
16.10. Russia
16.10.1. Market Share Analysis, 2022
16.10.2. By Material
16.10.3. By Product Type
16.10.4. By End-user
16.11. China
16.11.1. Market Share Analysis, 2022
16.11.2. By Material
16.11.3. By Product Type
16.11.4. By End-user
16.12. Japan
16.12.1. Market Share Analysis, 2022
16.12.2. By Material
16.12.3. By Product Type
16.12.4. By End-user
16.13. India
16.13.1. Market Share Analysis, 2022
16.13.2. By Material
16.13.3. By Product Type
16.13.4. By End-user
16.14. GCC Countries
16.14.1. Market Share Analysis, 2022
16.14.2. By Material
16.14.3. By Product Type
16.14.4. By End-user
16.15. Australia
16.15.1. Market Share Analysis, 2022
16.15.2. By Material
16.15.3. By Product Type
16.15.4. By End-user
17. Market Structure Analysis
17.1. Competition Dashboard
17.2. Competition Benchmarking
17.3. Market Share Analysis of Top Players
17.3.1. By Region
17.3.2. By Product Portfolio
18. Competition Analysis
18.1. Competition Deep Dive
18.1.1. Sulapac Oy.
18.1.1.1. Overview
18.1.1.2. Product Portfolio
18.1.1.3. Profitability by Market Segments (Product/Channel/Region)
18.1.1.4. Sales Footprint
18.1.1.5. Strategy Overview
18.1.1.5.1. Marketing Strategy
18.1.1.5.2. Product Strategy
18.1.1.5.3. Channel Strategy
18.1.2. Greiner Packaging
18.1.2.1. Overview
18.1.2.2. Product Portfolio
18.1.2.3. Profitability by Market Segments (Product/Channel/Region)
18.1.2.4. Sales Footprint
18.1.2.5. Strategy Overview
18.1.2.5.1. Marketing Strategy
18.1.2.5.2. Product Strategy
18.1.2.5.3. Channel Strategy
18.1.3. SOLIA
18.1.3.1. Overview
18.1.3.2. Product Portfolio
18.1.3.3. Profitability by Market Segments (Product/Channel/Region)
18.1.3.4. Sales Footprint
18.1.3.5. Strategy Overview
18.1.3.5.1. Marketing Strategy
18.1.3.5.2. Product Strategy
18.1.3.5.3. Channel Strategy
18.1.4. Dart Container Corporation
18.1.4.1. Overview
18.1.4.2. Product Portfolio
18.1.4.3. Profitability by Market Segments (Product/Channel/Region)
18.1.4.4. Sales Footprint
18.1.4.5. Strategy Overview
18.1.4.5.1. Marketing Strategy
18.1.4.5.2. Product Strategy
18.1.4.5.3. Channel Strategy
18.1.5. DOpla S.p.A.
18.1.5.1. Overview
18.1.5.2. Product Portfolio
18.1.5.3. Profitability by Market Segments (Product/Channel/Region)
18.1.5.4. Sales Footprint
18.1.5.5. Strategy Overview
18.1.5.5.1. Marketing Strategy
18.1.5.5.2. Product Strategy
18.1.5.5.3. Channel Strategy
18.1.6. TCP
18.1.6.1. Overview
18.1.6.2. Product Portfolio
18.1.6.3. Profitability by Market Segments (Product/Channel/Region)
18.1.6.4. Sales Footprint
18.1.6.5. Strategy Overview
18.1.6.5.1. Marketing Strategy
18.1.6.5.2. Product Strategy
18.1.6.5.3. Channel Strategy
18.1.7. Huhtamaki Oyj
18.1.7.1. Overview
18.1.7.2. Product Portfolio
18.1.7.3. Profitability by Market Segments (Product/Channel/Region)
18.1.7.4. Sales Footprint
18.1.7.5. Strategy Overview
18.1.7.5.1. Marketing Strategy
18.1.7.5.2. Product Strategy
18.1.7.5.3. Channel Strategy
18.1.8. AS FOOD PACKAGING
18.1.8.1. Overview
18.1.8.2. Product Portfolio
18.1.8.3. Profitability by Market Segments (Product/Channel/Region)
18.1.8.4. Sales Footprint
18.1.8.5. Strategy Overview
18.1.8.5.1. Marketing Strategy
18.1.8.5.2. Product Strategy
18.1.8.5.3. Channel Strategy
18.1.9. BKS Plastics Ltd.
18.1.9.1. Overview
18.1.9.2. Product Portfolio
18.1.9.3. Profitability by Market Segments (Product/Channel/Region)
18.1.9.4. Sales Footprint
18.1.9.5. Strategy Overview
18.1.9.5.1. Marketing Strategy
18.1.9.5.2. Product Strategy
18.1.9.5.3. Channel Strategy
18.1.10. Fuling Global Inc.
18.1.10.1. Overview
18.1.10.2. Product Portfolio
18.1.10.3. Profitability by Market Segments (Product/Channel/Region)
18.1.10.4. Sales Footprint
18.1.10.5. Strategy Overview
18.1.10.5.1. Marketing Strategy
18.1.10.5.2. Product Strategy
18.1.10.5.3. Channel Strategy
19. Assumptions and Acronyms Used
20. Research Methodology
Let us know your requirement to get
100% FREE customization
Table 01: Global Plastic Cutlery Market Value (US$ Mn) Forecast by Region, 2015-2032
Table 02: Global Plastic Cutlery Market Volume (Units) Forecast by Region, 2015-2032
Table 03: Global Plastic Cutlery Market Value (US$ Mn) Forecast by Material, 2015-2032
Table 04: Global Plastic Cutlery Market Volume (Units) Forecast by Material, 2015-2032
Table 05: Global Plastic Cutlery Market Value (US$ Mn) Forecast by Product Type, 2015-2032
Table 06: Global Plastic Cutlery Market Volume (Units) Forecast by Product Type, 2015-2032
Table 07: Global Plastic Cutlery Market Value (US$ Mn) Forecast by End-user, 2015-2032
Table 08: Global Plastic Cutlery Market Volume (Units) Forecast by End-user, 2015-2032
Table 09: North America Plastic Cutlery Market Value (US$ Mn) Forecast by Country, 2015-2032
Table 10: North America Plastic Cutlery Market Volume (Units) Forecast by Country, 2015-2032
Table 11: North America Plastic Cutlery Market Value (US$ Mn) Forecast by Material, 2015-2032
Table 12: North America Plastic Cutlery Market Volume (Units) Forecast by Material, 2015-2032
Table 13: North America Plastic Cutlery Market Value (US$ Mn) Forecast by Product Type, 2015-2032
Table 14: North America Plastic Cutlery Market Volume (Units) Forecast by Product Type, 2015-2032
Table 15: North America Plastic Cutlery Market Value (US$ Mn) Forecast by End-user, 2015-2032
Table 16: North America Plastic Cutlery Market Volume (Units) Forecast by End-user, 2015-2032
Table 17: Latin America Plastic Cutlery Market Value (US$ Mn) Forecast by Country, 2015-2032
Table 18: Latin America Plastic Cutlery Market Volume (Units) Forecast by Country, 2015-2032
Table 19: Latin America Plastic Cutlery Market Value (US$ Mn) Forecast by Material, 2015-2032
Table 20: Latin America Plastic Cutlery Market Volume (Units) Forecast by Material, 2015-2032
Table 21: Latin America Plastic Cutlery Market Value (US$ Mn) Forecast by Product Type, 2015-2032
Table 22: Latin America Plastic Cutlery Market Volume (Units) Forecast by Product Type, 2015-2032
Table 23: Latin America Plastic Cutlery Market Value (US$ Mn) Forecast by End-user, 2015-2032
Table 24: Latin America Plastic Cutlery Market Volume (Units) Forecast by End-user, 2015-2032
Table 25: Europe Plastic Cutlery Market Value (US$ Mn) Forecast by Country, 2015-2032
Table 26: Europe Plastic Cutlery Market Volume (Units) Forecast by Country, 2015-2032
Table 27: Europe Plastic Cutlery Market Value (US$ Mn) Forecast by Material, 2015-2032
Table 28: Europe Plastic Cutlery Market Volume (Units) Forecast by Material, 2015-2032
Table 29: Europe Plastic Cutlery Market Value (US$ Mn) Forecast by Product Type, 2015-2032
Table 30: Europe Plastic Cutlery Market Volume (Units) Forecast by Product Type, 2015-2032
Table 31: Europe Plastic Cutlery Market Value (US$ Mn) Forecast by End-user, 2015-2032
Table 32: Europe Plastic Cutlery Market Volume (Units) Forecast by End-user, 2015-2032
Table 33: East Asia Plastic Cutlery Market Value (US$ Mn) Forecast by Country, 2015-2032
Table 34: East Asia Plastic Cutlery Market Volume (Units) Forecast by Country, 2015-2032
Table 35: East Asia Plastic Cutlery Market Value (US$ Mn) Forecast by Material, 2015-2032
Table 36: East Asia Plastic Cutlery Market Volume (Units) Forecast by Material, 2015-2032
Table 37: East Asia Plastic Cutlery Market Value (US$ Mn) Forecast by Product Type, 2015-2032
Table 38: East Asia Plastic Cutlery Market Volume (Units) Forecast by Product Type, 2015-2032
Table 39: East Asia Plastic Cutlery Market Value (US$ Mn) Forecast by End-user, 2015-2032
Table 40: East Asia Plastic Cutlery Market Volume (Units) Forecast by End-user, 2015-2032
Table 41: South Asia Plastic Cutlery Market Value (US$ Mn) Forecast by Country, 2015-2032
Table 42: South Asia Plastic Cutlery Market Volume (Units) Forecast by Country, 2015-2032
Table 43: South Asia Plastic Cutlery Market Value (US$ Mn) Forecast by Material, 2015-2032
Table 44: South Asia Plastic Cutlery Market Volume (Units) Forecast by Material, 2015-2032
Table 45: South Asia Plastic Cutlery Market Value (US$ Mn) Forecast by Product Type, 2015-2032
Table 46: South Asia Plastic Cutlery Market Volume (Units) Forecast by Product Type, 2015-2032
Table 47: South Asia Plastic Cutlery Market Value (US$ Mn) Forecast by End-user, 2015-2032
Table 48: South Asia Plastic Cutlery Market Volume (Units) Forecast by End-user, 2015-2032
Table 49: Oceania Plastic Cutlery Market Value (US$ Mn) Forecast by Country, 2015-2032
Table 50: Oceania Plastic Cutlery Market Volume (Units) Forecast by Country, 2015-2032
Table 51: Oceania Plastic Cutlery Market Value (US$ Mn) Forecast by Material, 2015-2032
Table 52: Oceania Plastic Cutlery Market Volume (Units) Forecast by Material, 2015-2032
Table 53: Oceania Plastic Cutlery Market Value (US$ Mn) Forecast by Product Type, 2015-2032
Table 54: Oceania Plastic Cutlery Market Volume (Units) Forecast by Product Type, 2015-2032
Table 55: Oceania Plastic Cutlery Market Value (US$ Mn) Forecast by End-user, 2015-2032
Table 56: Oceania Plastic Cutlery Market Volume (Units) Forecast by End-user, 2015-2032
Table 57: MEA Plastic Cutlery Market Value (US$ Mn) Forecast by Country, 2015-2032
Table 58: MEA Plastic Cutlery Market Volume (Units) Forecast by Country, 2015-2032
Table 59: MEA Plastic Cutlery Market Value (US$ Mn) Forecast by Material, 2015-2032
Table 60: MEA Plastic Cutlery Market Volume (Units) Forecast by Material, 2015-2032
Table 61: MEA Plastic Cutlery Market Value (US$ Mn) Forecast by Product Type, 2015-2032
Table 62: MEA Plastic Cutlery Market Volume (Units) Forecast by Product Type, 2015-2032
Table 63: MEA Plastic Cutlery Market Value (US$ Mn) Forecast by End-user, 2015-2032
Table 64: MEA Plastic Cutlery Market Volume (Units) Forecast by End-user, 2015-2032
Table 65: U.S. Plastic Cutlery Market Value (US$ Mn) Forecast by Material, Product Type, and End-user (2022(E) & 2032(F))
Table 66: Canada Plastic Cutlery Market Value (US$ Mn) Forecast by Material, Product Type, and End-user (2022(E) & 2032(F))
Table 67: Brazil Plastic Cutlery Market Value (US$ Mn) Forecast by Material, Product Type, and End-user (2022(E) & 2032(F))
Table 68: Mexico Plastic Cutlery Market Value (US$ Mn) Forecast by Material, Product Type, and End-user (2022(E) & 2032(F))
Table 69: Germany Plastic Cutlery Market Value (US$ Mn) Forecast by Material, Product Type, and End-user (2022(E) & 2032(F))
Table 70: Italy Plastic Cutlery Market Value (US$ Mn) Forecast by Material, Product Type, and End-user (2022(E) & 2032(F))
Table 71: France Plastic Cutlery Market Value (US$ Mn) Forecast by Material, Product Type, and End-user (2022(E) & 2032(F))
Table 72: Spain Plastic Cutlery Market Value (US$ Mn) Forecast by Material, Product Type, and End-user (2022(E) & 2032(F))
Table 73: U.K. Plastic Cutlery Market Value (US$ Mn) Forecast by Material, Product Type, and End-user (2022(E) & 2032(F))
Table 74: Russia Plastic Cutlery Market Value (US$ Mn) Forecast by Material, Product Type, and End-user (2022(E) & 2032(F))
Table 75: China Plastic Cutlery Market Value (US$ Mn) Forecast by Material, Product Type, and End-user (2022(E) & 2032(F))
Table 76: Japan Plastic Cutlery Market Value (US$ Mn) Forecast by Material, Product Type, and End-user (2022(E) & 2032(F))
Table 77: India Plastic Cutlery Market Value (US$ Mn) Forecast by Material, Product Type, and End-user (2022(E) & 2032(F))
Table 78: GCC Countries Plastic Cutlery Market Value (US$ Mn) Forecast by Material, Product Type, and End-user (2022(E) & 2032(F))
Table 79: Australia Plastic Cutlery Market Value (US$ Mn) Forecast by Material, Product Type, and End-user (2022(E) & 2032(F))
Find your sweet spots for generating winning opportunities in this market.
Talk to AnalystFigure 01: Global Plastic Cutlery Market Value (US$ Mn) by Material, 2022-2032
Figure 02: Global Plastic Cutlery Market Value (US$ Mn) by Product Type, 2022-2032
Figure 03: Global Plastic Cutlery Market Value (US$ Mn) by End-user, 2022-2032
Figure 04: Global Plastic Cutlery Market Value (US$ Mn) by Region, 2022-2032
Figure 05: Global Plastic Cutlery Market Value (US$ Mn) Analysis by Region, 2015-2021
Figure 06: Global Plastic Cutlery Market Volume (Units) Analysis by Region, 2015-2032
Figure 07: Global Plastic Cutlery Market Value Share (%) and BPS Analysis by Region, 2022 & 2032
Figure 08: Global Plastic Cutlery Market Y-o-Y Growth (%) Projections by Region, 2022-2032
Figure 09: Global Plastic Cutlery Market Value (US$ Mn) Analysis by Material, 2015-2021
Figure 10: Global Plastic Cutlery Market Volume (Units) Analysis by Material, 2015-2032
Figure 11: Global Plastic Cutlery Market Value Share (%) and BPS Analysis by Material, 2022 & 2032
Figure 12: Global Plastic Cutlery Market Y-o-Y Growth (%) Projections by Material, 2022-2032
Figure 13: Global Plastic Cutlery Market Value (US$ Mn) Analysis by Product Type, 2015-2021
Figure 14: Global Plastic Cutlery Market Volume (Units) Analysis by Product Type, 2015-2032
Figure 15: Global Plastic Cutlery Market Value Share (%) and BPS Analysis by Product Type, 2022 & 2032
Figure 16: Global Plastic Cutlery Market Y-o-Y Growth (%) Projections by Product Type, 2022-2032
Figure 17: Global Plastic Cutlery Market Value (US$ Mn) Analysis by End-user, 2015-2021
Figure 18: Global Plastic Cutlery Market Volume (Units) Analysis by End-user, 2015-2032
Figure 19: Global Plastic Cutlery Market Value Share (%) and BPS Analysis by End-user, 2022 & 2032
Figure 20: Global Plastic Cutlery Market Y-o-Y Growth (%) Projections by End-user, 2022-2032
Figure 21: Global Plastic Cutlery Market Attractiveness by Material, 2022-2032
Figure 22: Global Plastic Cutlery Market Attractiveness by Product Type, 2022-2032
Figure 23: Global Plastic Cutlery Market Attractiveness by Application, 2022-2032
Figure 24: Global Plastic Cutlery Market Attractiveness by End-user, 2022-2032
Figure 25: Global Plastic Cutlery Market Attractiveness by Region, 2022-2032
Figure 26: North America Plastic Cutlery Market Value (US$ Mn) by Material, 2022-2032
Figure 27: North America Plastic Cutlery Market Value (US$ Mn) by Product Type, 2022-2032
Figure 28: North America Plastic Cutlery Market Value (US$ Mn) by End-user, 2022-2032
Figure 29: North America Plastic Cutlery Market Value (US$ Mn) by Country, 2022-2032
Figure 30: North America Plastic Cutlery Market Value (US$ Mn) Analysis by Country, 2015-2021
Figure 31: North America Plastic Cutlery Market Volume (Units) Analysis by Country, 2015-2032
Figure 32: North America Plastic Cutlery Market Value Share (%) and BPS Analysis by Country, 2022 & 2032
Figure 33: North America Plastic Cutlery Market Y-o-Y Growth (%) Projections by Country, 2022-2032
Figure 34: North America Plastic Cutlery Market Value (US$ Mn) Analysis by Material, 2015-2021
Figure 35: North America Plastic Cutlery Market Volume (Units) Analysis by Material, 2015-2032
Figure 36: North America Plastic Cutlery Market Value Share (%) and BPS Analysis by Material, 2022 & 2032
Figure 37: North America Plastic Cutlery Market Y-o-Y Growth (%) Projections by Material, 2022-2032
Figure 38: North America Plastic Cutlery Market Value (US$ Mn) Analysis by Product Type, 2015-2021
Figure 39: North America Plastic Cutlery Market Volume (Units) Analysis by Product Type, 2015-2032
Figure 40: North America Plastic Cutlery Market Value Share (%) and BPS Analysis by Product Type, 2022 & 2032
Figure 41: North America Plastic Cutlery Market Y-o-Y Growth (%) Projections by Product Type, 2022-2032
Figure 42: North America Plastic Cutlery Market Value (US$ Mn) Analysis by End-user, 2015-2021
Figure 43: North America Plastic Cutlery Market Volume (Units) Analysis by End-user, 2015-2032
Figure 44: North America Plastic Cutlery Market Value Share (%) and BPS Analysis by End-user, 2022 & 2032
Figure 45: North America Plastic Cutlery Market Y-o-Y Growth (%) Projections by End-user, 2022-2032
Figure 46: North America Plastic Cutlery Market Attractiveness by Material, 2022-2032
Figure 47: North America Plastic Cutlery Market Attractiveness by Product Type, 2022-2032
Figure 48: North America Plastic Cutlery Market Attractiveness by End-user, 2022-2032
Figure 49: North America Plastic Cutlery Market Attractiveness by Country, 2022-2032
Figure 50: Latin America Plastic Cutlery Market Value (US$ Mn) by Material, 2022 & 2032
Figure 51: Latin America Plastic Cutlery Market Value (US$ Mn) by Product Type, 2022-2032
Figure 52: Latin America Plastic Cutlery Market Value (US$ Mn) by End-user, 2022-2032
Figure 53: Latin America Plastic Cutlery Market Value (US$ Mn) by Country, 2022-2032
Figure 54: Latin America Plastic Cutlery Market Value (US$ Mn) Analysis by Country, 2015-2021
Figure 55: Latin America Plastic Cutlery Market Volume (Units) Analysis by Country, 2015-2032
Figure 56: Latin America Plastic Cutlery Market Value Share (%) and BPS Analysis by Country, 2022 & 2032
Figure 57: Latin America Plastic Cutlery Market Y-o-Y Growth (%) Projections by Country, 2022-2032
Figure 58: Latin America Plastic Cutlery Market Value (US$ Mn) Analysis by Material, 2015-2021
Figure 59: Latin America Plastic Cutlery Market Volume (Units) Analysis by Material, 2015-2032
Figure 60: Latin America Plastic Cutlery Market Value Share (%) and BPS Analysis by Material, 2022 & 2032
Figure 61: Latin America Plastic Cutlery Market Y-o-Y Growth (%) Projections by Material, 2022-2032
Figure 62: Latin America Plastic Cutlery Market Value (US$ Mn) Analysis by Product Type, 2015-2021
Figure 63: Latin America Plastic Cutlery Market Volume (Units) Analysis by Product Type, 2015-2032
Figure 64: Latin America Plastic Cutlery Market Value Share (%) and BPS Analysis by Product Type, 2022 & 2032
Figure 65: Latin America Plastic Cutlery Market Y-o-Y Growth (%) Projections by Product Type, 2022-2032
Figure 66: Latin America Plastic Cutlery Market Value (US$ Mn) Analysis by End-user, 2015-2021
Figure 67: Latin America Plastic Cutlery Market Volume (Units) Analysis by End-user, 2015-2032
Figure 68: Latin America Plastic Cutlery Market Value Share (%) and BPS Analysis by End-user, 2022 & 2032
Figure 69: Latin America Plastic Cutlery Market Y-o-Y Growth (%) Projections by End-user, 2022-2032
Figure 70: Latin America Plastic Cutlery Market Attractiveness by Material, 2022-2032
Figure 71: Latin America Plastic Cutlery Market Attractiveness by Product Type, 2022-2032
Figure 72: Latin America Plastic Cutlery Market Attractiveness by End-user, 2022-2032
Figure 73: Latin America Plastic Cutlery Market Attractiveness by Country, 2022-2032
Figure 74: Europe Plastic Cutlery Market Value (US$ Mn) by Material, 2022-2032
Figure 75: Europe Plastic Cutlery Market Value (US$ Mn) by Product Type, 2022-2032
Figure 76: Europe Plastic Cutlery Market Value (US$ Mn) by End-user, 2022-2032
Figure 77: Europe Plastic Cutlery Market Value (US$ Mn) by Country, 2022-2032
Figure 78: Europe Plastic Cutlery Market Value (US$ Mn) Analysis by Country, 2015-2021
Figure 79: Europe Plastic Cutlery Market Volume (Units) Analysis by Country, 2015-2032
Figure 80: Europe Plastic Cutlery Market Value Share (%) and BPS Analysis by Country, 2022 & 2032
Figure 81: Europe Plastic Cutlery Market Y-o-Y Growth (%) Projections by Country, 2022-2032
Figure 82: Europe Plastic Cutlery Market Value (US$ Mn) Analysis by Material, 2015-2021
Figure 83: Europe Plastic Cutlery Market Volume (Units) Analysis by Material, 2015-2032
Figure 84: Europe Plastic Cutlery Market Value Share (%) and BPS Analysis by Material, 2022 & 2032
Figure 85: Europe Plastic Cutlery Market Y-o-Y Growth (%) Projections by Material, 2022-2032
Figure 86: Europe Plastic Cutlery Market Value (US$ Mn) Analysis by Product Type, 2015-2021
Figure 87: Europe Plastic Cutlery Market Volume (Units) Analysis by Product Type, 2015-2032
Figure 88: Europe Plastic Cutlery Market Value Share (%) and BPS Analysis by Product Type, 2022 & 2032
Figure 89: Europe Plastic Cutlery Market Y-o-Y Growth (%) Projections by Product Type, 2022-2032
Figure 90: Europe Plastic Cutlery Market Value (US$ Mn) Analysis by End-user, 2015-2021
Figure 91: Europe Plastic Cutlery Market Volume (Units) Analysis by End-user, 2015-2032
Figure 92: Europe Plastic Cutlery Market Value Share (%) and BPS Analysis by End-user, 2022 & 2032
Figure 93: Europe Plastic Cutlery Market Y-o-Y Growth (%) Projections by End-user, 2022-2032
Figure 94: Europe Plastic Cutlery Market Attractiveness by Material, 2022-2032
Figure 95: Europe Plastic Cutlery Market Attractiveness by Product Type, 2022-2032
Figure 96: Europe Plastic Cutlery Market Attractiveness by End-user, 2022-2032
Figure 97: Europe Plastic Cutlery Market Attractiveness by Country, 2022-2032
Figure 98: East Asia Plastic Cutlery Market Value (US$ Mn) by Material, 2022-2032
Figure 99: East Asia Plastic Cutlery Market Value (US$ Mn) by Product Type, 2022-2032
Figure 100: East Asia Plastic Cutlery Market Value (US$ Mn) by End-user, 2022-2032
Figure 101: East Asia Plastic Cutlery Market Value (US$ Mn) by Country, 2022-2032
Figure 102: East Asia Plastic Cutlery Market Value (US$ Mn) Analysis by Country, 2015-2021
Figure 103: East Asia Plastic Cutlery Market Volume (Units) Analysis by Country, 2015-2032
Figure 104: East Asia Plastic Cutlery Market Value Share (%) and BPS Analysis by Country, 2022 & 2032
Figure 105: East Asia Plastic Cutlery Market Y-o-Y Growth (%) Projections by Country, 2022-2032
Figure 106: East Asia Plastic Cutlery Market Value (US$ Mn) Analysis by Material, 2015-2021
Figure 107: East Asia Plastic Cutlery Market Volume (Units) Analysis by Material, 2015-2032
Figure 108: East Asia Plastic Cutlery Market Value Share (%) and BPS Analysis by Material, 2022 & 2032
Figure 109: East Asia Plastic Cutlery Market Y-o-Y Growth (%) Projections by Material, 2022-2032
Figure 110: East Asia Plastic Cutlery Market Value (US$ Mn) Analysis by Product Type, 2015-2021
Figure 111: East Asia Plastic Cutlery Market Volume (Units) Analysis by Product Type, 2015-2032
Figure 112: East Asia Plastic Cutlery Market Value Share (%) and BPS Analysis by Product Type, 2022 & 2032
Figure 113: East Asia Plastic Cutlery Market Y-o-Y Growth (%) Projections by Product Type, 2022-2032
Figure 114: East Asia Plastic Cutlery Market Value (US$ Mn) Analysis by End-user, 2015-2021
Figure 115: East Asia Plastic Cutlery Market Volume (Units) Analysis by End-user, 2015-2032
Figure 116: East Asia Plastic Cutlery Market Value Share (%) and BPS Analysis by End-user, 2022 & 2032
Figure 117: East Asia Plastic Cutlery Market Y-o-Y Growth (%) Projections by End-user, 2022-2032
Figure 118: East Asia Plastic Cutlery Market Attractiveness by Material, 2022-2032
Figure 119: East Asia Plastic Cutlery Market Attractiveness by Product Type, 2022-2032
Figure 120: East Asia Plastic Cutlery Market Attractiveness by End-user, 2022-2032
Figure 121: East Asia Plastic Cutlery Market Attractiveness by Country, 2022-2032
Figure 122: South Asia Plastic Cutlery Market Value (US$ Mn) by Material, 2022-2032
Figure 123: South Asia Plastic Cutlery Market Value (US$ Mn) by Product Type, 2022-2032
Figure 124: South Asia Plastic Cutlery Market Value (US$ Mn) by End-user, 2022-2032
Figure 125: South Asia Plastic Cutlery Market Value (US$ Mn) by Country, 2022-2032
Figure 126: South Asia Plastic Cutlery Market Value (US$ Mn) Analysis by Country, 2015-2021
Figure 127: South Asia Plastic Cutlery Market Volume (Units) Analysis by Country, 2015-2032
Figure 128: South Asia Plastic Cutlery Market Value Share (%) and BPS Analysis by Country, 2022 & 2032
Figure 129: South Asia Plastic Cutlery Market Y-o-Y Growth (%) Projections by Country, 2022-2032
Figure 130: South Asia Plastic Cutlery Market Value (US$ Mn) Analysis by Material, 2015-2021
Figure 131: South Asia Plastic Cutlery Market Volume (Units) Analysis by Material, 2015-2032
Figure 132: South Asia Plastic Cutlery Market Value Share (%) and BPS Analysis by Material, 2022 & 2032
Figure 133: South Asia Plastic Cutlery Market Y-o-Y Growth (%) Projections by Material, 2022-2032
Figure 134: South Asia Plastic Cutlery Market Value (US$ Mn) Analysis by Product Type, 2015-2021
Figure 135: South Asia Plastic Cutlery Market Volume (Units) Analysis by Product Type, 2015-2032
Figure 136: South Asia Plastic Cutlery Market Value Share (%) and BPS Analysis by Product Type, 2022 & 2032
Figure 137: South Asia Plastic Cutlery Market Y-o-Y Growth (%) Projections by Product Type, 2022-2032
Figure 138: South Asia Plastic Cutlery Market Value (US$ Mn) Analysis by End-user, 2015-2021
Figure 139: South Asia Plastic Cutlery Market Volume (Units) Analysis by End-user, 2015-2032
Figure 140: South Asia Plastic Cutlery Market Value Share (%) and BPS Analysis by End-user, 2022 & 2032
Figure 141: South Asia Plastic Cutlery Market Y-o-Y Growth (%) Projections by End-user, 2022-2032
Figure 142: South Asia Plastic Cutlery Market Attractiveness by Material, 2022-2032
Figure 143: South Asia Plastic Cutlery Market Attractiveness by Product Type, 2022-2032
Figure 144: South Asia Plastic Cutlery Market Attractiveness by End-user, 2022-2032
Figure 145: South Asia Plastic Cutlery Market Attractiveness by Country, 2022-2032
Figure 146: Oceania Plastic Cutlery Market Value (US$ Mn) by Material, 2022-2032
Figure 147: Oceania Plastic Cutlery Market Value (US$ Mn) by Product Type, 2022-2032
Figure 148: Oceania Plastic Cutlery Market Value (US$ Mn) by End-user, 2022-2032
Figure 149: Oceania Plastic Cutlery Market Value (US$ Mn) by Country, 2022-2032
Figure 150: Oceania Plastic Cutlery Market Value (US$ Mn) Analysis by Country, 2015-2021
Figure 151: Oceania Plastic Cutlery Market Volume (Units) Analysis by Country, 2015-2032
Figure 152: Oceania Plastic Cutlery Market Value Share (%) and BPS Analysis by Country, 2022 & 2032
Figure 153: Oceania Plastic Cutlery Market Y-o-Y Growth (%) Projections by Country, 2022-2032
Figure 154: Oceania Plastic Cutlery Market Value (US$ Mn) Analysis by Material, 2015-2021
Figure 155: Oceania Plastic Cutlery Market Volume (Units) Analysis by Material, 2015-2032
Figure 156: Oceania Plastic Cutlery Market Value Share (%) and BPS Analysis by Material, 2022 & 2032
Figure 157: Oceania Plastic Cutlery Market Y-o-Y Growth (%) Projections by Material, 2022-2032
Figure 158: Oceania Plastic Cutlery Market Value (US$ Mn) Analysis by Product Type, 2015-2021
Figure 159: Oceania Plastic Cutlery Market Volume (Units) Analysis by Product Type, 2015-2032
Figure 160: Oceania Plastic Cutlery Market Value Share (%) and BPS Analysis by Product Type, 2022 & 2032
Figure 161: Oceania Plastic Cutlery Market Y-o-Y Growth (%) Projections by Product Type, 2022-2032
Figure 162: Oceania Plastic Cutlery Market Value (US$ Mn) Analysis by End-user, 2015-2021
Figure 163: Oceania Plastic Cutlery Market Volume (Units) Analysis by End-user, 2015-2032
Figure 164: Oceania Plastic Cutlery Market Value Share (%) and BPS Analysis by End-user, 2022 & 2032
Figure 165: Oceania Plastic Cutlery Market Y-o-Y Growth (%) Projections by End-user, 2022-2032
Figure 166: Oceania Plastic Cutlery Market Attractiveness by Material, 2022-2032
Figure 167: Oceania Plastic Cutlery Market Attractiveness by Product Type, 2022-2032
Figure 168: Oceania Plastic Cutlery Market Attractiveness by End-user, 2022-2032
Figure 169 Oceania Plastic Cutlery Market Attractiveness by Country, 2022-2032
Figure 170: MEA Plastic Cutlery Market Value (US$ Mn) by Material, 2022-2032
Figure 171: MEA Plastic Cutlery Market Value (US$ Mn) by Product Type, 2022-2032
Figure 172: MEA Plastic Cutlery Market Value (US$ Mn) by End-user, 2022-2032
Figure 173: MEA Plastic Cutlery Market Value (US$ Mn) by Country, 2022-2032
Figure 174: MEA Plastic Cutlery Market Value (US$ Mn) Analysis by Country, 2015-2021
Figure 175: MEA Plastic Cutlery Market Volume (Units) Analysis by Country, 2015-2032
Figure 176: MEA Plastic Cutlery Market Value Share (%) and BPS Analysis by Country, 2022 & 2032
Figure 177: MEA Plastic Cutlery Market Y-o-Y Growth (%) Projections by Country, 2022-2032
Figure 178: MEA Plastic Cutlery Market Value (US$ Mn) Analysis by Material, 2015-2021
Figure 179: MEA Plastic Cutlery Market Volume (Units) Analysis by Material, 2015-2032
Figure 180: MEA Plastic Cutlery Market Value Share (%) and BPS Analysis by Material, 2022 & 2032
Figure 181: MEA Plastic Cutlery Market Y-o-Y Growth (%) Projections by Material, 2022-2032
Figure 182: MEA Plastic Cutlery Market Value (US$ Mn) Analysis by Product Type, 2015-2021
Figure 183: MEA Plastic Cutlery Market Volume (Units) Analysis by Product Type, 2015-2032
Figure 184: MEA Plastic Cutlery Market Value Share (%) and BPS Analysis by Product Type, 2022 & 2032
Figure 185: MEA Plastic Cutlery Market Y-o-Y Growth (%) Projections by Product Type, 2022-2032
Figure 186: MEA Plastic Cutlery Market Value (US$ Mn) Analysis by End-user, 2015-2021
Figure 187: MEA Plastic Cutlery Market Volume (Units) Analysis by End-user, 2015-2032
Figure 188: MEA Plastic Cutlery Market Value Share (%) and BPS Analysis by End-user, 2022 & 2032
Figure 189: MEA Plastic Cutlery Market Y-o-Y Growth (%) Projections by End-user, 2022-2032
Figure 190: MEA Plastic Cutlery Market Attractiveness by Material, 2022-2032
Figure 191: MEA Plastic Cutlery Market Attractiveness by Product Type, 2022-2032
Figure 192: MEA Plastic Cutlery Market Attractiveness by End-user, 2022-2032
Figure 193 MEA Plastic Cutlery Market Attractiveness by Country, 2022-2032
Need specific information?
Request CustomizationExplore Packaging Insights
View Reports