The Agrochemical Additives Market is estimated to be valued at USD 1.9 billion in 2025 and is projected to reach USD 3.1 billion by 2035, registering a compound annual growth rate (CAGR) of 4.6% over the forecast period.
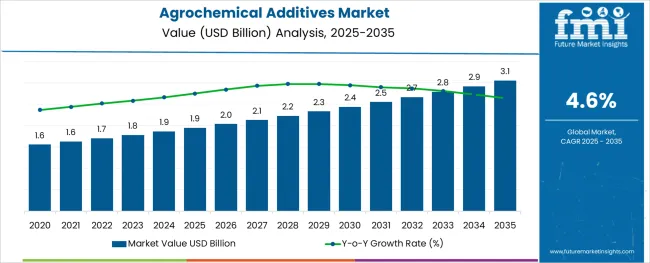
The agrochemical additives market is growing steadily due to increased demand for enhancing the efficacy of crop protection products and improving agricultural productivity. Industry publications have highlighted a rising need for additives that optimize pesticide performance by improving adhesion, dispersion, and penetration on crop surfaces. The growing focus on sustainable agriculture and integrated pest management has driven innovation in additive formulations that reduce environmental impact while maintaining effectiveness.
Expanding cultivation of key food crops, especially cereals and grains, has fueled the application of agrochemical additives to safeguard yields and ensure food security. Regulatory bodies have increasingly emphasized the safe use of agrochemicals, which has accelerated the adoption of additives that enhance product safety and reduce chemical use.
Future growth is expected to be supported by advances in biodegradable additives and precision farming techniques. Segmental growth is anticipated to be led by the Pesticides end use, Crop Protection application, and Cereals & Grains as the dominant crop type.
The market is segmented by End Use, Application, and Crop Type and region. By End Use, the market is divided into Pesticides, Fertilizers, Plant Growth Regulators, Soil Conditioners, and Liming and Acidifying agents. In terms of Application, the market is classified into Crop Protection, Seed Treatment, Soil Health, Solvents, Dispersants, Preservatives, and Others. Based on Crop Type, the market is segmented into Cereals & Grains, Oilseeds & Pulses, Fruits & Vegetables, and Plantation Crops and Hydroponics. Regionally, the market is classified into North America, Latin America, Western Europe, Eastern Europe, Balkan & Baltic Countries, Russia & Belarus, Central Asia, East Asia, South Asia & Pacific, and the Middle East & Africa.
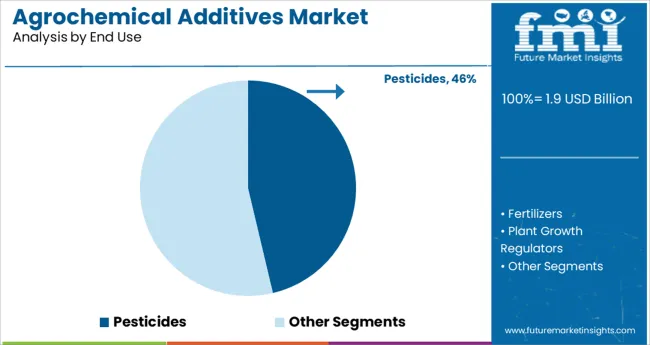
The Pesticides segment is projected to hold 46.3% of the agrochemical additives market revenue in 2025, retaining its position as the largest end-use category. Growth in this segment has been propelled by the widespread use of pesticides in combating pests and diseases across various crops. Additives used with pesticides improve spray coverage, reduce drift, and enhance adhesion to plant surfaces, increasing treatment efficiency.
Farmers and agronomists have increasingly adopted formulations that allow for better pest control with lower chemical volumes, supporting sustainable practices. The demand for pesticide additives has also been driven by regulatory pressures to minimize environmental contamination and maximize on-target effectiveness.
As pest resistance issues escalate, the use of advanced pesticide additives is expected to remain critical for crop protection strategies.
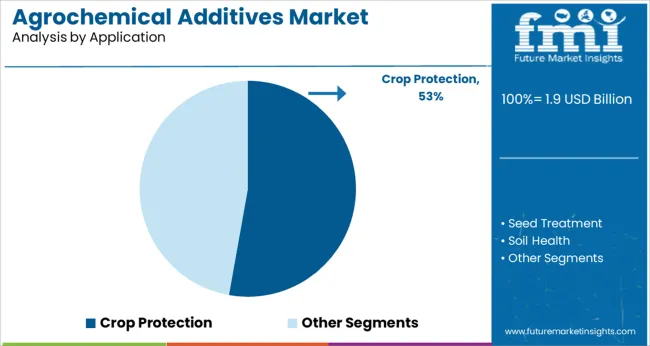
The Crop Protection segment is expected to contribute 52.8% of the agrochemical additives market revenue in 2025, establishing it as the leading application area. This segment’s growth is linked to the growing emphasis on protecting crops from pests, weeds, and diseases to enhance yield and quality. Agrochemical additives play a key role in improving the performance of crop protection agents by facilitating uniform distribution and persistence on crop surfaces.
Increasing investments in crop protection technologies and the expansion of large-scale farming operations have driven demand. Additionally, farmers are adopting advanced additives that support integrated pest management by enabling selective targeting and reduced chemical use.
With global food demand rising, the Crop Protection segment is anticipated to sustain strong growth.
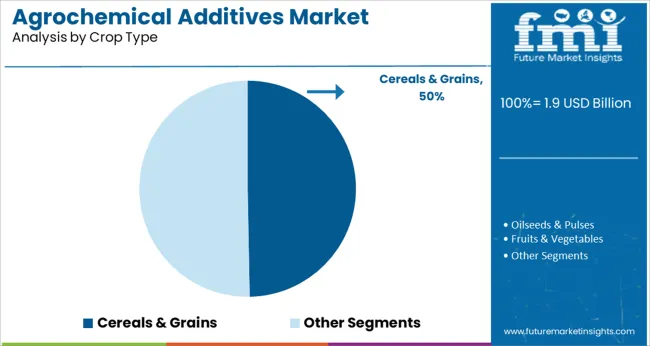
The Cereals & Grains segment is projected to hold 49.7% of the agrochemical additives market revenue in 2025, positioning it as the dominant crop type segment. This prominence reflects the extensive cultivation of cereals and grains worldwide, which are staple food sources with high economic value. Agrochemical additives are widely used in these crops to improve the effectiveness of pesticides and fertilizers, ensuring healthy growth and optimal yields.
Growing awareness among farmers regarding crop protection and the importance of maximizing productivity has supported the adoption of additive-enhanced formulations. Moreover, government programs focused on food security and sustainable agriculture have promoted best practices in cereals and grains cultivation.
As global demand for these crops continues to rise, the Cereals & Grains segment is expected to maintain its leading market share.
Demand for agrochemical additves increased at a CAGR of 4.3% between 2020 and 2024 and is projected to grow at 4.6% CAGR over the forecast period.
Growth in the manufacturing industry, development in the agriculture sector and increasing usage of fertilizers and Pesticides are anticipated to spur demand in the market. Besides this, technological advancements in the food and agrochemical industries, along with growing demand for agricultural products will boost the markt.
Despite these growth drivers, there are certain challenges for the market including stringency in legislative constraints and standards regarding the production of agrochemicals, an increase in the pricing of raw materials, and rising demand for organic formulations and organic farming.
Pesticides are compounds produced through chemical or biochemical processes that include active components in a certain concentration and are intended to protect crops against weeds, diseases, and insects, as well as to reduce crop losses. Chelating agents, building blocks, pH regulators, and salification agents are all used as agrochemical additives.
To avoid pests, weeds, and illnesses, agrochemicals are diluted in specified dosages and applied to seeds, soil, irrigation water, and crops. Over the last few decades, high-purity compounds are sold in bulk to formulators, who derive formulations by adding inert carriers, solvents, surface-active agents, and deodorants. Increasing need for food production and population growth are creating opporutnities for growth for manufacturers in the market.
Furthermore, one of the primary drivers for the usageof agrochemicals additives is institutional credit to give financing to farmers in rural areas. High availability and low interest rates on farm loans will encourage farmers to use more fertilizers and pesticides to increase agricultural yields which is anticipated to fuel sales.
Production and utilization of chemicals including pseudo-biological products laced with agrochemicals are classified as non-genuine pesticides. These products are phony, adulterated, sub-standard, or illegally imported, and they impact the harvest, soil, and environment more than the pests.
Stringency in government standards and regulations and regulatory intervention are limiting the utilization of several chemicals and materials. In line with these regulations, manufacturers are also minimizing the consumption and production of non-water-soluble agrochemicals, which is limiting sales to an extent.
Water pollution caused by agrochemicals in large water bodies causes growth of algae and promotes eutrophication, which remains a key environmental challenge. Rodenticides, POPs (Persistent Organic Pollutants), OPs (organophosphates), and carbamate compounds are among the agrochemicals that have caused severe conservation concerns for species at the top of food webs.
Manufacturers are developing slow-release formulations for reducing environmental impact by minimizing agrochemical volatilization, leaching, and degradation. Furthermore, toxicity of certain types of additves are also restricting the usage of agrochemical additives.
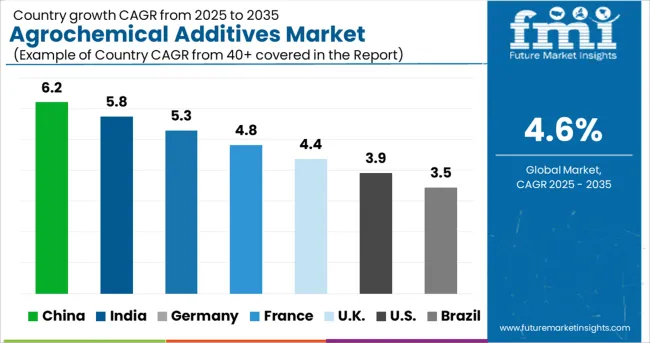
Expansion in the Agricultural Sector in India Will Drive Sales of Agrochemical Additives
India is expected to remain one of the fastest growing market for the consumption and production of agrochemical additives. Pests and illnesses affect approximately 20-25% of the entire food produced in India.
According to the Ministry of Agriculture, India loses INR 1.48 Lakh Crores in agricultural productivity each year owing to pests, weeds, and plant diseases. As a result, agrochemicals serve as a critical input for crop protection and increased yiel.
Moreover, India's low-cost manufacturing capability, availability of a technically skilled workforce, superior worldwide price realization, and strong presence in generic pesticide manufacturers are expected to augment the growth in the market.
High Focus on Crop Health in China Will Spur Demand for Agrochemical Additives
China is expected to account for about 73% of the additves demand in East Asia over the forecast period. Due to substantial development in the chemical sector in China and urbanization, the accessible landmass for agriculture is reducing, prompting farmers to utilize various agrochemicals to maintain soil health and boost land productivity.
Rising production of active components used in the formulation of agrochemical products and ready-to-use pesticides supplied in several countries along with a higher volume of crop protection chemicals production will augment grow th in the market.
Demand for Agrochemical Additives for Fertilizers to Remain High
Owing to substantial production volume of fertlizers, sales of additives are expected to increase at a considerable pace over the forecast period. Population growth will likely result in high demand for food and agricultural products, which will drive fertlizers consumption in the agriculture sector.
Fertlizerssegment is anticipated to remain one of the key end use in the market, which is further enhanced by government subsidies on certain fertlizers. As a result, the need for biopesticides is anticipated to increase in the forthcoming years. The segment is expected to account for 64% of the total market share over the forecast period.
Sales of Agrochemical Additives for Cereals and Grains to Gain Traction
Cereals and grains use the most agrochemicals because crops such as rice can have lower yields and less accessible nutrients due to nutritional shortages in the soil. Rice crop production and grain nutrient content are increased by adding critical minerals through fertilizers, which is expected to propel the demand for agrochemical additives.
The production of cereal crops will rise by 60% between 2000 and 2050, according to the Food and Agriculture Organization of the United Nations. The food and agriculture sector is also expected to remain one of the key consumer of agrochemicals owing to high demand for agrochemicals for food production and genetically modified crop production.
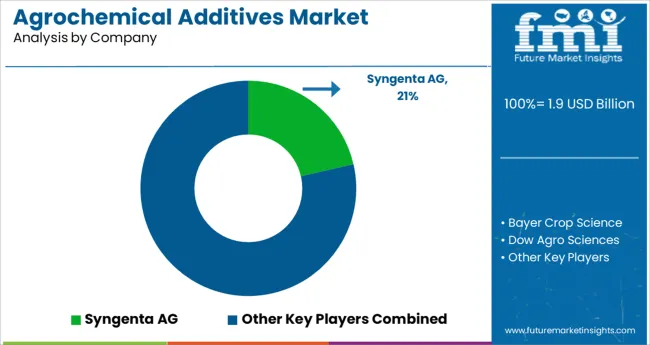
Through acquisitions, mergers, and joint ventures, key players are aiming to expand their production facilities. Additionally, through research and development initiatives, certain manufacturers are creating fresh, cutting-edge products. For instance:
| Attribute | Details |
|---|---|
| Estimated Market Size (2025) | USD 1.9 Billion |
| Projected Market Valutaion (2035) | USD 3.1 Billion |
| Value-based CAGR (2025-2035) | 4.6% |
| Forecast Period | 2025 to 2035 |
| Historical Data Available for | 2020 to 2024 |
| Market Analysis | million for Value and Tons for Volume |
| Key Countries Covered | The USA, Canada, Brazil, Mexico, Germany, Italy, France, The UK, Spain, BENELUX, Russia, China, Japan, South Korea, India, ASEAN, ANZ, GCC Countries, Turkey, Northern Africa, South Africa |
| Key Segments Covered | End Use, Application, Crop Type, and Region |
| Key Companies Profiled | Syngenta AG; Bayer Crop Science; Dow Agro Sciences; Adama Ltd; FMC; BASF SE; Sumitomo Chemical Co., Ltd; UPL Limited; Nutrichem Company Limited; Nufarm Ltd; Israel Chemicals Limited (ICL); Saudi Arabia Fertilizer Company (SAFCO); S.A OCPJordan Abyad Fertilizers and Chemicals Company; Yara International ASA; Heringer; PhosAgro; DuSolo Fertilizers; WinHarvest Pty Ltd; OCI N.V.; The Mosaic Company; Nutrient Ltd.; K+S KALI GmbH |
| Report Coverage | Market Forecast, Company Share Analysis, Competition Intelligence, DROT Analysis, Market Dynamics and Challenges, and Strategic Growth Initiatives |
The global agrochemical additives market is estimated to be valued at USD 1.9 billion in 2025.
It is projected to reach USD 3.1 billion by 2035.
The market is expected to grow at a 4.6% CAGR between 2025 and 2035.
The key product types are pesticides, fertilizers, plant growth regulators, soil conditioners and liming and acidifying agents.
crop protection segment is expected to dominate with a 52.8% industry share in 2025.


Our Research Products

The "Full Research Suite" delivers actionable market intel, deep dives on markets or technologies, so clients act faster, cut risk, and unlock growth.

The Leaderboard benchmarks and ranks top vendors, classifying them as Established Leaders, Leading Challengers, or Disruptors & Challengers.

Locates where complements amplify value and substitutes erode it, forecasting net impact by horizon

We deliver granular, decision-grade intel: market sizing, 5-year forecasts, pricing, adoption, usage, revenue, and operational KPIs—plus competitor tracking, regulation, and value chains—across 60 countries broadly.

Spot the shifts before they hit your P&L. We track inflection points, adoption curves, pricing moves, and ecosystem plays to show where demand is heading, why it is changing, and what to do next across high-growth markets and disruptive tech

Real-time reads of user behavior. We track shifting priorities, perceptions of today’s and next-gen services, and provider experience, then pace how fast tech moves from trial to adoption, blending buyer, consumer, and channel inputs with social signals (#WhySwitch, #UX).

Partner with our analyst team to build a custom report designed around your business priorities. From analysing market trends to assessing competitors or crafting bespoke datasets, we tailor insights to your needs.
Supplier Intelligence
Discovery & Profiling
Capacity & Footprint
Performance & Risk
Compliance & Governance
Commercial Readiness
Who Supplies Whom
Scorecards & Shortlists
Playbooks & Docs
Category Intelligence
Definition & Scope
Demand & Use Cases
Cost Drivers
Market Structure
Supply Chain Map
Trade & Policy
Operating Norms
Deliverables
Buyer Intelligence
Account Basics
Spend & Scope
Procurement Model
Vendor Requirements
Terms & Policies
Entry Strategy
Pain Points & Triggers
Outputs
Pricing Analysis
Benchmarks
Trends
Should-Cost
Indexation
Landed Cost
Commercial Terms
Deliverables
Brand Analysis
Positioning & Value Prop
Share & Presence
Customer Evidence
Go-to-Market
Digital & Reputation
Compliance & Trust
KPIs & Gaps
Outputs
Full Research Suite comprises of:
Market outlook & trends analysis
Interviews & case studies
Strategic recommendations
Vendor profiles & capabilities analysis
5-year forecasts
8 regions and 60+ country-level data splits
Market segment data splits
12 months of continuous data updates
DELIVERED AS:
PDF EXCEL ONLINE
Additives for Metalworking Fluids Market Size and Share Forecast Outlook 2025 to 2035
Additives for Floor Coatings Market
Ink Additives Market Growth – Trends & Forecast 2025 to 2035
Seed Additives Market Analysis - Size and Share Forecast Outlook 2025 to 2035
Fuel Additives Market Segmentation based on Type, Application, and Region: Forecast for 2025 and 2035
Amine Additives in Paints and Coatings Market
Coating Additives Market Growth – Trends & Forecast 2025 to 2035
Understanding Market Share Trends in Brewing Additives
Ceramic Additives Market
Foundry Additives Market
Refining Additives Market Size and Share Forecast Outlook 2025 to 2035
Silicone Additives Market Size and Share Forecast Outlook 2025 to 2035
Butyrate Additives Market Analysis - Size, Share, and Forecast Outlook 2025 to 2035
Pet Food Additives Market - Size, Share, and Forecast Outlook 2025 to 2035
Aqua Feed Additives Market Analysis by Species Type, Ingredient and Other Additives Types Through 2035
Lubricant Additives Market Growth - Trends & Forecast 2025 to 2035
Packaging Additives Market Growth and Forecast 2025 to 2035
A detailed global analysis of Brand Share Analysis for Aqua Feed Additives Industry
ASEAN Food Additives Market Insights – Growth, Demand & Forecast 2025–2035
Functional Additives And Barrier Coatings Market from 2025 to 2035

Thank you!
You will receive an email from our Business Development Manager. Please be sure to check your SPAM/JUNK folder too.
Chat With
MaRIA