Seed Additives Market Size and Share Forecast Outlook 2025 to 2035

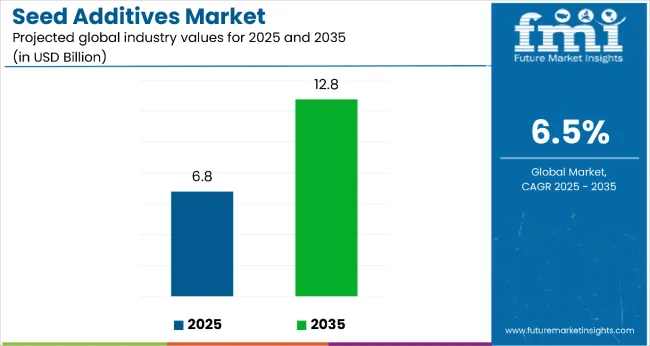
The seed additives market is projected to be valued at USD 6.8 billion in 2025 and is expected to reach USD 12.8 billion by 2035, reflecting a CAGR of 6.5% during the forecast period. This translates into an absolute dollar opportunity of USD 6.0 billion between 2025 and 2035, indicating a 1.88x expansion.
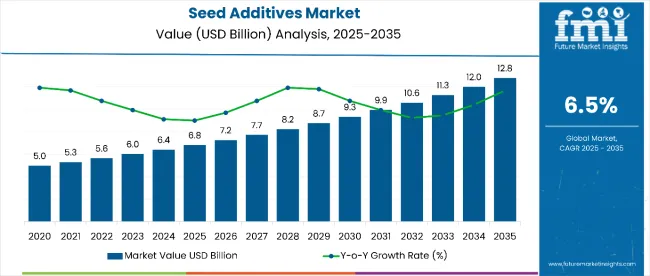
Seed Additives Market Value Analysis

Quick Stats for Seed Additives Market

  • Seed Additives Market Value (2025): USD 6.8 billion
  • Seed Additives Market Forecast Value (2035): USD 12.8 billion
  • Seed Additives Market Forecast CAGR: 6.5%
  • Leading Segment in Seed Additives Market 2025: Polymers (43% market share)
  • Key Growth Region in Seed Additives Market: Asia Pacific, North America, Latin America
  • Top Players: BASF SE, Bayer Crop Science, Croda International, Corteva Agriscience, Clariant, Syngenta

Seed Additives Market

By 2030, the market is anticipated to reach approximately USD 9.3 billion, representing USD 2.5 billion in incremental growth during the first half of the decade. The remaining USD 3.5 billion is expected in the second half, signaling a moderately back-loaded growth trend. This trajectory is driven by global demand for yield-enhancing and stress-resilient seeds, increased adoption of bio-based inputs, and rising focus on sustainable agriculture. Demand remains strong in emerging economies investing in seed treatment infrastructure and regenerative farming practices.

Companies such as BASF SE, Bayer AG, Croda International Plc, and Corteva Agriscience are spear heading innovation with multifunctional seed coatings, nutritional primers, and bioactive protectants. These solutions enhance germination and seedling vigor while offering a competitive advantage in drought-prone and pathogen-heavy environments. Digital platforms and precision farming systems are expanding the use of additive-treated seeds across row crops, vegetables, and specialty seeds.

The market accounts for approximately 18.7% of the total agricultural seed treatment segment, highlighting its critical role in improving crop performance during germination and early growth stages. Within the broader crop input ecosystem, seed additives represent about 6.4% of total value, with an upward trajectory as biological and nutrient-based additives gain traction.

The segment contributes nearly 12% to the bio-agriculture input market, driven by growing adoption of organic and microbial additives, particularly in regulated markets such as the EU and Japan. The share of seed additives in emerging seed enhancement technologies stands at around 20.5%, supported by innovations in encapsulation, nano-coating, and targeted release formulations.

The market is undergoing structural transformation driven by rising demand for high-performance, eco-conscious seed inputs and increasing integration between digital agronomy platforms and treated seed systems. Adoption of biological seed additives is expanding as regulatory scrutiny on chemical residues and soil degradation intensifies. In parallel, large agri-input companies are investing in supply chain digitization and on-farm advisory platforms to promote customized additive formulations. Direct-to-farmer distribution models, subscription-based seed treatment services, and localized microbial inoculants are redefining how value is delivered across the modern seed industry.

Why is the Seed Additives Market Growing?

Seed additives are increasingly adopted for their ability to enhance germination, promote early seedling vigor, and improve crop resilience, making them a critical input for achieving higher yields and minimizing production risks. These additives ensure uniform plant emergence, improve nutrient uptake, and provide protection against abiotic and biotic stresses, which is crucial under changing climate conditions and soil degradation.

Growing pressure to increase food output without expanding arable land is driving farmers to embrace seed enhancement technologies. Consequently, seed additives are now widely integrated into commercial seed operations for grains, oilseeds, pulses, and vegetables. Rising interest in biological and organic farming also strengthens demand for additives that support residue-free and soil-friendly cultivation practices.

Adoption of hybrid and genetically improved seeds, particularly in Asia Pacific, Latin America, and Sub-Saharan Africa, is reinforcing the need for additives to unlock genetic potential. Government-led programs promoting value-added seeds and precision farming trends are further positioning seed additives as essential components of modern agriculture, with applications extending across row crops, horticulture, and protected cultivation systems.

Segmental Analysis

The seed additives market is segmented by type, crop type, distribution channel, and region. By type, the market is divided into polymers, pellets, colorants, minerals/pumice, active ingredients, and other additives. In terms of crop type, the market is classified into oilseeds & pulses, cereals & grains, vegetables, flowers & ornamentals, and others. By distribution channel, the market is bifurcated into B2B, B2C, store-based retailing hypermarkets/supermarkets, convenience stores, discount stores, independent small groceries, and online retailing platforms. By region, the market covers North America, Europe, Asia-Pacific, Latin America, the Middle East & Africa.
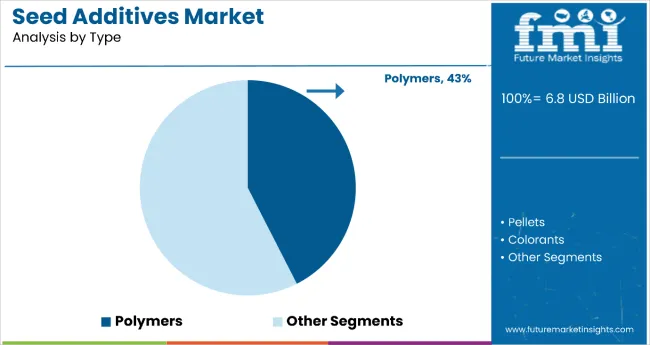
By Type, Polymers Account for 43% of the Market Share

Seed Additives Market By Type

The polymer-based seed additives segment commands the largest share of the market at 43%, owing to its critical role in improving seed flowability, mechanical strength, and uniform coating for machine handling. These polymers act as carriers or binders for other functional agents such as nutrients, colorants, or biologicals, forming the structural basis of modern seed enhancement systems.

High compatibility with both synthetic and biological active ingredients makes this segment a preferred choice for commercial seed treatment facilities. The emergence of biodegradable and water-dispersible polymers is further accelerating growth, particularly in regulated markets such as the EU and Japan. Manufacturers are also innovating with polymer encapsulation technologies that provide extended release of protectants or stimulants over time, increasing agronomic value.

With proven functionality, cost-effectiveness, and scalability, polymer additives are expected to maintain leadership in the seed treatment value chain throughout the forecast period.
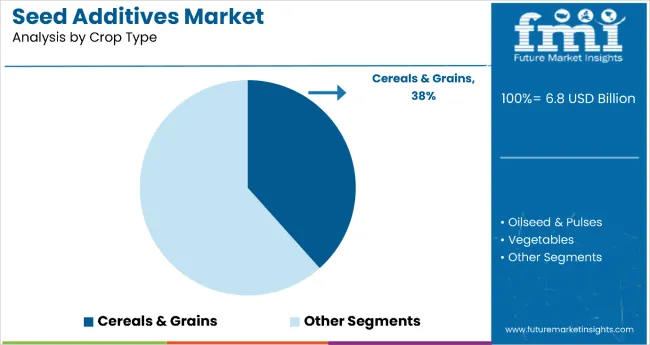
By Crop Type, Cereals & Grains Dominate with 38% Market Share

Seed Additives Market By Crop Type

The cereals and grains segment leads with a 38% share, reflecting the vast acreage and intensive input use in crops such as wheat, maize, rice, and barley. These crops are highly responsive to seed enhancements that boost germination, early root development, and pest or pathogen defense, making them prime targets for additive application.

Farmers and seed companies increasingly rely on nutrient-loaded coatings, antifungal colorants, and bio-based primers for cereals to ensure uniform emergence and stronger initial growth, especially in rain-fedor stress-prone zones. Government programs promoting hybrid cereal varieties and minimum tillage are further increasing reliance on treated seeds in both developed and developing economies.

As global demand for staple grains rises and agricultural practices become more precision-oriented, the cereals and grains segment is projected to remain the largest consumer of seed additives.
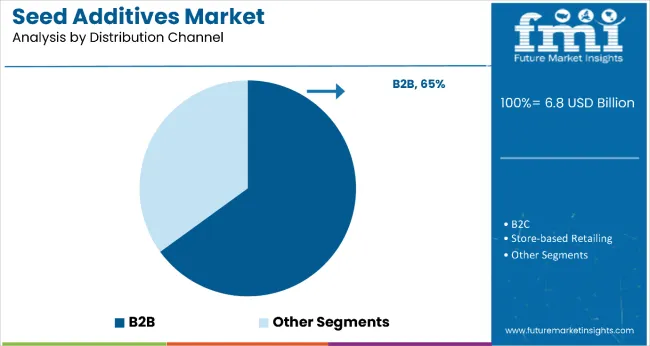
By Distribution Channel, B2B Accounts for 65% of the Market Share

Seed Additives Market By Distribution Type

The B2B distribution channel holds a commanding 65% share in the seed additives market, primarily dueto its integration with commercial seed processors, agribusiness conglomerates, and cooperatives. These bulk transactions often involve custom formulations aligned with regional agronomy, seed genetics, and soil conditions, ensuring tailored additive applications at scale.

B2B models enable efficient downstream packaging, branding, and distribution by seed companies, making them the backbone of the seed enhancement industry. Major additive manufacturers maintain exclusive partnerships with seed producers to supply proprietary blends optimized for specific crops and geographies.

Despite the rise of online retail and direct-to-farmer marketing, the B2B segment is expected to maintain dominance due to its volume throughput, technological integration, and critical role in industrial seed supply chains.

What are the Drivers, Restraints, and Key Trends of the Seed Additives Market?

From 2025 to 2035, seed additive manufacturers are realigning strategies to support climate-resilient and precision farming. By integrating AI-driven agronomy platforms, custom seed treatment packages, and advanced input portfolios, companies aim to strengthen their value propositions. Brands offering proven biological efficacy, regulatory compliance, and tailored solutions are expected to lead in this evolving ecosystem.

Sustainability-Driven Demand Supports Growth

The transition toward sustainable agricultural practices remains a key driver for seed additive adoption. Additives such as polymers, bio stimulants, and micronutrients enhance germination, seedling vigor, and resistance to drought and disease, which are critical factors in climate-sensitive regions. Increased reliance on hybrid and treated seeds across cereals, oilseeds, and vegetables further expands demand. Government initiatives promoting eco-friendly inputs and regenerative farming methods accelerate additive integration among both commercial and smallholder farmers.

Regulatory Complexity and Storage Limitations Restrain Adoption

Despite strong potential, growth is restricted by inconsistent global regulations for biological and nano-additives, resulting in prolonged approval timelines and trade complexities. Storage sensitivity, particularly in microbial-based additives, poses challenges due to limited shelf life and the lack of cold-chain infrastructure in several regions. Price sensitivity and low awareness among farmers in emerging markets also hinder adoption, particularly within direct-to-farmer distribution channels.

Innovation and Regulatory Shifts Create Opportunity

The growing preference for natural and bio-based additives stimulates innovation in microbial formulations, encapsulation technologies, and seed coating solutions. Stricter pesticide regulations in regions such as Europe and Asia accelerate the shift toward biological seed treatments. Companies investing in integrated delivery systems and providing field-level advisory services are gaining early-mover advantages and strengthening their competitive edge in a rapidly evolving market landscape.
Analysis of the Seed Additives Market by Key Countries

Country Wise Analysis Of Seed Additives Market

Country CAGR (2025 to 2035)
USA 6%
Germany 5.8%
France 5.2%
Japan 4.9%
UK 4.8%

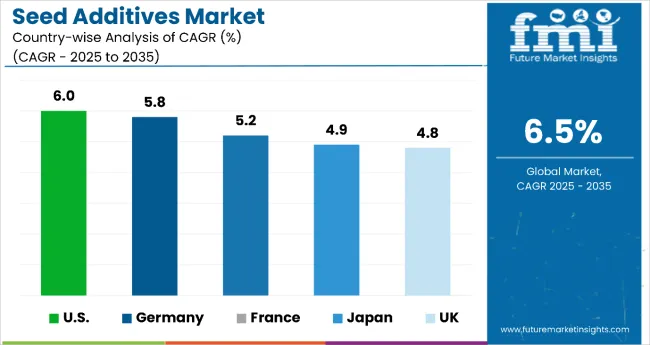
Between 2025 and 2035, the USA is projected to lead the seed additives market with a 6.0% CAGR, driven by large-scale commercial farming and rising adoption of biological additives. Germany follows closely at 5.8%, supported by precision agriculture practices and advanced seed technology standards. France is expected to grow at 5.2%, bolstered by eco-friendly innovations and strong seed export activities. Japan, at 4.9%, is witnessing increased demand in urban farming and high-value crop sectors. The UK, with a 4.8% CAGR, is advancing due to post-Brexit sustainability incentives and growing use of microbial coatings in weather-challenged environments.

The report includes an in-depth analysis of 40+ countries; five top-performing OECD countries are highlighted below.

Demand Forecast for Seed Additives in the United States

The USA seed additives market is projected to grow at a 6.0% CAGR, supported by large-scale commercial farming, strong demand for hybrid seeds, and increasing adoption of biological additives. USA-based agri-business leaders are expanding investments in advanced seed enhancement technologies to comply with USDA-backed regenerative agriculture programs.

  • Corn and soybean cultivation drives extensive use of polymers and active ingredients.
  • Advanced precision farming tools integrate effectively with coated and pelleted seed products.
  • Biologically derived seed coatings are gaining traction in organic and conventional farming systems.

Future Outlook of the Seed Additives Market in the United Kingdom

The seed additives market in the UK is expected to expand at a 4.8% CAGR, backed by rising interest in eco-friendly inputs and strong adoption of certified seed enhancement protocols. UK farmers are increasingly incorporating mineral-based additives and microbial coatings to manage yield variability under unpredictable weather conditions.

  • Agroecological transition and post-Brexit subsidy reforms accelerate biological additive adoption.
  • Demand is growing for pelleted and polymer-treated seeds in horticultural and oilseed crops.
  • Regulatory incentives promote low-residue, EU-compliant seed treatment innovations.

Growth Analysis of the Seed Additives Market in Germany

Germany is forecast to grow at a 5.8% CAGR, driven by its commitment to climate-resilient agriculture and stringent seed technology standards. German seed producers are integrating colorants, polymers, and active ingredients into advanced pest and nutrient management systems.

  • High adoption of precision seed drills is increasing the need for uniform seed coatings.
  • Colorants and polymers dominate to ensure traceability and support mechanical sowing.
  • Demand for microbial inoculants is growing in organic and regenerative farming sectors.

Growth Outlook of the Seed Additives Market in France

Seed additive sales in France are projected to rise at a 5.2% CAGR, supported by a robust seed export sector and significant investments in R&D for coating technologies. French cooperatives and agri-tech firms are introducing active ingredient blends designed to enhance germination and early root development.

  • Oilseed rape and wheat farming drive additive demand to address climatic stress resistance.
  • Strategic emphasis on eco-friendly seed coatings aligns with EU Farm to Fork objectives.
  • Local players are introducing customized blends tailored to regional soil profiles and crop types.

Demand Forecast for Seed Additives in Japan

The seed additives market in Japan is expected to grow at a 4.9% CAGR, fueled by rising demand for high-quality seeds in protected agriculture and urban farming systems. Japanese seed producers focus on uniformity, seed hygiene, and compact additive formulations suited for precision-controlled environments.

  • Pellets and polymer coatings dominate in high-value crops such as vegetables and ornamentals.
  • Growing demand for additives compatible with robotic and hydroponic sowing systems.
  • Regulatory compliance and traceability drive the use of colorants and low-toxicity protectants.

Competitive Landscape of the Seed Additives Market

The global seed additives market is moderately fragmented, led by BASF SE and Bayer AG, which together account for a significant share of global revenues. BASF SE maintains leadership through its comprehensive seed coating systems, micronutrient blends, and consistent investment in field-ready technologies that enhance yield and ensure regulatory compliance across major crop categories.

Dominant player status is shared between BASF SE and Bayer AG. Other major participants include Corteva Agriscience, Clariant AG, and Croda International Plc, each offering specialized additive technologies such as biologicals, surfactants, binders, and seed colorants tailored to diverse agroclimatic zones and crop types. Corteva emphasizes rhizosphere-enhancing microbial additives, while Croda focuses on eco-friendly coating agents with low environmental impact.

Clariant AG holds a strong position in seed colorants and polymers, benefiting from its expertise in pigments and specialty chemicals. Croda's natural surfactant platforms and Clariant's binder systems cater to the growing demand for bio-compatible, residue-free coatings, particularly in Europe and Latin America.

Emerging players such as Pivot Bio, Groundwork Bio Ag, and Verdesian Life Sciences are gaining traction by offering biological alternatives to traditional synthetic additives. These companies leverage microbial innovations and carbon-smart technologies to attract regenerative agriculture proponents and organic-certified seed producers.

Market growth is supported by increasing adoption of seed enhancement technologies, government-backed sustainable farming programs, and stricter agrochemical regulations. Leading firms are advancing through licensing agreements, targeted mergers and acquisitions, and joint ventures with seed companies to co-develop additive-integrated varieties. Competitive differentiation increasingly depends on biological efficacy, regulatory adaptability, and compatibility with precision seed treatment systems.

Key Developments in Seed Additives Market

Bayer is accelerating innovation in seed-applied technologies with biological seed treatment products like JumpStart® and ProStablish®. These products for wheat have demonstrated yield increases of more than 3% through enhanced nutrient uptake and seedling vigor.

Chromatech specializes in seed coating colorants compliant with US EPA regulations (40 CFR Part 180). Their colorants for seed coatings are microplastic-free and APEO-free, designed to be used with fungicides, insecticides, biologicals, and inoculants.

Scope of the Report

Item Value
Quantitative Units USD 6.8 Billion
Type Polymers, Pellets, Colorants, Minerals/Pumice, Active Ingredients, and Other Additives
Crop Type Oilseed & Pulses, Cereals & Grains, Vegetables, Flowers & Ornamentals, and Others
Distribution Channel B2B, B2C, Store-based Retailing (Hypermarkets/Supermarkets, Convenience Stores, Discount Stores, Independent Small Groceries), and Online Retailing
Key Country United States, Canada, United Kingdom, Germany, France, China, Japan, South Korea, Brazil, Australia, and 40+ countries
Regions Covered North America, Europe, Asia-Pacific, Latin America, Middle East & Africa
Key Companies Profiled BASF SE, Bayer Crop Science AG, Precision Laboratories LLC, Clariant International, Incotec Group B.V., Chemtura Corporation, and Chroma tech Incorporated
Additional Attributes Dollar sales by additive type and crop segment, adoption trends across B2B and B2C channels, regulatory impact analysis, innovation in biologicals and sustainable coatings, regional performance mapping across USA farming zones

Key Segmentation

By Type:

  • Polymers
  • Pellets
  • Colorants
  • Minerals/Pumice
  • Active Ingredients
  • Other Additives

By Crop Type:

  • Oilseed & Pulses
  • Cereals & Grains
  • Vegetables
  • Flowers & Ornamentals
  • Others

By Distribution Channel:

  • B2B
  • B2C
  • Store-based Retailing
  • Hypermarkets/Supermarkets
  • Convenience Stores
  • Discount Stores
  • Independent Small Groceries
  • Online Retailing

Table of Content

  1. Executive Summary
    • Global Market Outlook
    • Demand-side Trends
    • Supply-side Trends
    • Technology Roadmap Analysis
    • Analysis and Recommendations
  2. Market Overview
    • Market Coverage / Taxonomy
    • Market Definition / Scope / Limitations
  3. Market Background
    • Market Dynamics
      • Drivers
      • Restraints
      • Opportunity
      • Trends
    • Scenario Forecast
      • Demand in Optimistic Scenario
      • Demand in Likely Scenario
      • Demand in Conservative Scenario
    • Opportunity Map Analysis
    • Product Life Cycle Analysis
    • Supply Chain Analysis
      • Supply Side Participants and their Roles
        • Producers
        • Mid-Level Participants (Traders/ Agents/ Brokers)
        • Wholesalers and Distributors
      • Value Added and Value Created at Node in the Supply Chain
      • List of Raw Material Suppliers
      • List of Existing and Potential Buyer’s
    • Investment Feasibility Matrix
    • Value Chain Analysis
      • Profit Margin Analysis
      • Wholesalers and Distributors
      • Retailers
    • PESTLE and Porter’s Analysis
    • Regulatory Landscape
      • By Key Regions
      • By Key Countries
    • Regional Parent Market Outlook
    • Production and Consumption Statistics
    • Import and Export Statistics
  4. Global Market Analysis 2020 to 2024 and Forecast, 2025 to 2035
    • Historical Market Size Value (USD Billion) & Volume (Metric Tons) Analysis, 2020 to 2024
    • Current and Future Market Size Value (USD Billion) & Volume (Metric Tons) Projections, 2025 to 2035
      • Y-o-Y Growth Trend Analysis
      • Absolute $ Opportunity Analysis
  5. Global Market Pricing Analysis 2020 to 2024 and Forecast 2025 to 2035
  6. Global Market Analysis 2020 to 2024 and Forecast 2025 to 2035, By Type
    • Introduction / Key Findings
    • Historical Market Size Value (USD Billion) & Volume (Metric Tons) Analysis By Type, 2020 to 2024
    • Current and Future Market Size Value (USD Billion) & Volume (Metric Tons) Analysis and Forecast By Type, 2025 to 2035
      • Polymers
      • Pellets
      • Colorants
      • Minerals/Pumice
      • Active Ingredients
      • Other Additives
    • Y-o-Y Growth Trend Analysis By Type, 2020 to 2024
    • Absolute $ Opportunity Analysis By Type, 2025 to 2035
  7. Global Market Analysis 2020 to 2024 and Forecast 2025 to 2035, By Crop Type
    • Introduction / Key Findings
    • Historical Market Size Value (USD Billion) & Volume (Metric Tons) Analysis By Crop Type, 2020 to 2024
    • Current and Future Market Size Value (USD Billion) & Volume (Metric Tons) Analysis and Forecast By Crop Type, 2025 to 2035
      • Oilseed & Pulses
      • Cereals & Grains
      • Vegetables
      • Flowers & Ornamentals
      • Others
    • Y-o-Y Growth Trend Analysis By Crop Type, 2020 to 2024
    • Absolute $ Opportunity Analysis By Crop Type, 2025 to 2035
  8. Global Market Analysis 2020 to 2024 and Forecast 2025 to 2035, By Distribution Channel
    • Introduction / Key Findings
    • Historical Market Size Value (USD Billion) & Volume (Metric Tons) Analysis By Distribution Channel, 2020 to 2024
    • Current and Future Market Size Value (USD Billion) & Volume (Metric Tons) Analysis and Forecast By Distribution Channel, 2025 to 2035
      • B2B
      • B2C
      • Store-based Retailing
      • Hypermarkets/Supermarkets
      • Convenience Stores
      • Discount Stores
      • Independent Small Groceries
      • Online Retailing
    • Y-o-Y Growth Trend Analysis By Distribution Channel, 2020 to 2024
    • Absolute $ Opportunity Analysis By Distribution Channel, 2025 to 2035
  9. Global Market Analysis 2020 to 2024 and Forecast 2025 to 2035, By Region
    • Introduction
    • Historical Market Size Value (USD Billion) & Volume (Metric Tons) Analysis By Region, 2020 to 2024
    • Current Market Size Value (USD Billion) & Volume (Metric Tons) Analysis and Forecast By Region, 2025 to 2035
      • North America
      • Latin America
      • Western Europe
      • Eastern Europe
      • East Asia
      • South Asia & Pacific
      • Middle East and Africa
    • Market Attractiveness Analysis By Region
  10. North America Market Analysis 2020 to 2024 and Forecast 2025 to 2035, By Country
    • Historical Market Size Value (USD Billion) & Volume (Metric Tons) Trend Analysis By Market Taxonomy, 2020 to 2024
    • Market Size Value (USD Billion) & Volume (Metric Tons) Forecast By Market Taxonomy, 2025 to 2035
      • By Country
        • USA
        • Canada
        • Mexico
      • By Type
      • By Crop Type
      • By Distribution Channel
    • Market Attractiveness Analysis
      • By Country
      • By Type
      • By Crop Type
      • By Distribution Channel
    • Key Takeaways
  11. Latin America Market Analysis 2020 to 2024 and Forecast 2025 to 2035, By Country
    • Historical Market Size Value (USD Billion) & Volume (Metric Tons) Trend Analysis By Market Taxonomy, 2020 to 2024
    • Market Size Value (USD Billion) & Volume (Metric Tons) Forecast By Market Taxonomy, 2025 to 2035
      • By Country
        • Brazil
        • Argentina
        • Rest of LATAM
      • By Type
      • By Crop Type
      • By Distribution Channel
    • Market Attractiveness Analysis
      • By Country
      • By Type
      • By Crop Type
      • By Distribution Channel
    • Key Takeaways
  12. Western Europe Market Analysis 2020 to 2024 and Forecast 2025 to 2035, By Country
    • Historical Market Size Value (USD Billion) & Volume (Metric Tons) Trend Analysis By Market Taxonomy, 2020 to 2024
    • Market Size Value (USD Billion) & Volume (Metric Tons) Forecast By Market Taxonomy, 2025 to 2035
      • By Country
        • Germany
        • Italy
        • France
        • UK
        • Spain
        • BENELUX
        • Nordic
        • Rest of W.Europe
      • By Type
      • By Crop Type
      • By Distribution Channel
    • Market Attractiveness Analysis
      • By Country
      • By Type
      • By Crop Type
      • By Distribution Channel
    • Key Takeaways
  13. Eastern Europe Market Analysis 2020 to 2024 and Forecast 2025 to 2035, By Country
    • Historical Market Size Value (USD Billion) & Volume (Metric Tons) Trend Analysis By Market Taxonomy, 2020 to 2024
    • Market Size Value (USD Billion) & Volume (Metric Tons) Forecast By Market Taxonomy, 2025 to 2035
      • By Country
        • Russia
        • Hungary
        • Poland
        • Balkan & Baltics
        • Rest of E. Europe
      • By Type
      • By Crop Type
      • By Distribution Channel
    • Market Attractiveness Analysis
      • By Country
      • By Type
      • By Crop Type
      • By Distribution Channel
    • Key Takeaways
  14. East Asia Market Analysis 2020 to 2024 and Forecast 2025 to 2035, By Country
    • Historical Market Size Value (USD Billion) & Volume (Metric Tons) Trend Analysis By Market Taxonomy, 2020 to 2024
    • Market Size Value (USD Billion) & Volume (Metric Tons) Forecast By Market Taxonomy, 2025 to 2035
      • By Country
        • China
        • Japan
        • South Korea
      • By Type
      • By Crop Type
      • By Distribution Channel
    • Market Attractiveness Analysis
      • By Country
      • By Type
      • By Crop Type
      • By Distribution Channel
    • Key Takeaways
  15. South Asia & Pacific Market Analysis 2020 to 2024 and Forecast 2025 to 2035, By Country
    • Historical Market Size Value (USD Billion) & Volume (Metric Tons) Trend Analysis By Market Taxonomy, 2020 to 2024
    • Market Size Value (USD Billion) & Volume (Metric Tons) Forecast By Market Taxonomy, 2025 to 2035
      • By Country
        • India
        • Australia & New Zealand
        • ASEAN
        • Rest of SAP
      • By Type
      • By Crop Type
      • By Distribution Channel
    • Market Attractiveness Analysis
      • By Country
      • By Type
      • By Crop Type
      • By Distribution Channel
    • Key Takeaways
  16. Middle East and Africa Market Analysis 2020 to 2024 and Forecast 2025 to 2035, By Country
    • Historical Market Size Value (USD Billion) & Volume (Metric Tons) Trend Analysis By Market Taxonomy, 2020 to 2024
    • Market Size Value (USD Billion) & Volume (Metric Tons) Forecast By Market Taxonomy, 2025 to 2035
      • By Country
        • GCC Countries
        • Northern Africa
        • South Africa
        • Turkiye
        • Rest of MEA
      • By Type
      • By Crop Type
      • By Distribution Channel
    • Market Attractiveness Analysis
      • By Country
      • By Type
      • By Crop Type
      • By Distribution Channel
    • Key Takeaways
  17. Key Countries Market Analysis
    • USA
      • Pricing Analysis
      • Market Share Analysis, 2024
        • By Type
        • By Crop Type
        • By Distribution Channel
    • Canada
      • Pricing Analysis
      • Market Share Analysis, 2024
        • By Type
        • By Crop Type
        • By Distribution Channel
    • Brazil
      • Pricing Analysis
      • Market Share Analysis, 2024
        • By Type
        • By Crop Type
        • By Distribution Channel
    • Mexico
      • Pricing Analysis
      • Market Share Analysis, 2024
        • By Type
        • By Crop Type
        • By Distribution Channel
    • Argentina
      • Pricing Analysis
      • Market Share Analysis, 2024
        • By Type
        • By Crop Type
        • By Distribution Channel
  18. Market Structure Analysis
    • Competition Dashboard
    • Competition Benchmarking
    • Market Share Analysis of Top Players
      • By Regional
      • By Type
      • By Crop Type
      • By Distribution Channel
  19. Competition Analysis
    • Competition Deep Dive
      • BASF SE
        • Overview
        • Product Portfolio
        • Profitability by Market Segments (Product/Age /Sales Channel/Region)
        • Sales Footprint
        • Strategy Overview
          • Marketing Strategy
          • Product Strategy
          • Channel Strategy
      • Bayer Cropscience AG
        • Overview
        • Product Portfolio
        • Profitability by Market Segments (Product/Age /Sales Channel/Region)
        • Sales Footprint
        • Strategy Overview
          • Marketing Strategy
          • Product Strategy
          • Channel Strategy
      • Precision Laboratories LLC
        • Overview
        • Product Portfolio
        • Profitability by Market Segments (Product/Age /Sales Channel/Region)
        • Sales Footprint
        • Strategy Overview
          • Marketing Strategy
          • Product Strategy
          • Channel Strategy
      • Clariant International
        • Overview
        • Product Portfolio
        • Profitability by Market Segments (Product/Age /Sales Channel/Region)
        • Sales Footprint
        • Strategy Overview
          • Marketing Strategy
          • Product Strategy
          • Channel Strategy
      • Incotec Group B.v
        • Overview
        • Product Portfolio
        • Profitability by Market Segments (Product/Age /Sales Channel/Region)
        • Sales Footprint
        • Strategy Overview
          • Marketing Strategy
          • Product Strategy
          • Channel Strategy
      • Chemtura Corporation
        • Overview
        • Product Portfolio
        • Profitability by Market Segments (Product/Age /Sales Channel/Region)
        • Sales Footprint
        • Strategy Overview
          • Marketing Strategy
          • Product Strategy
          • Channel Strategy
      • Chromatech Incorporated
        • Overview
        • Product Portfolio
        • Profitability by Market Segments (Product/Age /Sales Channel/Region)
        • Sales Footprint
        • Strategy Overview
          • Marketing Strategy
          • Product Strategy
          • Channel Strategy
  20. Assumptions & Acronyms Used
  21. Research Methodology

List of Tables

  • Table 1: Global Market Value (USD Billion) Forecast by Region, 2020 to 2035
  • Table 2: Global Market Volume (Metric Tons) Forecast by Region, 2020 to 2035
  • Table 3: Global Market Value (USD Billion) Forecast by Type, 2020 to 2035
  • Table 4: Global Market Volume (Metric Tons) Forecast by Type, 2020 to 2035
  • Table 5: Global Market Value (USD Billion) Forecast by Crop Type, 2020 to 2035
  • Table 6: Global Market Volume (Metric Tons) Forecast by Crop Type, 2020 to 2035
  • Table 7: Global Market Value (USD Billion) Forecast by Distribution Channel, 2020 to 2035
  • Table 8: Global Market Volume (Metric Tons) Forecast by Distribution Channel, 2020 to 2035
  • Table 9: North America Market Value (USD Billion) Forecast by Country, 2020 to 2035
  • Table 10: North America Market Volume (Metric Tons) Forecast by Country, 2020 to 2035
  • Table 11: North America Market Value (USD Billion) Forecast by Type, 2020 to 2035
  • Table 12: North America Market Volume (Metric Tons) Forecast by Type, 2020 to 2035
  • Table 13: North America Market Value (USD Billion) Forecast by Crop Type, 2020 to 2035
  • Table 14: North America Market Volume (Metric Tons) Forecast by Crop Type, 2020 to 2035
  • Table 15: North America Market Value (USD Billion) Forecast by Distribution Channel, 2020 to 2035
  • Table 16: North America Market Volume (Metric Tons) Forecast by Distribution Channel, 2020 to 2035
  • Table 17: Latin America Market Value (USD Billion) Forecast by Country, 2020 to 2035
  • Table 18: Latin America Market Volume (Metric Tons) Forecast by Country, 2020 to 2035
  • Table 19: Latin America Market Value (USD Billion) Forecast by Type, 2020 to 2035
  • Table 20: Latin America Market Volume (Metric Tons) Forecast by Type, 2020 to 2035
  • Table 21: Latin America Market Value (USD Billion) Forecast by Crop Type, 2020 to 2035
  • Table 22: Latin America Market Volume (Metric Tons) Forecast by Crop Type, 2020 to 2035
  • Table 23: Latin America Market Value (USD Billion) Forecast by Distribution Channel, 2020 to 2035
  • Table 24: Latin America Market Volume (Metric Tons) Forecast by Distribution Channel, 2020 to 2035
  • Table 25: Western Europe Market Value (USD Billion) Forecast by Country, 2020 to 2035
  • Table 26: Western Europe Market Volume (Metric Tons) Forecast by Country, 2020 to 2035
  • Table 27: Western Europe Market Value (USD Billion) Forecast by Type, 2020 to 2035
  • Table 28: Western Europe Market Volume (Metric Tons) Forecast by Type, 2020 to 2035
  • Table 29: Western Europe Market Value (USD Billion) Forecast by Crop Type, 2020 to 2035
  • Table 30: Western Europe Market Volume (Metric Tons) Forecast by Crop Type, 2020 to 2035
  • Table 31: Western Europe Market Value (USD Billion) Forecast by Distribution Channel, 2020 to 2035
  • Table 32: Western Europe Market Volume (Metric Tons) Forecast by Distribution Channel, 2020 to 2035
  • Table 33: Eastern Europe Market Value (USD Billion) Forecast by Country, 2020 to 2035
  • Table 34: Eastern Europe Market Volume (Metric Tons) Forecast by Country, 2020 to 2035
  • Table 35: Eastern Europe Market Value (USD Billion) Forecast by Type, 2020 to 2035
  • Table 36: Eastern Europe Market Volume (Metric Tons) Forecast by Type, 2020 to 2035
  • Table 37: Eastern Europe Market Value (USD Billion) Forecast by Crop Type, 2020 to 2035
  • Table 38: Eastern Europe Market Volume (Metric Tons) Forecast by Crop Type, 2020 to 2035
  • Table 39: Eastern Europe Market Value (USD Billion) Forecast by Distribution Channel, 2020 to 2035
  • Table 40: Eastern Europe Market Volume (Metric Tons) Forecast by Distribution Channel, 2020 to 2035
  • Table 41: East Asia Market Value (USD Billion) Forecast by Country, 2020 to 2035
  • Table 42: East Asia Market Volume (Metric Tons) Forecast by Country, 2020 to 2035
  • Table 43: East Asia Market Value (USD Billion) Forecast by Type, 2020 to 2035
  • Table 44: East Asia Market Volume (Metric Tons) Forecast by Type, 2020 to 2035
  • Table 45: East Asia Market Value (USD Billion) Forecast by Crop Type, 2020 to 2035
  • Table 46: East Asia Market Volume (Metric Tons) Forecast by Crop Type, 2020 to 2035
  • Table 47: East Asia Market Value (USD Billion) Forecast by Distribution Channel, 2020 to 2035
  • Table 48: East Asia Market Volume (Metric Tons) Forecast by Distribution Channel, 2020 to 2035
  • Table 49: South Asia & Pacific Market Value (USD Billion) Forecast by Country, 2020 to 2035
  • Table 50: South Asia & Pacific Market Volume (Metric Tons) Forecast by Country, 2020 to 2035
  • Table 51: South Asia & Pacific Market Value (USD Billion) Forecast by Type, 2020 to 2035
  • Table 52: South Asia & Pacific Market Volume (Metric Tons) Forecast by Type, 2020 to 2035
  • Table 53: South Asia & Pacific Market Value (USD Billion) Forecast by Crop Type, 2020 to 2035
  • Table 54: South Asia & Pacific Market Volume (Metric Tons) Forecast by Crop Type, 2020 to 2035
  • Table 55: South Asia & Pacific Market Value (USD Billion) Forecast by Distribution Channel, 2020 to 2035
  • Table 56: South Asia & Pacific Market Volume (Metric Tons) Forecast by Distribution Channel, 2020 to 2035
  • Table 57: Middle East and Africa Market Value (USD Billion) Forecast by Country, 2020 to 2035
  • Table 58: Middle East and Africa Market Volume (Metric Tons) Forecast by Country, 2020 to 2035
  • Table 59: Middle East and Africa Market Value (USD Billion) Forecast by Type, 2020 to 2035
  • Table 60: Middle East and Africa Market Volume (Metric Tons) Forecast by Type, 2020 to 2035
  • Table 61: Middle East and Africa Market Value (USD Billion) Forecast by Crop Type, 2020 to 2035
  • Table 62: Middle East and Africa Market Volume (Metric Tons) Forecast by Crop Type, 2020 to 2035
  • Table 63: Middle East and Africa Market Value (USD Billion) Forecast by Distribution Channel, 2020 to 2035
  • Table 64: Middle East and Africa Market Volume (Metric Tons) Forecast by Distribution Channel, 2020 to 2035

List of Figures

  • Figure 1: Global Market Volume (Metric Tons) Forecast 2020 to 2035
  • Figure 2: Global Market Pricing Analysis
  • Figure 3: Global Market Value (USD Billion) Forecast 2020 to 2035
  • Figure 4: Global Market Value Share and BPS Analysis by Type, 2025 and 2035
  • Figure 5: Global Market Y-o-Y Growth Comparison by Type, 2025 to 2035
  • Figure 6: Global Market Attractiveness Analysis by Type
  • Figure 7: Global Market Value Share and BPS Analysis by Crop Type, 2025 and 2035
  • Figure 8: Global Market Y-o-Y Growth Comparison by Crop Type, 2025 to 2035
  • Figure 9: Global Market Attractiveness Analysis by Crop Type
  • Figure 10: Global Market Value Share and BPS Analysis by Distribution Channel, 2025 and 2035
  • Figure 11: Global Market Y-o-Y Growth Comparison by Distribution Channel, 2025 to 2035
  • Figure 12: Global Market Attractiveness Analysis by Distribution Channel
  • Figure 13: Global Market Value (USD Billion) Share and BPS Analysis by Region, 2025 and 2035
  • Figure 14: Global Market Y-o-Y Growth Comparison by Region, 2025 to 2035
  • Figure 15: Global Market Attractiveness Analysis by Region
  • Figure 16: North America Market Incremental $ Opportunity, 2025 to 2035
  • Figure 17: Latin America Market Incremental $ Opportunity, 2025 to 2035
  • Figure 18: Western Europe Market Incremental $ Opportunity, 2025 to 2035
  • Figure 19: Eastern Europe Market Incremental $ Opportunity, 2025 to 2035
  • Figure 20: East Asia Market Incremental $ Opportunity, 2025 to 2035
  • Figure 21: South Asia & Pacific Market Incremental $ Opportunity, 2025 to 2035
  • Figure 22: Middle East and Africa Market Incremental $ Opportunity, 2025 to 2035
  • Figure 23: North America Market Value Share and BPS Analysis by Country, 2025 and 2035
  • Figure 24: North America Market Value Share and BPS Analysis by Type, 2025 and 2035
  • Figure 25: North America Market Y-o-Y Growth Comparison by Type, 2025 to 2035
  • Figure 26: North America Market Attractiveness Analysis by Type
  • Figure 27: North America Market Value Share and BPS Analysis by Crop Type, 2025 and 2035
  • Figure 28: North America Market Y-o-Y Growth Comparison by Crop Type, 2025 to 2035
  • Figure 29: North America Market Attractiveness Analysis by Crop Type
  • Figure 30: North America Market Value Share and BPS Analysis by Distribution Channel, 2025 and 2035
  • Figure 31: North America Market Y-o-Y Growth Comparison by Distribution Channel, 2025 to 2035
  • Figure 32: North America Market Attractiveness Analysis by Distribution Channel
  • Figure 33: Latin America Market Value Share and BPS Analysis by Country, 2025 and 2035
  • Figure 34: Latin America Market Value Share and BPS Analysis by Type, 2025 and 2035
  • Figure 35: Latin America Market Y-o-Y Growth Comparison by Type, 2025 to 2035
  • Figure 36: Latin America Market Attractiveness Analysis by Type
  • Figure 37: Latin America Market Value Share and BPS Analysis by Crop Type, 2025 and 2035
  • Figure 38: Latin America Market Y-o-Y Growth Comparison by Crop Type, 2025 to 2035
  • Figure 39: Latin America Market Attractiveness Analysis by Crop Type
  • Figure 40: Latin America Market Value Share and BPS Analysis by Distribution Channel, 2025 and 2035
  • Figure 41: Latin America Market Y-o-Y Growth Comparison by Distribution Channel, 2025 to 2035
  • Figure 42: Latin America Market Attractiveness Analysis by Distribution Channel
  • Figure 43: Western Europe Market Value Share and BPS Analysis by Country, 2025 and 2035
  • Figure 44: Western Europe Market Value Share and BPS Analysis by Type, 2025 and 2035
  • Figure 45: Western Europe Market Y-o-Y Growth Comparison by Type, 2025 to 2035
  • Figure 46: Western Europe Market Attractiveness Analysis by Type
  • Figure 47: Western Europe Market Value Share and BPS Analysis by Crop Type, 2025 and 2035
  • Figure 48: Western Europe Market Y-o-Y Growth Comparison by Crop Type, 2025 to 2035
  • Figure 49: Western Europe Market Attractiveness Analysis by Crop Type
  • Figure 50: Western Europe Market Value Share and BPS Analysis by Distribution Channel, 2025 and 2035
  • Figure 51: Western Europe Market Y-o-Y Growth Comparison by Distribution Channel, 2025 to 2035
  • Figure 52: Western Europe Market Attractiveness Analysis by Distribution Channel
  • Figure 53: Eastern Europe Market Value Share and BPS Analysis by Country, 2025 and 2035
  • Figure 54: Eastern Europe Market Value Share and BPS Analysis by Type, 2025 and 2035
  • Figure 55: Eastern Europe Market Y-o-Y Growth Comparison by Type, 2025 to 2035
  • Figure 56: Eastern Europe Market Attractiveness Analysis by Type
  • Figure 57: Eastern Europe Market Value Share and BPS Analysis by Crop Type, 2025 and 2035
  • Figure 58: Eastern Europe Market Y-o-Y Growth Comparison by Crop Type, 2025 to 2035
  • Figure 59: Eastern Europe Market Attractiveness Analysis by Crop Type
  • Figure 60: Eastern Europe Market Value Share and BPS Analysis by Distribution Channel, 2025 and 2035
  • Figure 61: Eastern Europe Market Y-o-Y Growth Comparison by Distribution Channel, 2025 to 2035
  • Figure 62: Eastern Europe Market Attractiveness Analysis by Distribution Channel
  • Figure 63: East Asia Market Value Share and BPS Analysis by Country, 2025 and 2035
  • Figure 64: East Asia Market Value Share and BPS Analysis by Type, 2025 and 2035
  • Figure 65: East Asia Market Y-o-Y Growth Comparison by Type, 2025 to 2035
  • Figure 66: East Asia Market Attractiveness Analysis by Type
  • Figure 67: East Asia Market Value Share and BPS Analysis by Crop Type, 2025 and 2035
  • Figure 68: East Asia Market Y-o-Y Growth Comparison by Crop Type, 2025 to 2035
  • Figure 69: East Asia Market Attractiveness Analysis by Crop Type
  • Figure 70: East Asia Market Value Share and BPS Analysis by Distribution Channel, 2025 and 2035
  • Figure 71: East Asia Market Y-o-Y Growth Comparison by Distribution Channel, 2025 to 2035
  • Figure 72: East Asia Market Attractiveness Analysis by Distribution Channel
  • Figure 73: South Asia & Pacific Market Value Share and BPS Analysis by Country, 2025 and 2035
  • Figure 74: South Asia & Pacific Market Value Share and BPS Analysis by Type, 2025 and 2035
  • Figure 75: South Asia & Pacific Market Y-o-Y Growth Comparison by Type, 2025 to 2035
  • Figure 76: South Asia & Pacific Market Attractiveness Analysis by Type
  • Figure 77: South Asia & Pacific Market Value Share and BPS Analysis by Crop Type, 2025 and 2035
  • Figure 78: South Asia & Pacific Market Y-o-Y Growth Comparison by Crop Type, 2025 to 2035
  • Figure 79: South Asia & Pacific Market Attractiveness Analysis by Crop Type
  • Figure 80: South Asia & Pacific Market Value Share and BPS Analysis by Distribution Channel, 2025 and 2035
  • Figure 81: South Asia & Pacific Market Y-o-Y Growth Comparison by Distribution Channel, 2025 to 2035
  • Figure 82: South Asia & Pacific Market Attractiveness Analysis by Distribution Channel
  • Figure 83: Middle East and Africa Market Value Share and BPS Analysis by Country, 2025 and 2035
  • Figure 84: Middle East and Africa Market Value Share and BPS Analysis by Type, 2025 and 2035
  • Figure 85: Middle East and Africa Market Y-o-Y Growth Comparison by Type, 2025 to 2035
  • Figure 86: Middle East and Africa Market Attractiveness Analysis by Type
  • Figure 87: Middle East and Africa Market Value Share and BPS Analysis by Crop Type, 2025 and 2035
  • Figure 88: Middle East and Africa Market Y-o-Y Growth Comparison by Crop Type, 2025 to 2035
  • Figure 89: Middle East and Africa Market Attractiveness Analysis by Crop Type
  • Figure 90: Middle East and Africa Market Value Share and BPS Analysis by Distribution Channel, 2025 and 2035
  • Figure 91: Middle East and Africa Market Y-o-Y Growth Comparison by Distribution Channel, 2025 to 2035
  • Figure 92: Middle East and Africa Market Attractiveness Analysis by Distribution Channel
  • Figure 93: Global Market - Tier Structure Analysis
  • Figure 94: Global Market - Company Share Analysis

Frequently Asked Questions

How big is the seed additives market in 2025?

The global seed additives market is estimated to be valued at USD 6.8 billion in 2025.

What will be the size of the seed additives market in 2035?

The market size for the seed additives market is projected to reach USD 12.8 billion by 2035.

How much will the seed additives market grow between 2025 and 2035?

The seed additives market is expected to grow at a 6.5% CAGR between 2025 and 2035.

Which distribution channel will dominate the seed additives market?

The B2B segment is expected to dominate the distribution channel with 65% of the market share in 2025.

Which type segment will contribute a significant share in the seed additives market in 2025?

Polymers are projected to contribute 43% of the market share in seed additives market in 2025.

Explore Similar Insights

Future Market Insights

Seed Additives Market