Seed Treatment Materials Market Outlook and Forecast 2025 to 2035

The global seed treatment materials market is valued at USD 3.3 billion in 2025 and is slated to reach USD 8.5 billion by 2035, reflecting a CAGR of 9.9%. Key factors fueling market growth include increasing demand for high-efficiency seed protection solutions, rising awareness among farmers, and the growing popularity of biological and polymer-based treatment materials.
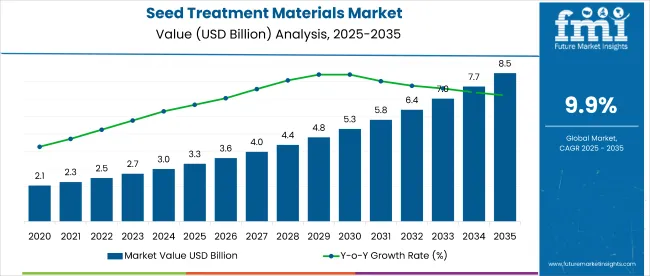
Quick Stats for Seed Treatment Materials Market

  • Value of Market (2025): USD 3.3 billion
  • Projected Value of Market (2035): USD 8.5 billion
  • Forecast CAGR of Market (2025 to 2035): 9.9%
  • Leading Segment by Form of Market (2025): Liquid Form (60% Market Share)
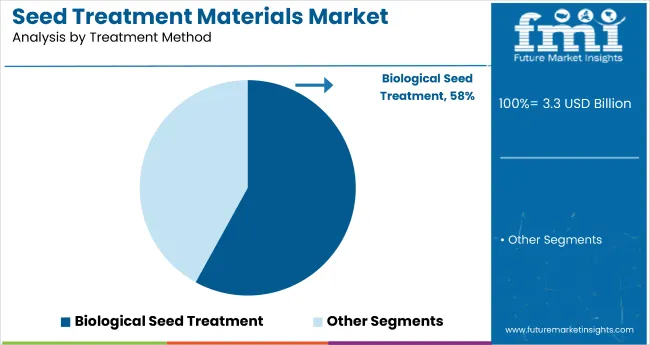
  • Leading Segment by Treatment Method in Market (2025): Biological Seed Treatment (58% Share)
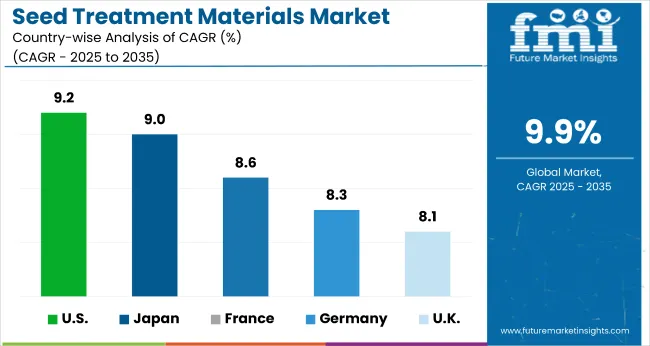
  • Fastest Growing Country in Market (2025): United States (9.2% CAGR)
  • Top Key Players in Market: Corteva Agriscience, Eastman Chemical Company, FMC Corporation, Chromatech Incorporated, Bayer AG, Evonik

Seed Treatment Materials Market Market Value Analysis

Metric Value
Market Size (2025) USD 3.3 billion
Market Size (2035) USD 8.5 billion
CAGR (2025 to 2035) 9.9%

Additionally, the adoption of sustainable agriculture practices and precision farming technologies is expected to support long-term expansion of the seed treatment materials market globally.

The USA is projected to expand at a CAGR of 9.2% through 2035, supported by high agri-tech penetration, seed innovation, and expanding use of digital advisory platforms for farmers. France is expected to grow at a CAGR of 8.6%, driven by rising demand for disease-resistant crops and increased application of biological seed coatings in cereal and vegetable cultivation.

Meanwhile, Germany is anticipated to witness a CAGR of 8.3%, attributed to growing organic farming initiatives and advancements in seed pelleting technologies. In terms of segmentation, liquid form will lead the form segment with a 60% market share, while biological seed treatment to lead the treatment method segment with 58% market share in 2025.

Government regulations are expected to play a pivotal role in shaping the seed treatment materials market between 2025 and 2035. Regulatory bodies such as the USDA and Health Canada enforce stringent standards for the approval, formulation, and commercialization of seed treatment products.

The registration process particularly for biological treatments remains complex and time-intensive, often delaying product launches and increasing development costs. Moreover, differences in regulatory frameworks across regions pose challenges for global companies aiming for simultaneous product approvals, making harmonization difficult.

The market holds a significant position within its parent industries, driven by increasing demand for effective crop protection and sustainable agricultural practices. It accounts for 12% of the crop protection chemicals market, reflecting the growing preference for targeted, seed-applied solutions.

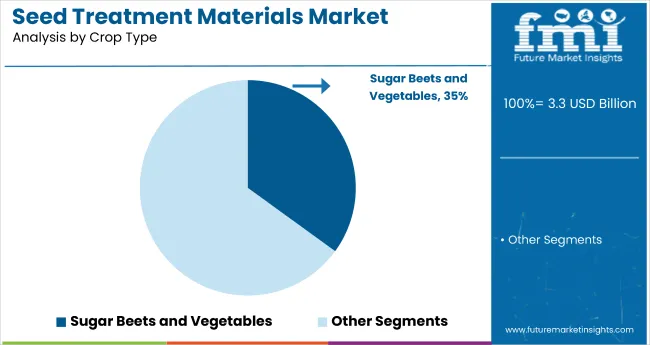
Seed treatments represent about 8%, highlighting their specialized yet important role. In the seed enhancement market, seed treatment materials contribute nearly 35%, given their direct impact on improving seed performance and germination. The overall agricultural inputs sector, the market holds a 6% share, while in the agricultural biotechnology domain, it contributes around 3%, underlining its complementary role in precision agriculture and integrated crop management systems.

Seed Treatment Materials Market Analysis by Top Investment Segments

The global market is segmented by coating type, application, form, treatment method, crop type, and region. By coating type, the market is segmented into seed film coating (matte finish, shine, sparkle), seed encrusting, and seed pelleting.

In terms of application, the market is divided into seed polymers (petrochemical-based polymers, biopolymers), binder & fillers, colourant, seed biologicals (biological inoculant, biocontrols, pheromones, biostimulants), seed protection (insecticides such as thiamethoxam, imidacloprid, carbofuran, and other insecticides), and fungicides (thiram, carbendazim, tebuconazole, carboxin, and others).

Based on form, the market is bifurcated into powder and liquid. By treatment method, the market is segmented into chemical seed treatment, non-chemical seed treatment (biological seed treatment, physical seed treatment), hot water treatment, and dry heat treatment.

Based on crop type, the market is divided into cereals & grains (corn, wheat, rice, sorghum, barley), oilseeds & pulses (soybean, canola, cotton, sunflower), and others such as turfs, forages, alfalfa, and sugar beets & vegetables. Regionally, the market is classified into North America, Latin America, Western Europe, Eastern Europe, South Asia and Pacific, East Asia, and the Middle East & Africa.
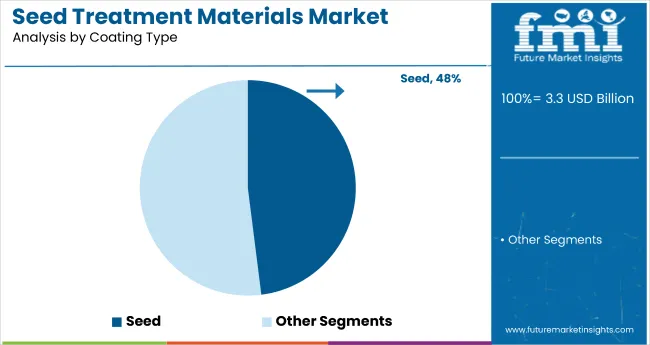
Seed to Lead the Coating Type Segment with 48% Market Share in 2025

Seed Treatment Materials Market Analysis By Coating Type

Seed film coating is projected to hold a 48% market share in the coating type segment in 2025, making it the most lucrative category. This dominance is attributed to its cost-effectiveness, uniform application, and excellent compatibility with a wide range of seed varieties.
  • The growing demand for precision farming and sustainable agricultural practices has further boosted the adoption of seed film coatings, especially in cereals, oilseeds, and vegetable crops.
  • Compared to seed encrusting and pelleting, film coatings offer the advantage of delivering active ingredients such as fungicides, insecticides, and biologicals without significantly increasing seed size.
  • As the market shifts toward biological seed treatments and micronutrient integration, the film coating segment is expected to witness sustained growth, reinforced by technological advancements and broader applications across global agricultural regions.

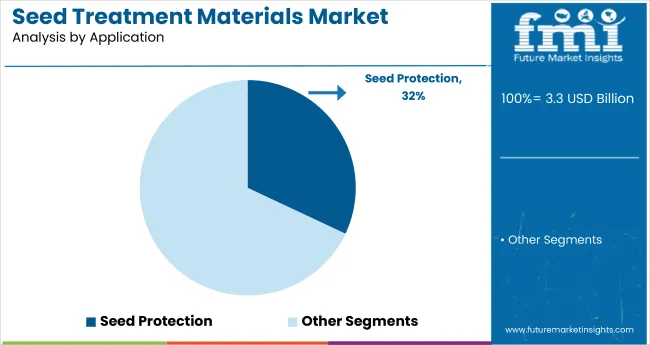
Seed Protection to Dominate the Application Segment with 32% Market Share in 2025

Seed Treatment Materials Market Analysis By Application

Seed protection is expected to dominate the application segment in 2025, accounting for 32% market share in the market. This leading position is driven by rising incidences of pest attacks and the need for enhanced early-stage crop protection to ensure healthy germination and improved yields.
  • Seed protection materials, particularly insecticides such as thiamethoxam, imidacloprid, and carbofuran, are widely adopted due to their proven efficacy against soil-borne and early-season insects. These treatments help minimize the reliance on foliar sprays, promoting precision protection with minimal environmental impact.
  • Furthermore, demand for combination formulations blending insecticides with fungicides or biological agents is accelerating adoption in key agricultural regions. As farmers seek targeted solutions to reduce crop loss, especially in cereals and oilseeds, the seed protection segment is expected to maintain a strong growth trajectory.

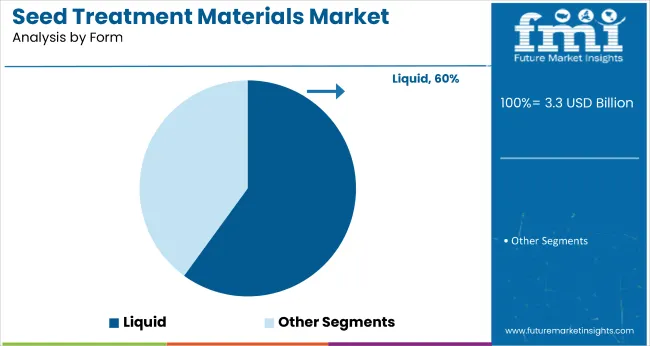
Liquid Form to Lead the Form Segment with 60% Market Share in 2025

Seed Treatment Materials Market Analysis By Form

The liquid form segment is projected to dominate the market by form in 2025, capturing 60% market share. This dominance is primarily attributed to the ease of application, better adhesion to seeds, and compatibility with a wide range of active ingredients, including biologicals and micronutrients.
  • Liquid formulations enable uniform coating, ensuring effective coverage and reducing dust-off, which is a common concern with powders. Moreover, liquid seed treatments are increasingly preferred in large-scale commercial farming due to their efficiency in mechanized seed treatment processes.
  • As precision agriculture gains traction globally, and biological seed treatments continue to rise in demand, the liquid form segment is expected to remain the preferred choice among farmers and manufacturers alike, sustaining its lead well into the forecast period.

Biological Seed Treatment to Lead the Treatment Method Segment with 58% Market Share in 2025

Seed Treatment Materials Market Analysis By Treatment Method

Biological seed treatment is projected to be the most lucrative segment in the treatment method category, expected to hold a 58% market share in 2025. This dominance is driven by the rising adoption of sustainable and eco-friendly farming practices globally.
  • Farmers are increasingly shifting away from synthetic chemicals due to environmental concerns and regulatory pressures, boosting the demand for biological alternatives.
  • Biological treatments offer multiple advantages, including improved soil health, reduced toxicity, and enhanced seedling vigor, which contribute to higher crop yields.
  • With government support for organic agriculture and the integration of biologicals into precision farming systems, this segment is set to experience sustained adoption across major agricultural markets globally.

Sugar Beets & Vegetables to Lead the Crop Type Segment with 35% Market Share in 2025

Seed Treatment Materials Market Analysis By Crop Type

Sugar Beets & Vegetables are projected to be the most lucrative crop type segment, accounting for 35% market share in 2025. This dominance is driven by the high value and sensitivity of these crops, which makes effective seed treatment essential for ensuring strong germination and early-stage protection.

  • Farmers cultivating sugar beets and vegetables rely heavily on advanced seed coatings to enhance resilience against soil-borne pathogens, pests, and abiotic stressors. Biological treatments, micronutrient coatings, and polymer-based seed films are increasingly used in this segment to boost productivity and minimize the need for post-emergence treatments.
  • Additionally, growing demand for clean-label and residue-free produce in premium vegetable and processed food markets is further accelerating the adoption of seed treatment materials.

Top Seed Treatment Materials Market Dynamics

The market is expanding steadily, driven by the rising adoption of sustainable farming practices, increasing demand for high-efficiency seed protection solutions, and growing preference for biological treatments that improve crop resilience and yield.

Recent Trends in the Seed Treatment Materials Market
  • Growing shift toward biological seed treatments to reduce chemical residue in crops.
  • Increased use of combination formulations integrating fungicides, insecticides, and biostimulants.
  • Expansion of seed coating technologies like film coatings for micronutrient delivery.
  • Rise in start-ups offering microbial-based treatments tailored to regional soil conditions.

Challenges in the Seed Treatment Materials Market

  • Regulatory complexity and varied approval processes across countries.
  • High development costs for new biological formulations and seed polymers.
  • Limited awareness among smallholder farmers in developing regions.
  • Competition from low-cost regional players affecting global brand margins.

Analyzing Top Countries Producing and Supplying Seed Treatment Materials

Seed Treatment Materials Market Cagr Analysis By Country

Among the top five countries, the USA leads the market with a CAGR of 9.2%, reflecting strong adoption of advanced ag-tech and biological treatments. Japan follows closely with a 9.0% CAGR, driven by smart farming and urban agriculture initiatives. France is projected at 8.6%, supported by biostimulant use in vineyards.

Germany’s market will grow at 8.3%, backed by EU-compliant eco-agriculture. The UK records the lowest growth among the five at 8.1%, though momentum is increasing due to biocontrols and organic practices. These figures highlight varying national priorities and regulatory influences across developed markets.

The report covers an in-depth analysis of 40+ countries; five top-performing OECD countries are highlighted below.

USA Seed Treatment Materials Analysis

The USA seed treatment materials market is projected to expand at a CAGR of 9.2% from 2025 to 2035, driven by high-tech farming practices and strong R&D investments.

  • High adoption of biological seed treatments in corn and soybean crops.
  • Expansion of ag-tech firms promoting customized seed solutions.
  • Integration of smart seed coating systems with digital farm management.
  • Demand surge in Midwest and Southern crop belts.

Seed Treatment Materials Demand Analysis in the UK

Sales of seed treatment materials in the UK are forecast to grow at a CAGR of 8.1% during 2025 to 2035, reflecting a shift from conventional chemical treatments to organic and bio-based materials.

  • Government incentives for low-chemical seed input practices.
  • High demand for vegetable and sugar beet biological coatings.
  • Shift toward biocontrols and pheromones to meet EU residue limits.
  • Rise in vertical and urban farming techniques using treated seeds.

Seed Treatment Materials Demand Analysis in Germany

Seed treatment materials revenue in Germany is projected to witness a CAGR of 8.3% between 2025 and 2035, with growth anchored in eco-agriculture initiatives and EU Green Deal compliance. participation over the forecast period.

  • Emphasis on fungicide-free biological seed treatment systems.
  • Rising preference for precision seed pelleting in cereals.
  • Technological collaborations between agri-tech firms and research institutes.
  • Strict compliance driving innovation in residue-free seed coatings.

France Seed Treatment Materials Analysis

The French seed treatment materials sales are expected to grow at a CAGR of 8.6% from 2025 to 2035, driven by rising pest concerns and increasing demand for treated seeds in wine grapes, vegetables, and cereals.

  • Uptake of pheromone-based treatments in vineyards.
  • Expansion of sugar beet and alfalfa seed treatment using biostimulants.
  • Farmer cooperatives investing in in-house seed coating facilities.
  • Strong domestic production of plant-based biological agents.

Japan Seed Treatment Materials Analysis

Seed treatment materials demand in Japan is projected to expand at a CAGR of 9.0% between 2025 and 2035, supported by precision agriculture technologies and increasing usage of automated seed coating machinery.
  • High focus on rice and vegetable seed biological treatments.
  • Miniaturized seed pelleting systems suited for compact farms.
  • Research investments in temperature-resistant polymer coatings.
  • Urban agriculture using pre-coated seed packs gaining traction.

Leading Seed Treatment Materials Manufacturers and Suppliers

Seed Treatment Materials Market Analysis By Company

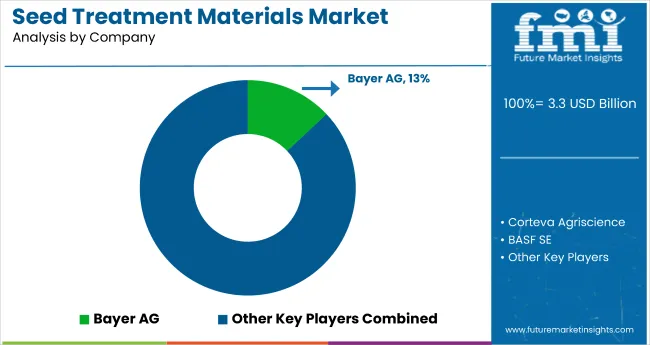
The market is moderately fragmented, with a mix of global agrochemical giants and regionally dominant players competing across product categories such as biologicals, polymers, and seed protection chemicals. Leading firms like Bayer AG, Corteva Agriscience, and BASF SE hold strong positions owing to their extensive R&D capabilities, integrated supply chains, and established seed technologies.

Top-tier companies are actively competing on product innovation, pricing flexibility, and partnerships with seed producers and biotech firms. Many are introducing biological seed treatments and advanced polymer coatings to align with sustainability goals and meet regulatory shifts.

Recent Seed Treatment Materials Industry News

  • In November 2024, GROWMARK and Indigo Ag formed a strategic partnership to deliver Indigo’s biotrinsic® biologicals and CLIPS seed coating system, enhancing crop productivity and sustainability for farmers across North America.

Seed Treatment Materials Market Report Scope

Report Attributes Details
Current Total Market Size (2025) USD 3.3 billion
Projected Market Size (2035) USD 8.5 billion
CAGR (2025 to 2035) 9.9%
Base Year for Estimation 2024
Historical Period 2020 to 2024
Projections Period 2025 to 2035
Market Analysis Parameters Revenue in USD billions / Volume in Metric Tons
By Coating Type Seed Film Coating (Matte Finish, Shine, Sparkle), Seed Encrusting, and Seed Pelleting
By Application Seed Polymers (Petrochemical-Based Polymers, Biopolymers), Binder & Fillers, Colourant, Seed Biologicals (Biological Inoculant, Biocontrols, Pheromones, Biostimulants), Seed Protection (Insecticides: Thiamethoxam, Imidacloprid, Carbofuran, Other insecticides like Clothianidin, Fipronil, Chlorpyrifos), and Fungicides (Thiram, Carbendazim, Tebuconazole, Carboxin, Others like Metalaxyl, Fludioxonil, Azoxystrobin).
By Form Powder, Liquid
By Treatment Method Chemical Seed Treatment, Non-Chemical Seed Treatment (Biological Seed Treatment, Physical Seed Treatment), Hot Water Treatment, and Dry Heat Treatment
By Crop Type Cereals & Grains (Corn, Wheat, Rice, Sorghum, Barley), Oilseeds & Pulses (Soybean, Canola, Cotton, Sunflower), and Others (Turfs, Forages, Alfalfa, Sugar Beets & Vegetables).
Regions Covered North America, Latin America, Western Europe, Eastern Europe, East Asia, South Asia & Pacific, Middle East & Africa
Countries Covered United States, Canada, United Kingdom, Germany, France, China, Japan, South Korea, Brazil, Australia, +40 countries
Key Players Corteva Agriscience, Eastman Chemical Company, FMC Corporation, Chromatech Incorporated, Bayer AG, Evonik, BASF SE, Sumitomo Chemical, Clariant Specialty Chemicals, Syngenta AG, Croda International Plc, Germains Seed Technology, Tozer Seeds Ltd, Nufarm Limited, Centor Oceania, ADAMA Agricultural Solutions Ltd., UPL Limited, Jeevan Chemicals Pvt. Ltd., Tagros Chemicals India Ltd., and Novozymes A/S.
Additional Attributes Dollar sales by value, market share analysis by region, and country-wise analysis.

Key Segments Covered in the Seed Treatment Materials Industry Analysis

By Coating Type:

  • Seed Film Coating
    • Matte Finish
    • Shine
    • Sparkle
  • Seed Encrusting
  • Seed Pelleting

By Application:

  • Seed Polymers
    • Petrochemical-Based Polymers
    • Biopolymers
  • Binder & Fillers
  • Colourant (Dispersed Pigment Color)
  • Seed Biologicals
    • Biological Inoculant
    • Biocontrols
    • Pheromones
    • Biostimulants
  • Seed Protection
    • Insecticides
    • Thiamethoxam
    • Imidacloprid
    • Carbofuran
    • Other insecticides
  • Fungicides
    • Thiram
    • Carbendazim
    • Tebuconazole
    • Carboxin
    • Other Fungicides
    • Other Seed Protection Functions

By Form:

  • Powder
  • Liquid

By Treatment Method:

  • Chemical Seed Treatment
  • Non-Chemical Seed Treatment
    • Biological Seed Treatment
    • Physical Seed Treatment
  • Hot Water Treatment
  • Dry Heat Treatment

By Crop Type:

  • Cereals & Grains
    • Corn
    • Wheat
    • Rice
    • Sorghum
    • Barley
  • Oilseeds & Pulses
    • Soybean
    • Canola
    • Cotton
    • Sunflower
  • Other Crop Types
    • Turfs, Forages, and Alfalfa
    • Sugar Beets & Vegetables

By Region:

  • North America
  • Latin America
  • Europe
  • Japan
  • Asia Pacific Excluding Japan
  • Middle East & Africa

Table of Content

  1. Executive Summary
    • Global Market Outlook
    • Demand-side Trends
    • Supply-side Trends
    • Technology Roadmap Analysis
    • Analysis and Recommendations
  2. Market Overview
    • Market Coverage / Taxonomy
    • Market Definition / Scope / Limitations
  3. Market Background
    • Market Dynamics
      • Drivers
      • Restraints
      • Opportunity
      • Trends
    • Scenario Forecast
      • Demand in Optimistic Scenario
      • Demand in Likely Scenario
      • Demand in Conservative Scenario
    • Opportunity Map Analysis
    • Product Life Cycle Analysis
    • Supply Chain Analysis
      • Supply Side Participants and their Roles
        • Producers
        • Mid-Level Participants (Traders/ Agents/ Brokers)
        • Wholesalers and Distributors
      • Value Added and Value Created at Node in the Supply Chain
      • List of Raw Material Suppliers
      • List of Existing and Potential Buyer’s
    • Investment Feasibility Matrix
    • Value Chain Analysis
      • Profit Margin Analysis
      • Wholesalers and Distributors
      • Retailers
    • PESTLE and Porter’s Analysis
    • Regulatory Landscape
      • By Key Regions
      • By Key Countries
    • Regional Parent Market Outlook
    • Production and Consumption Statistics
    • Import and Export Statistics
  4. Global Market Analysis 2020 to 2024 and Forecast, 2025 to 2035
    • Historical Market Size Value (USD Billion) & Volume (Metric Tons) Analysis, 2020 to 2024
    • Current and Future Market Size Value (USD Billion) & Volume (Metric Tons) Projections, 2025 to 2035
      • Y-o-Y Growth Trend Analysis
      • Absolute $ Opportunity Analysis
  5. Global Market Pricing Analysis 2020 to 2024 and Forecast 2025 to 2035
  6. Global Market Analysis 2020 to 2024 and Forecast 2025 to 2035, By Coating Type
    • Introduction / Key Findings
    • Historical Market Size Value (USD Billion) & Volume (Metric Tons) Analysis By Coating Type, 2020 to 2024
    • Current and Future Market Size Value (USD Billion) & Volume (Metric Tons) Analysis and Forecast By Coating Type, 2025 to 2035
      • Seed Film Coating
        • Matte Finish
        • Shine
        • Sparkle
      • Seed Encrusting
      • Seed Pelleting
    • Y-o-Y Growth Trend Analysis By Coating Type, 2020 to 2024
    • Absolute $ Opportunity Analysis By Coating Type, 2025 to 2035
  7. Global Market Analysis 2020 to 2024 and Forecast 2025 to 2035, By Application
    • Introduction / Key Findings
    • Historical Market Size Value (USD Billion) & Volume (Metric Tons) Analysis By Application, 2020 to 2024
    • Current and Future Market Size Value (USD Billion) & Volume (Metric Tons) Analysis and Forecast By Application, 2025 to 2035
      • Seed Polymers
        • Petrochemical-Based Polymers
        • Biopolymers
      • Binder & Fillers
      • Colourant
      • Seed Biologicals
        • Biological Inoculant
        • Biocontrols
        • Pheromones
        • Biostimulants
      • Seed Protection
        • Insecticides
          • Thiamethoxam
          • Imidacloprid
          • Carbofuran
          • Other insecticides
        • Fungicides
          • Thiram
          • Carbendazim
          • Tebuconazole
          • Carboxin
          • Others (Metalaxyl, Captan, Fludioxonil, and Azoxystrobin)
    • Y-o-Y Growth Trend Analysis By Application, 2020 to 2024
    • Absolute $ Opportunity Analysis By Application, 2025 to 2035
  8. Global Market Analysis 2020 to 2024 and Forecast 2025 to 2035, By Form
    • Introduction / Key Findings
    • Historical Market Size Value (USD Billion) & Volume (Metric Tons) Analysis By Form, 2020 to 2024
    • Current and Future Market Size Value (USD Billion) & Volume (Metric Tons) Analysis and Forecast By Form, 2025 to 2035
      • Powder
      • Liquid
    • Y-o-Y Growth Trend Analysis By Form, 2020 to 2024
    • Absolute $ Opportunity Analysis By Form, 2025 to 2035
  9. Global Market Analysis 2020 to 2024 and Forecast 2025 to 2035, By Treatment Method
    • Introduction / Key Findings
    • Historical Market Size Value (USD Billion) & Volume (Metric Tons) Analysis By Treatment Method, 2020 to 2024
    • Current and Future Market Size Value (USD Billion) & Volume (Metric Tons) Analysis and Forecast By Treatment Method, 2025 to 2035
      • Chemical Seed Treatment
      • Non-Chemical Seed Treatment
        • Biological Seed Treatment
        • Physical Seed Treatment
      • Hot Water Treatment
      • Dry Heat Treatment
    • Y-o-Y Growth Trend Analysis By Treatment Method, 2020 to 2024
    • Absolute $ Opportunity Analysis By Treatment Method, 2025 to 2035
  10. Global Market Analysis 2020 to 2024 and Forecast 2025 to 2035, By Crop Type
    • Introduction / Key Findings
    • Historical Market Size Value (USD Billion) & Volume (Metric Tons) Analysis By Crop Type, 2020 to 2024
    • Current and Future Market Size Value (USD Billion) & Volume (Metric Tons) Analysis and Forecast By Crop Type, 2025 to 2035
      • Cereals & Grains
        • Corn
        • Wheat
        • Rice
        • Sorghum
        • Barley
      • Oilseeds & Pulses
        • Soybean
        • Canola
        • Cotton
        • Sunflower
      • Others
        • Turfs, Forages, and Alfalfa
        • Sugar Beets & Vegetables
    • Y-o-Y Growth Trend Analysis By Crop Type, 2020 to 2024
    • Absolute $ Opportunity Analysis By Crop Type, 2025 to 2035
  11. Global Market Analysis 2020 to 2024 and Forecast 2025 to 2035, By Region
    • Introduction
    • Historical Market Size Value (USD Billion) & Volume (Metric Tons) Analysis By Region, 2020 to 2024
    • Current Market Size Value (USD Billion) & Volume (Metric Tons) Analysis and Forecast By Region, 2025 to 2035
      • North America
      • Latin America
      • Western Europe
      • Eastern Europe
      • East Asia
      • South Asia & Pacific
      • Middle East and Africa
    • Market Attractiveness Analysis By Region
  12. North America Market Analysis 2020 to 2024 and Forecast 2025 to 2035, By Country
    • Historical Market Size Value (USD Billion) & Volume (Metric Tons) Trend Analysis By Market Taxonomy, 2020 to 2024
    • Market Size Value (USD Billion) & Volume (Metric Tons) Forecast By Market Taxonomy, 2025 to 2035
      • By Country
        • USA
        • Canada
        • Mexico
      • By Coating Type
      • By Application
      • By Form
      • By Treatment Method
      • By Crop Type
    • Market Attractiveness Analysis
      • By Country
      • By Coating Type
      • By Application
      • By Form
      • By Treatment Method
      • By Crop Type
    • Key Takeaways
  13. Latin America Market Analysis 2020 to 2024 and Forecast 2025 to 2035, By Country
    • Historical Market Size Value (USD Billion) & Volume (Metric Tons) Trend Analysis By Market Taxonomy, 2020 to 2024
    • Market Size Value (USD Billion) & Volume (Metric Tons) Forecast By Market Taxonomy, 2025 to 2035
      • By Country
        • Brazil
        • Argentina
        • Rest of LATAM
      • By Coating Type
      • By Application
      • By Form
      • By Treatment Method
      • By Crop Type
    • Market Attractiveness Analysis
      • By Country
      • By Coating Type
      • By Application
      • By Form
      • By Treatment Method
      • By Crop Type
    • Key Takeaways
  14. Western Europe Market Analysis 2020 to 2024 and Forecast 2025 to 2035, By Country
    • Historical Market Size Value (USD Billion) & Volume (Metric Tons) Trend Analysis By Market Taxonomy, 2020 to 2024
    • Market Size Value (USD Billion) & Volume (Metric Tons) Forecast By Market Taxonomy, 2025 to 2035
      • By Country
        • Germany
        • Italy
        • France
        • UK
        • Spain
        • BENELUX
        • Nordic
        • Rest of W.Europe
      • By Coating Type
      • By Application
      • By Form
      • By Treatment Method
      • By Crop Type
    • Market Attractiveness Analysis
      • By Country
      • By Coating Type
      • By Application
      • By Form
      • By Treatment Method
      • By Crop Type
    • Key Takeaways
  15. Eastern Europe Market Analysis 2020 to 2024 and Forecast 2025 to 2035, By Country
    • Historical Market Size Value (USD Billion) & Volume (Metric Tons) Trend Analysis By Market Taxonomy, 2020 to 2024
    • Market Size Value (USD Billion) & Volume (Metric Tons) Forecast By Market Taxonomy, 2025 to 2035
      • By Country
        • Russia
        • Hungary
        • Poland
        • Balkan & Baltics
        • Rest of E. Europe
      • By Coating Type
      • By Application
      • By Form
      • By Treatment Method
      • By Crop Type
    • Market Attractiveness Analysis
      • By Country
      • By Coating Type
      • By Application
      • By Form
      • By Treatment Method
      • By Crop Type
    • Key Takeaways
  16. East Asia Market Analysis 2020 to 2024 and Forecast 2025 to 2035, By Country
    • Historical Market Size Value (USD Billion) & Volume (Metric Tons) Trend Analysis By Market Taxonomy, 2020 to 2024
    • Market Size Value (USD Billion) & Volume (Metric Tons) Forecast By Market Taxonomy, 2025 to 2035
      • By Country
        • China
        • Japan
        • South Korea
      • By Coating Type
      • By Application
      • By Form
      • By Treatment Method
      • By Crop Type
    • Market Attractiveness Analysis
      • By Country
      • By Coating Type
      • By Application
      • By Form
      • By Treatment Method
      • By Crop Type
    • Key Takeaways
  17. South Asia & Pacific Market Analysis 2020 to 2024 and Forecast 2025 to 2035, By Country
    • Historical Market Size Value (USD Billion) & Volume (Metric Tons) Trend Analysis By Market Taxonomy, 2020 to 2024
    • Market Size Value (USD Billion) & Volume (Metric Tons) Forecast By Market Taxonomy, 2025 to 2035
      • By Country
        • India
        • Australia & New Zealand
        • ASEAN
        • Rest of SAP
      • By Coating Type
      • By Application
      • By Form
      • By Treatment Method
      • By Crop Type
    • Market Attractiveness Analysis
      • By Country
      • By Coating Type
      • By Application
      • By Form
      • By Treatment Method
      • By Crop Type
    • Key Takeaways
  18. Middle East and Africa Market Analysis 2020 to 2024 and Forecast 2025 to 2035, By Country
    • Historical Market Size Value (USD Billion) & Volume (Metric Tons) Trend Analysis By Market Taxonomy, 2020 to 2024
    • Market Size Value (USD Billion) & Volume (Metric Tons) Forecast By Market Taxonomy, 2025 to 2035
      • By Country
        • GCC Countries
        • Northern Africa
        • South Africa
        • Turkiye
        • Rest of MEA
      • By Coating Type
      • By Application
      • By Form
      • By Treatment Method
      • By Crop Type
    • Market Attractiveness Analysis
      • By Country
      • By Coating Type
      • By Application
      • By Form
      • By Treatment Method
      • By Crop Type
    • Key Takeaways
  19. Key Countries Market Analysis
    • USA
      • Pricing Analysis
      • Market Share Analysis, 2024
        • By Coating Type
        • By Application
        • By Form
        • By Treatment Method
        • By Crop Type
    • Canada
      • Pricing Analysis
      • Market Share Analysis, 2024
        • By Coating Type
        • By Application
        • By Form
        • By Treatment Method
        • By Crop Type
    • Brazil
      • Pricing Analysis
      • Market Share Analysis, 2024
        • By Coating Type
        • By Application
        • By Form
        • By Treatment Method
        • By Crop Type
    • Mexico
      • Pricing Analysis
      • Market Share Analysis, 2024
        • By Coating Type
        • By Application
        • By Form
        • By Treatment Method
        • By Crop Type
    • Argentina
      • Pricing Analysis
      • Market Share Analysis, 2024
        • By Coating Type
        • By Application
        • By Form
        • By Treatment Method
        • By Crop Type
  20. Market Structure Analysis
    • Competition Dashboard
    • Competition Benchmarking
    • Market Share Analysis of Top Players
      • By Regional
      • By Coating Type
      • By Application
      • By Form
      • By Treatment Method
      • By Crop Type
  21. Competition Analysis
    • Competition Deep Dive
      • Corteva Agriscience
        • Overview
        • Product Portfolio
        • Profitability by Market Segments (Product/Age /Sales Channel/Region)
        • Sales Footprint
        • Strategy Overview
          • Marketing Strategy
          • Product Strategy
          • Channel Strategy
      • Eastman Chemical Company
        • Overview
        • Product Portfolio
        • Profitability by Market Segments (Product/Age /Sales Channel/Region)
        • Sales Footprint
        • Strategy Overview
          • Marketing Strategy
          • Product Strategy
          • Channel Strategy
      • FMC Corporation
        • Overview
        • Product Portfolio
        • Profitability by Market Segments (Product/Age /Sales Channel/Region)
        • Sales Footprint
        • Strategy Overview
          • Marketing Strategy
          • Product Strategy
          • Channel Strategy
      • Chromatech Incorporated
        • Overview
        • Product Portfolio
        • Profitability by Market Segments (Product/Age /Sales Channel/Region)
        • Sales Footprint
        • Strategy Overview
          • Marketing Strategy
          • Product Strategy
          • Channel Strategy
      • Bayer AG
        • Overview
        • Product Portfolio
        • Profitability by Market Segments (Product/Age /Sales Channel/Region)
        • Sales Footprint
        • Strategy Overview
          • Marketing Strategy
          • Product Strategy
          • Channel Strategy
      • Evonik
        • Overview
        • Product Portfolio
        • Profitability by Market Segments (Product/Age /Sales Channel/Region)
        • Sales Footprint
        • Strategy Overview
          • Marketing Strategy
          • Product Strategy
          • Channel Strategy
      • BASF SE
        • Overview
        • Product Portfolio
        • Profitability by Market Segments (Product/Age /Sales Channel/Region)
        • Sales Footprint
        • Strategy Overview
          • Marketing Strategy
          • Product Strategy
          • Channel Strategy
      • Sumitomo Chemical
        • Overview
        • Product Portfolio
        • Profitability by Market Segments (Product/Age /Sales Channel/Region)
        • Sales Footprint
        • Strategy Overview
          • Marketing Strategy
          • Product Strategy
          • Channel Strategy
      • Clariant Specialty Chemicals
        • Overview
        • Product Portfolio
        • Profitability by Market Segments (Product/Age /Sales Channel/Region)
        • Sales Footprint
        • Strategy Overview
          • Marketing Strategy
          • Product Strategy
          • Channel Strategy
      • Syngenta AG
        • Overview
        • Product Portfolio
        • Profitability by Market Segments (Product/Age /Sales Channel/Region)
        • Sales Footprint
        • Strategy Overview
          • Marketing Strategy
          • Product Strategy
          • Channel Strategy
      • Croda International Plc
        • Overview
        • Product Portfolio
        • Profitability by Market Segments (Product/Age /Sales Channel/Region)
        • Sales Footprint
        • Strategy Overview
          • Marketing Strategy
          • Product Strategy
          • Channel Strategy
      • Germains Seed Technology
        • Overview
        • Product Portfolio
        • Profitability by Market Segments (Product/Age /Sales Channel/Region)
        • Sales Footprint
        • Strategy Overview
          • Marketing Strategy
          • Product Strategy
          • Channel Strategy
      • Tozer Seeds Lt
        • Overview
        • Product Portfolio
        • Profitability by Market Segments (Product/Age /Sales Channel/Region)
        • Sales Footprint
        • Strategy Overview
          • Marketing Strategy
          • Product Strategy
          • Channel Strategy
      • Nufarm Limited
        • Overview
        • Product Portfolio
        • Profitability by Market Segments (Product/Age /Sales Channel/Region)
        • Sales Footprint
        • Strategy Overview
          • Marketing Strategy
          • Product Strategy
          • Channel Strategy
      • Centor Oceania
        • Overview
        • Product Portfolio
        • Profitability by Market Segments (Product/Age /Sales Channel/Region)
        • Sales Footprint
        • Strategy Overview
          • Marketing Strategy
          • Product Strategy
          • Channel Strategy
      • ADAMA Agricultural Solutions Ltd.
        • Overview
        • Product Portfolio
        • Profitability by Market Segments (Product/Age /Sales Channel/Region)
        • Sales Footprint
        • Strategy Overview
          • Marketing Strategy
          • Product Strategy
          • Channel Strategy
      • UPL Limited
        • Overview
        • Product Portfolio
        • Profitability by Market Segments (Product/Age /Sales Channel/Region)
        • Sales Footprint
        • Strategy Overview
          • Marketing Strategy
          • Product Strategy
          • Channel Strategy
      • Jeevan Chemicals Pvt. Ltd.
        • Overview
        • Product Portfolio
        • Profitability by Market Segments (Product/Age /Sales Channel/Region)
        • Sales Footprint
        • Strategy Overview
          • Marketing Strategy
          • Product Strategy
          • Channel Strategy
      • Tagros Chemicals India Ltd.
        • Overview
        • Product Portfolio
        • Profitability by Market Segments (Product/Age /Sales Channel/Region)
        • Sales Footprint
        • Strategy Overview
          • Marketing Strategy
          • Product Strategy
          • Channel Strategy
      • Novozymes A/S
        • Overview
        • Product Portfolio
        • Profitability by Market Segments (Product/Age /Sales Channel/Region)
        • Sales Footprint
        • Strategy Overview
          • Marketing Strategy
          • Product Strategy
          • Channel Strategy
  22. Assumptions & Acronyms Used
  23. Research Methodology

List of Tables

  • Table 1: Global Market Value (USD Billion) Forecast by Region, 2020-2035
  • Table 2: Global Market Volume (Metric Tons) Forecast by Region, 2020-2035
  • Table 3: Global Market Value (USD Billion) Forecast by Coating Type, 2020-2035
  • Table 4: Global Market Volume (Metric Tons) Forecast by Coating Type, 2020-2035
  • Table 5: Global Market Value (USD Billion) Forecast by Application, 2020-2035
  • Table 6: Global Market Volume (Metric Tons) Forecast by Application, 2020-2035
  • Table 7: Global Market Value (USD Billion) Forecast by Form, 2020-2035
  • Table 8: Global Market Volume (Metric Tons) Forecast by Form, 2020-2035
  • Table 9: Global Market Value (USD Billion) Forecast by Treatment Method, 2020-2035
  • Table 10: Global Market Volume (Metric Tons) Forecast by Treatment Method, 2020-2035
  • Table 11: Global Market Value (USD Billion) Forecast by Crop Type, 2020-2035
  • Table 12: Global Market Volume (Metric Tons) Forecast by Crop Type, 2020-2035
  • Table 13: North America Market Value (USD Billion) Forecast by Country, 2020-2035
  • Table 14: North America Market Volume (Metric Tons) Forecast by Country, 2020-2035
  • Table 15: North America Market Value (USD Billion) Forecast by Coating Type, 2020-2035
  • Table 16: North America Market Volume (Metric Tons) Forecast by Coating Type, 2020-2035
  • Table 17: North America Market Value (USD Billion) Forecast by Application, 2020-2035
  • Table 18: North America Market Volume (Metric Tons) Forecast by Application, 2020-2035
  • Table 19: North America Market Value (USD Billion) Forecast by Form, 2020-2035
  • Table 20: North America Market Volume (Metric Tons) Forecast by Form, 2020-2035
  • Table 21: North America Market Value (USD Billion) Forecast by Treatment Method, 2020-2035
  • Table 22: North America Market Volume (Metric Tons) Forecast by Treatment Method, 2020-2035
  • Table 23: North America Market Value (USD Billion) Forecast by Crop Type, 2020-2035
  • Table 24: North America Market Volume (Metric Tons) Forecast by Crop Type, 2020-2035
  • Table 25: Latin America Market Value (USD Billion) Forecast by Country, 2020-2035
  • Table 26: Latin America Market Volume (Metric Tons) Forecast by Country, 2020-2035
  • Table 27: Latin America Market Value (USD Billion) Forecast by Coating Type, 2020-2035
  • Table 28: Latin America Market Volume (Metric Tons) Forecast by Coating Type, 2020-2035
  • Table 29: Latin America Market Value (USD Billion) Forecast by Application, 2020-2035
  • Table 30: Latin America Market Volume (Metric Tons) Forecast by Application, 2020-2035
  • Table 31: Latin America Market Value (USD Billion) Forecast by Form, 2020-2035
  • Table 32: Latin America Market Volume (Metric Tons) Forecast by Form, 2020-2035
  • Table 33: Latin America Market Value (USD Billion) Forecast by Treatment Method, 2020-2035
  • Table 34: Latin America Market Volume (Metric Tons) Forecast by Treatment Method, 2020-2035
  • Table 35: Latin America Market Value (USD Billion) Forecast by Crop Type, 2020-2035
  • Table 36: Latin America Market Volume (Metric Tons) Forecast by Crop Type, 2020-2035
  • Table 37: Western Europe Market Value (USD Billion) Forecast by Country, 2020-2035
  • Table 38: Western Europe Market Volume (Metric Tons) Forecast by Country, 2020-2035
  • Table 39: Western Europe Market Value (USD Billion) Forecast by Coating Type, 2020-2035
  • Table 40: Western Europe Market Volume (Metric Tons) Forecast by Coating Type, 2020-2035
  • Table 41: Western Europe Market Value (USD Billion) Forecast by Application, 2020-2035
  • Table 42: Western Europe Market Volume (Metric Tons) Forecast by Application, 2020-2035
  • Table 43: Western Europe Market Value (USD Billion) Forecast by Form, 2020-2035
  • Table 44: Western Europe Market Volume (Metric Tons) Forecast by Form, 2020-2035
  • Table 45: Western Europe Market Value (USD Billion) Forecast by Treatment Method, 2020-2035
  • Table 46: Western Europe Market Volume (Metric Tons) Forecast by Treatment Method, 2020-2035
  • Table 47: Western Europe Market Value (USD Billion) Forecast by Crop Type, 2020-2035
  • Table 48: Western Europe Market Volume (Metric Tons) Forecast by Crop Type, 2020-2035
  • Table 49: Eastern Europe Market Value (USD Billion) Forecast by Country, 2020-2035
  • Table 50: Eastern Europe Market Volume (Metric Tons) Forecast by Country, 2020-2035
  • Table 51: Eastern Europe Market Value (USD Billion) Forecast by Coating Type, 2020-2035
  • Table 52: Eastern Europe Market Volume (Metric Tons) Forecast by Coating Type, 2020-2035
  • Table 53: Eastern Europe Market Value (USD Billion) Forecast by Application, 2020-2035
  • Table 54: Eastern Europe Market Volume (Metric Tons) Forecast by Application, 2020-2035
  • Table 55: Eastern Europe Market Value (USD Billion) Forecast by Form, 2020-2035
  • Table 56: Eastern Europe Market Volume (Metric Tons) Forecast by Form, 2020-2035
  • Table 57: Eastern Europe Market Value (USD Billion) Forecast by Treatment Method, 2020-2035
  • Table 58: Eastern Europe Market Volume (Metric Tons) Forecast by Treatment Method, 2020-2035
  • Table 59: Eastern Europe Market Value (USD Billion) Forecast by Crop Type, 2020-2035
  • Table 60: Eastern Europe Market Volume (Metric Tons) Forecast by Crop Type, 2020-2035
  • Table 61: East Asia Market Value (USD Billion) Forecast by Country, 2020-2035
  • Table 62: East Asia Market Volume (Metric Tons) Forecast by Country, 2020-2035
  • Table 63: East Asia Market Value (USD Billion) Forecast by Coating Type, 2020-2035
  • Table 64: East Asia Market Volume (Metric Tons) Forecast by Coating Type, 2020-2035
  • Table 65: East Asia Market Value (USD Billion) Forecast by Application, 2020-2035
  • Table 66: East Asia Market Volume (Metric Tons) Forecast by Application, 2020-2035
  • Table 67: East Asia Market Value (USD Billion) Forecast by Form, 2020-2035
  • Table 68: East Asia Market Volume (Metric Tons) Forecast by Form, 2020-2035
  • Table 69: East Asia Market Value (USD Billion) Forecast by Treatment Method, 2020-2035
  • Table 70: East Asia Market Volume (Metric Tons) Forecast by Treatment Method, 2020-2035
  • Table 71: East Asia Market Value (USD Billion) Forecast by Crop Type, 2020-2035
  • Table 72: East Asia Market Volume (Metric Tons) Forecast by Crop Type, 2020-2035
  • Table 73: South Asia & Pacific Market Value (USD Billion) Forecast by Country, 2020-2035
  • Table 74: South Asia & Pacific Market Volume (Metric Tons) Forecast by Country, 2020-2035
  • Table 75: South Asia & Pacific Market Value (USD Billion) Forecast by Coating Type, 2020-2035
  • Table 76: South Asia & Pacific Market Volume (Metric Tons) Forecast by Coating Type, 2020-2035
  • Table 77: South Asia & Pacific Market Value (USD Billion) Forecast by Application, 2020-2035
  • Table 78: South Asia & Pacific Market Volume (Metric Tons) Forecast by Application, 2020-2035
  • Table 79: South Asia & Pacific Market Value (USD Billion) Forecast by Form, 2020-2035
  • Table 80: South Asia & Pacific Market Volume (Metric Tons) Forecast by Form, 2020-2035
  • Table 81: South Asia & Pacific Market Value (USD Billion) Forecast by Treatment Method, 2020-2035
  • Table 82: South Asia & Pacific Market Volume (Metric Tons) Forecast by Treatment Method, 2020-2035
  • Table 83: South Asia & Pacific Market Value (USD Billion) Forecast by Crop Type, 2020-2035
  • Table 84: South Asia & Pacific Market Volume (Metric Tons) Forecast by Crop Type, 2020-2035
  • Table 85: Middle East and Africa Market Value (USD Billion) Forecast by Country, 2020-2035
  • Table 86: Middle East and Africa Market Volume (Metric Tons) Forecast by Country, 2020-2035
  • Table 87: Middle East and Africa Market Value (USD Billion) Forecast by Coating Type, 2020-2035
  • Table 88: Middle East and Africa Market Volume (Metric Tons) Forecast by Coating Type, 2020-2035
  • Table 89: Middle East and Africa Market Value (USD Billion) Forecast by Application, 2020-2035
  • Table 90: Middle East and Africa Market Volume (Metric Tons) Forecast by Application, 2020-2035
  • Table 91: Middle East and Africa Market Value (USD Billion) Forecast by Form, 2020-2035
  • Table 92: Middle East and Africa Market Volume (Metric Tons) Forecast by Form, 2020-2035
  • Table 93: Middle East and Africa Market Value (USD Billion) Forecast by Treatment Method, 2020-2035
  • Table 94: Middle East and Africa Market Volume (Metric Tons) Forecast by Treatment Method, 2020-2035
  • Table 95: Middle East and Africa Market Value (USD Billion) Forecast by Crop Type, 2020-2035
  • Table 96: Middle East and Africa Market Volume (Metric Tons) Forecast by Crop Type, 2020-2035

List of Figures

  • Figure 1: Global Market Volume (Metric Tons) Forecast 2020-2035
  • Figure 2: Global Market Pricing Analysis
  • Figure 3: Global Market Value (USD Billion) Forecast 2020-2035
  • Figure 4: Global Market Value Share and BPS Analysis by Coating Type, 2025 and 2035
  • Figure 5: Global Market Y-o-Y Growth Comparison by Coating Type, 2025-2035
  • Figure 6: Global Market Attractiveness Analysis by Coating Type
  • Figure 7: Global Market Value Share and BPS Analysis by Application, 2025 and 2035
  • Figure 8: Global Market Y-o-Y Growth Comparison by Application, 2025-2035
  • Figure 9: Global Market Attractiveness Analysis by Application
  • Figure 10: Global Market Value Share and BPS Analysis by Form, 2025 and 2035
  • Figure 11: Global Market Y-o-Y Growth Comparison by Form, 2025-2035
  • Figure 12: Global Market Attractiveness Analysis by Form
  • Figure 13: Global Market Value Share and BPS Analysis by Treatment Method, 2025 and 2035
  • Figure 14: Global Market Y-o-Y Growth Comparison by Treatment Method, 2025-2035
  • Figure 15: Global Market Attractiveness Analysis by Treatment Method
  • Figure 16: Global Market Value Share and BPS Analysis by Crop Type, 2025 and 2035
  • Figure 17: Global Market Y-o-Y Growth Comparison by Crop Type, 2025-2035
  • Figure 18: Global Market Attractiveness Analysis by Crop Type
  • Figure 19: Global Market Value (USD Billion) Share and BPS Analysis by Region, 2025 and 2035
  • Figure 20: Global Market Y-o-Y Growth Comparison by Region, 2025-2035
  • Figure 21: Global Market Attractiveness Analysis by Region
  • Figure 22: North America Market Incremental $ Opportunity, 2025-2035
  • Figure 23: Latin America Market Incremental $ Opportunity, 2025-2035
  • Figure 24: Western Europe Market Incremental $ Opportunity, 2025-2035
  • Figure 25: Eastern Europe Market Incremental $ Opportunity, 2025-2035
  • Figure 26: East Asia Market Incremental $ Opportunity, 2025-2035
  • Figure 27: South Asia & Pacific Market Incremental $ Opportunity, 2025-2035
  • Figure 28: Middle East and Africa Market Incremental $ Opportunity, 2025-2035
  • Figure 29: North America Market Value Share and BPS Analysis by Country, 2025 and 2035
  • Figure 30: North America Market Value Share and BPS Analysis by Coating Type, 2025 and 2035
  • Figure 31: North America Market Y-o-Y Growth Comparison by Coating Type, 2025-2035
  • Figure 32: North America Market Attractiveness Analysis by Coating Type
  • Figure 33: North America Market Value Share and BPS Analysis by Application, 2025 and 2035
  • Figure 34: North America Market Y-o-Y Growth Comparison by Application, 2025-2035
  • Figure 35: North America Market Attractiveness Analysis by Application
  • Figure 36: North America Market Value Share and BPS Analysis by Form, 2025 and 2035
  • Figure 37: North America Market Y-o-Y Growth Comparison by Form, 2025-2035
  • Figure 38: North America Market Attractiveness Analysis by Form
  • Figure 39: North America Market Value Share and BPS Analysis by Treatment Method, 2025 and 2035
  • Figure 40: North America Market Y-o-Y Growth Comparison by Treatment Method, 2025-2035
  • Figure 41: North America Market Attractiveness Analysis by Treatment Method
  • Figure 42: North America Market Value Share and BPS Analysis by Crop Type, 2025 and 2035
  • Figure 43: North America Market Y-o-Y Growth Comparison by Crop Type, 2025-2035
  • Figure 44: North America Market Attractiveness Analysis by Crop Type
  • Figure 45: Latin America Market Value Share and BPS Analysis by Country, 2025 and 2035
  • Figure 46: Latin America Market Value Share and BPS Analysis by Coating Type, 2025 and 2035
  • Figure 47: Latin America Market Y-o-Y Growth Comparison by Coating Type, 2025-2035
  • Figure 48: Latin America Market Attractiveness Analysis by Coating Type
  • Figure 49: Latin America Market Value Share and BPS Analysis by Application, 2025 and 2035
  • Figure 50: Latin America Market Y-o-Y Growth Comparison by Application, 2025-2035
  • Figure 51: Latin America Market Attractiveness Analysis by Application
  • Figure 52: Latin America Market Value Share and BPS Analysis by Form, 2025 and 2035
  • Figure 53: Latin America Market Y-o-Y Growth Comparison by Form, 2025-2035
  • Figure 54: Latin America Market Attractiveness Analysis by Form
  • Figure 55: Latin America Market Value Share and BPS Analysis by Treatment Method, 2025 and 2035
  • Figure 56: Latin America Market Y-o-Y Growth Comparison by Treatment Method, 2025-2035
  • Figure 57: Latin America Market Attractiveness Analysis by Treatment Method
  • Figure 58: Latin America Market Value Share and BPS Analysis by Crop Type, 2025 and 2035
  • Figure 59: Latin America Market Y-o-Y Growth Comparison by Crop Type, 2025-2035
  • Figure 60: Latin America Market Attractiveness Analysis by Crop Type
  • Figure 61: Western Europe Market Value Share and BPS Analysis by Country, 2025 and 2035
  • Figure 62: Western Europe Market Value Share and BPS Analysis by Coating Type, 2025 and 2035
  • Figure 63: Western Europe Market Y-o-Y Growth Comparison by Coating Type, 2025-2035
  • Figure 64: Western Europe Market Attractiveness Analysis by Coating Type
  • Figure 65: Western Europe Market Value Share and BPS Analysis by Application, 2025 and 2035
  • Figure 66: Western Europe Market Y-o-Y Growth Comparison by Application, 2025-2035
  • Figure 67: Western Europe Market Attractiveness Analysis by Application
  • Figure 68: Western Europe Market Value Share and BPS Analysis by Form, 2025 and 2035
  • Figure 69: Western Europe Market Y-o-Y Growth Comparison by Form, 2025-2035
  • Figure 70: Western Europe Market Attractiveness Analysis by Form
  • Figure 71: Western Europe Market Value Share and BPS Analysis by Treatment Method, 2025 and 2035
  • Figure 72: Western Europe Market Y-o-Y Growth Comparison by Treatment Method, 2025-2035
  • Figure 73: Western Europe Market Attractiveness Analysis by Treatment Method
  • Figure 74: Western Europe Market Value Share and BPS Analysis by Crop Type, 2025 and 2035
  • Figure 75: Western Europe Market Y-o-Y Growth Comparison by Crop Type, 2025-2035
  • Figure 76: Western Europe Market Attractiveness Analysis by Crop Type
  • Figure 77: Eastern Europe Market Value Share and BPS Analysis by Country, 2025 and 2035
  • Figure 78: Eastern Europe Market Value Share and BPS Analysis by Coating Type, 2025 and 2035
  • Figure 79: Eastern Europe Market Y-o-Y Growth Comparison by Coating Type, 2025-2035
  • Figure 80: Eastern Europe Market Attractiveness Analysis by Coating Type
  • Figure 81: Eastern Europe Market Value Share and BPS Analysis by Application, 2025 and 2035
  • Figure 82: Eastern Europe Market Y-o-Y Growth Comparison by Application, 2025-2035
  • Figure 83: Eastern Europe Market Attractiveness Analysis by Application
  • Figure 84: Eastern Europe Market Value Share and BPS Analysis by Form, 2025 and 2035
  • Figure 85: Eastern Europe Market Y-o-Y Growth Comparison by Form, 2025-2035
  • Figure 86: Eastern Europe Market Attractiveness Analysis by Form
  • Figure 87: Eastern Europe Market Value Share and BPS Analysis by Treatment Method, 2025 and 2035
  • Figure 88: Eastern Europe Market Y-o-Y Growth Comparison by Treatment Method, 2025-2035
  • Figure 89: Eastern Europe Market Attractiveness Analysis by Treatment Method
  • Figure 90: Eastern Europe Market Value Share and BPS Analysis by Crop Type, 2025 and 2035
  • Figure 91: Eastern Europe Market Y-o-Y Growth Comparison by Crop Type, 2025-2035
  • Figure 92: Eastern Europe Market Attractiveness Analysis by Crop Type
  • Figure 93: East Asia Market Value Share and BPS Analysis by Country, 2025 and 2035
  • Figure 94: East Asia Market Value Share and BPS Analysis by Coating Type, 2025 and 2035
  • Figure 95: East Asia Market Y-o-Y Growth Comparison by Coating Type, 2025-2035
  • Figure 96: East Asia Market Attractiveness Analysis by Coating Type
  • Figure 97: East Asia Market Value Share and BPS Analysis by Application, 2025 and 2035
  • Figure 98: East Asia Market Y-o-Y Growth Comparison by Application, 2025-2035
  • Figure 99: East Asia Market Attractiveness Analysis by Application
  • Figure 100: East Asia Market Value Share and BPS Analysis by Form, 2025 and 2035
  • Figure 101: East Asia Market Y-o-Y Growth Comparison by Form, 2025-2035
  • Figure 102: East Asia Market Attractiveness Analysis by Form
  • Figure 103: East Asia Market Value Share and BPS Analysis by Treatment Method, 2025 and 2035
  • Figure 104: East Asia Market Y-o-Y Growth Comparison by Treatment Method, 2025-2035
  • Figure 105: East Asia Market Attractiveness Analysis by Treatment Method
  • Figure 106: East Asia Market Value Share and BPS Analysis by Crop Type, 2025 and 2035
  • Figure 107: East Asia Market Y-o-Y Growth Comparison by Crop Type, 2025-2035
  • Figure 108: East Asia Market Attractiveness Analysis by Crop Type
  • Figure 109: South Asia & Pacific Market Value Share and BPS Analysis by Country, 2025 and 2035
  • Figure 110: South Asia & Pacific Market Value Share and BPS Analysis by Coating Type, 2025 and 2035
  • Figure 111: South Asia & Pacific Market Y-o-Y Growth Comparison by Coating Type, 2025-2035
  • Figure 112: South Asia & Pacific Market Attractiveness Analysis by Coating Type
  • Figure 113: South Asia & Pacific Market Value Share and BPS Analysis by Application, 2025 and 2035
  • Figure 114: South Asia & Pacific Market Y-o-Y Growth Comparison by Application, 2025-2035
  • Figure 115: South Asia & Pacific Market Attractiveness Analysis by Application
  • Figure 116: South Asia & Pacific Market Value Share and BPS Analysis by Form, 2025 and 2035
  • Figure 117: South Asia & Pacific Market Y-o-Y Growth Comparison by Form, 2025-2035
  • Figure 118: South Asia & Pacific Market Attractiveness Analysis by Form
  • Figure 119: South Asia & Pacific Market Value Share and BPS Analysis by Treatment Method, 2025 and 2035
  • Figure 120: South Asia & Pacific Market Y-o-Y Growth Comparison by Treatment Method, 2025-2035
  • Figure 121: South Asia & Pacific Market Attractiveness Analysis by Treatment Method
  • Figure 122: South Asia & Pacific Market Value Share and BPS Analysis by Crop Type, 2025 and 2035
  • Figure 123: South Asia & Pacific Market Y-o-Y Growth Comparison by Crop Type, 2025-2035
  • Figure 124: South Asia & Pacific Market Attractiveness Analysis by Crop Type
  • Figure 125: Middle East and Africa Market Value Share and BPS Analysis by Country, 2025 and 2035
  • Figure 126: Middle East and Africa Market Value Share and BPS Analysis by Coating Type, 2025 and 2035
  • Figure 127: Middle East and Africa Market Y-o-Y Growth Comparison by Coating Type, 2025-2035
  • Figure 128: Middle East and Africa Market Attractiveness Analysis by Coating Type
  • Figure 129: Middle East and Africa Market Value Share and BPS Analysis by Application, 2025 and 2035
  • Figure 130: Middle East and Africa Market Y-o-Y Growth Comparison by Application, 2025-2035
  • Figure 131: Middle East and Africa Market Attractiveness Analysis by Application
  • Figure 132: Middle East and Africa Market Value Share and BPS Analysis by Form, 2025 and 2035
  • Figure 133: Middle East and Africa Market Y-o-Y Growth Comparison by Form, 2025-2035
  • Figure 134: Middle East and Africa Market Attractiveness Analysis by Form
  • Figure 135: Middle East and Africa Market Value Share and BPS Analysis by Treatment Method, 2025 and 2035
  • Figure 136: Middle East and Africa Market Y-o-Y Growth Comparison by Treatment Method, 2025-2035
  • Figure 137: Middle East and Africa Market Attractiveness Analysis by Treatment Method
  • Figure 138: Middle East and Africa Market Value Share and BPS Analysis by Crop Type, 2025 and 2035
  • Figure 139: Middle East and Africa Market Y-o-Y Growth Comparison by Crop Type, 2025-2035
  • Figure 140: Middle East and Africa Market Attractiveness Analysis by Crop Type
  • Figure 141: Global Market - Tier Structure Analysis
  • Figure 142: Global Market - Company Share Analysis

Frequently Asked Questions

What is the projected size of the seed treatment materials market in 2025?

The market is valued at USD 3.3 billion in 2025.

What is the outlook on seed treatment materials demand by 2035?

The market is forecasted to reach USD 8.5 billion by 2035, reflecting a CAGR of 9.9%.

Which segment leads the seed treatment materials market by treatment method in 2025?

Biological seed treatment will lead the treatment method segment, accounting for 58% of the global market share in 2025.

What is the top form segment for the seed treatment materials market in 2025?

Liquid form will dominate the form segment with a 60% share in 2025.

Which country is projected to have the fastest-growing seed treatment materials market?

The USA is projected to grow at the fastest rate, with a CAGR of 9.2% from 2025 to 2035.

Explore Similar Insights

Future Market Insights

Seed Treatment Materials Market