

- Market Size (2026)
- USD 1.51 Bn
- Forecast (2036)
- USD 3.17 Bn
- CAGR (2026 to 2036)
- 7.7%
Flaxseeds Market Size, Market Forecast and Outlook By FMI
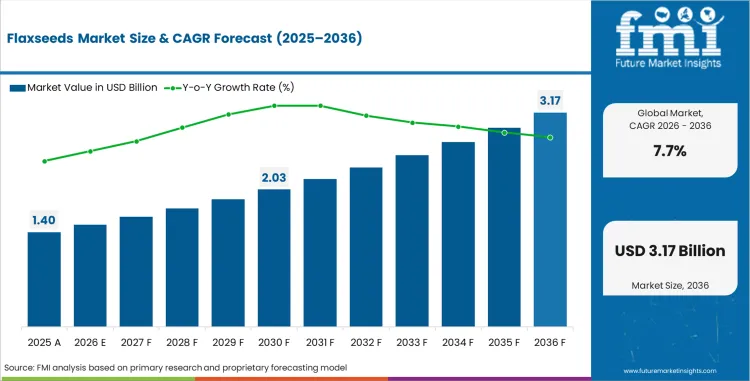
The flaxseeds market was valued at USD 1.4 billion in 2025. The market is set to reach USD 1.5 billion by 2026-end and grow at a CAGR of 7.7% between 2026-2036 to reach USD 3.2 billion by 2036. Whole Flaxseeds will dominate with a 50.0% share, while Food And Beverage will lead with a 60.0% share.
Summary of the Flaxseeds Market
- Demand and Growth Drivers
- Consumer demand for plant-based omega-3 sources is the primary growth catalyst, with flaxseeds recognized as the richest plant source of alpha-linolenic acid (ALA) and positioned as an alternative to marine omega-3 supplements.
- Bakery and cereal manufacturers are incorporating flaxseeds into bread, granola, and snack bar formulations as functional ingredients that support health claims and clean-label positioning on retail packaging.
- Organic flaxseed demand is growing faster than conventional, with certified organic products commanding 20 to 40% price premiums supported by health-conscious consumer willingness to pay for verified production practices.
- Product and Segment View
- Whole Flaxseeds is likely to remain the leading product segment at 50% share, supported by established demand and procurement patterns.
- Food And Beverage is likely to account for 60% of the application segment, reflecting buyer preference and usage patterns.
- Food Manufacturers is expected to dominate the end use segment accounting for 65% share during the forecast period.
- Geography and Competitive Outlook
- Driven by the solid demand fundamentals and growing uptake, China is likely to be a key market at 10.4% CAGR.
- India is expected to continue growing at a 9.63% CAGR driven by rising spending and growing infrastructure.
- Companies with broad product portfolios and multi-channel distribution are likely to gain traction during the forecast period.
- Analyst Opinion
- The flaxseeds market is evolving into a more defined commercial category with clear segment leaders and established distribution patterns.
- Adoption is increasing due to rising awareness, expanding distribution, and growing influence of premiumization on purchasing behavior.
- Demand is further supported by product format diversification, where manufacturers expand offerings to capture new consumption occasions and buyer segments.
- Companies that can secure consistent supply while delivering quality across key segments are likely to strengthen their position over the forecast period.
Key Takeaways, Market Size, and Forecast
- The flaxseeds market was valued at USD 1.4 billion in 2025.
- By 2036, the Flaxseeds Market is expected to be worth USD 3.17 billion.
- From 2026 to 2036, the market is projected to expand at a CAGR of 7.7%.
- The market is projected to create an incremental opportunity of USD 1.66 billion between 2026 and 2036.
- In 2026, whole flaxseeds is expected to account for 50% of the product segment, driven by demand for whole unprocessed flaxseeds consumed directly or used as ingredient inputs in bakery, cereal, and health food manufacturing.
- China (10.4%) and India (9.63%) are two of the fastest growing markets in the world.
Flaxseeds Market Definition
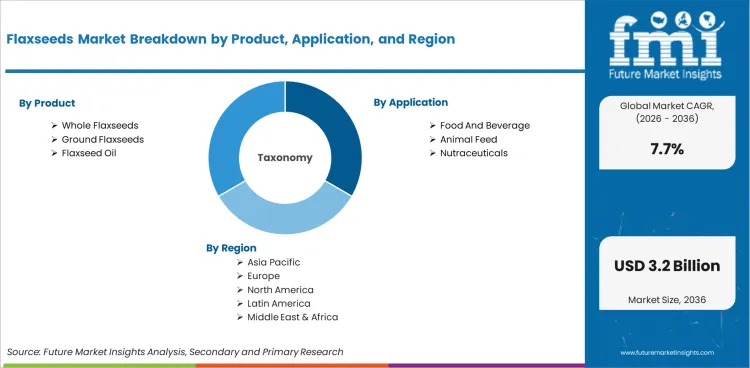
The flaxseeds market encompasses commercially traded flaxseed products valued for their omega-3 fatty acid, dietary fiber, and lignan content. Product categories include whole flaxseeds, ground flaxseeds, flaxseed oil, and flaxseed flour used across food and beverage, nutraceutical, animal feed, and industrial applications.
Flaxseeds Market Inclusions
Market scope covers all commercially traded flaxseed products categorized by product (whole flaxseeds, ground flaxseeds, flaxseed oil, flaxseed flour), application (food and beverage, nutraceutical, animal feed, industrial), end use (food manufacturers, retail consumers, feed manufacturers), distribution channel (offline retail, online retail), form (whole seeds, ground or milled, oil, flour), nature (conventional, organic), and pricing tier (mid range, economy, premium). The revenue range spans from 2026 to 2036.
Flaxseeds Market Exclusions
The scope does not include other oilseeds such as chia, hemp, or sunflower seeds, or flaxseed-derived industrial products for textile or composite manufacturing.
Flaxseeds Market Research Methodology
- Primary Research: FMI analysts talked with flaxseed processors, agricultural traders, health food manufacturers and retail buyers in key markets.
- Desk Research: Data collection from agricultural commodity associations, oilseed trade databases, and functional food market reports.
- Market sizing and forecasting: Bottom-up aggregation of product formats and application segments and regional production curves adjusted for acreage and yield and trade flow patterns.
- Data validation: Quarterly comparison with FAO agricultural production and trade data.
Why is the Flaxseeds Market Growing?
- Consumer demand for plant-based sources of omega-3 is the main driver of growth, with flaxseeds identified as the richest plant source of alpha-linolenic acid (ALA) and positioned as an alternative to marine omega-3 supplements.
- Bakery, Cereal Manufacturers Add Flaxseeds To Bread, Granola
- Organic flaxseed demand is growing faster than conventional, with certified organic products receiving a 20 to 40% premium price based on health-conscious consumer willingness to pay for verified production practices.
The market for flaxseeds is expected to grow at a CAGR of 7.7% over the forecast period. The growth of the flaxseeds market is being driven by increasing demand for functional food and awareness regarding plant-based omega-3 across the globe. Whole Flaxseeds Hold Product Segment With 50.0% Share and Are Used for Direct Consumer Consumption and as an Ingredient in Food Manufacturing. Food and beverage applications account for 60.0% of the demand. Major consumption categories include bakery, cereal and health food formulations.
Food manufacturers account for 65.0% of end-user demand and include flaxseeds into bread, granola, snack bars and functional food products. Distribution: 60.0% offline retail The product is available to consumers in the health food section of supermarkets and in bulk food aisles. Conventional products account for 70.0% of the nature segment, but organic certified flaxseeds are growing faster and are priced at a premium.
Market Segmentation Analysis
- Whole Flaxseeds accounts for 50% of the product segment, reflecting established demand patterns.
- Food Manufacturers leads the end use segment at 65% share.
The flaxseeds market is segmented by product, application, end use, distribution channel, form, nature, pricing tier.
Insights into the Whole Flaxseeds Product Segment
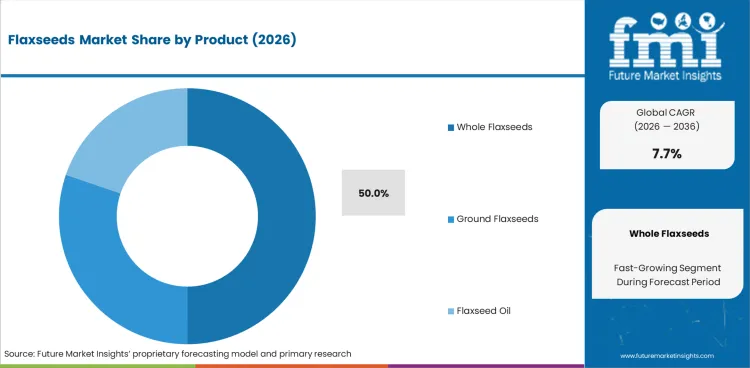
Whole flaxseeds are expected to account for 50.0% of the product segment in 2026. Golden and brown flaxseed are used in both retail consumer and food manufacturing markets. Whole seeds have the longest shelf life of all flaxseed formats, due to the protection of an intact seed coat. Ground flaxseeds and flaxseed oil are more expensive processed forms that have better bioavailability for omega-3 and lignan compounds.
Insights into the Food And Beverage Application Segment
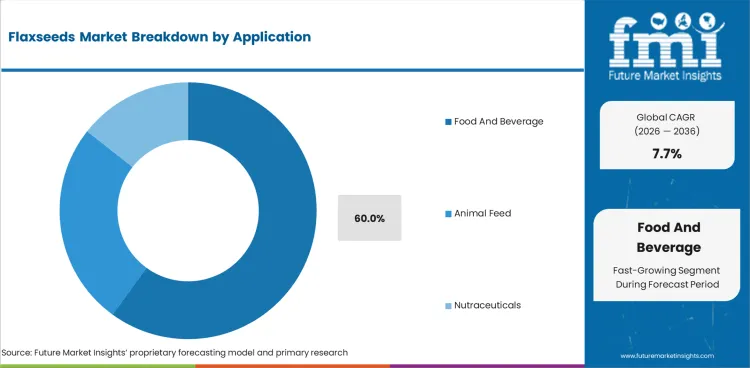
The application segment is driven by food and beverage with a share of 60.0%. Flaxseeds are often found in multigrain breads, rolls with seeds sprinkled on top, and other health conscious bakery products. Whole and ground flaxseeds are used as functional ingredients by cereal and granola manufacturers. Snack bar manufacturers use flaxseeds for omega-3 and fiber content claims. Animal feed and nutraceutical applications are smaller but higher value.
Flaxseeds Market Drivers, Restraints, and Opportunities
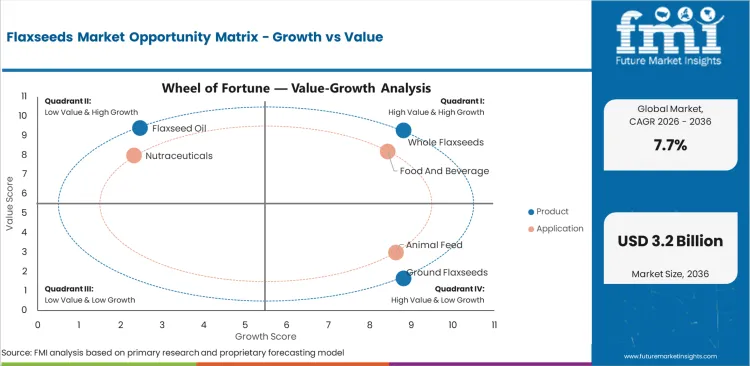
- Plant-Based Omega-3 Demand and is creating structured demand across key segments.
- Crop Yield Variability and is limiting adoption at stable pricing in some segments.
The flaxseeds market is shaped by demand-side catalysts and supply-side constraints that vary by region and price tier.
Plant-Based Omega-3 Demand and ALA Recognition
Consumer awareness of flaxseeds as the plant source with the highest alpha-linolenic acid (ALA) content, a plant-based omega-3 fatty acid, drives demand. Health advice promoting omega-3 consumption as a vegan substitute for fish oil supplements impacts consumer buying of flaxseed products.
Bakery and Functional Food Ingredient Integration
Growth is fueled by food manufacturers incorporating flaxseeds into bread, cereals, granola and snack bars as functional ingredients that support omega-3, fiber and lignan health claims on retail packaging. Flaxseed ingredient use increases with clean-label positioning.
Crop Yield Variability and Supply Concentration
Flaxseed crop yield variability and geographic supply concentration in Canada, Kazakhstan and Russia constrain adoption at stable pricing. Weather-related production shortfalls create commodity price volatility that impacts food manufacturer procurement budgets.
Organic Certification and Premium Pricing Growth
The company's growth is being driven by increases in organic flaxseed acreage and consumers willing to pay a premium of 20% to 40% for certified organic products. Conversion to organic production is driving up the supply of certified products for premium retail markets in Canada and the European Union countries.
Analysis of Flaxseeds Market By Key Countries
.webp "Top Country Growth Comparison Flaxseeds Market Cagr (2026 2036)")
| Country | CAGR |
|---|---|
| China | 10.4% |
| India | 9.63% |
| Germany | 8.86% |
| Brazil | 8.09% |
| USA | 7.32% |
| UK | 6.55% |
| Japan | 5.78% |
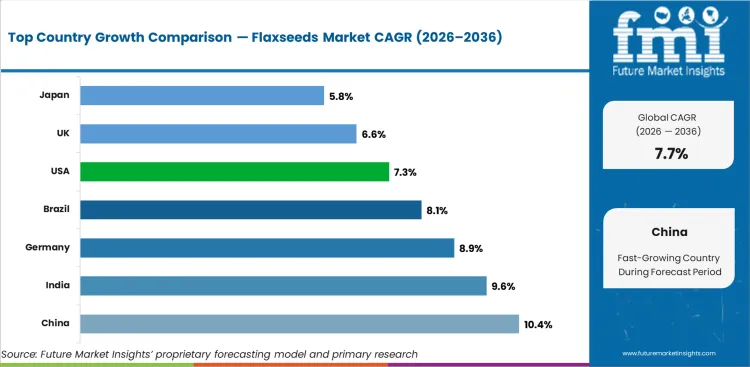
- China leads with a 10.4% CAGR, due to the largest demand base and increasing adoption.
- India at 9.63% shows strong demand, supported by rising spend, expansion of distribution
- Germany (8.86%) and Brazil (8.09%) continue to grow with increasing market development.
The global flaxseeds market is projected to expand at 7.7% per year from 2026 to 2036. The study covers more than 30 countries.
Sales Analysis of Flaxseeds Market in China
China leads at 10.4% through 2036. Growing health food consumption and expanding bakery industry create demand for flaxseed ingredients. China is also a significant flaxseed producer, with domestic cultivation in northern provinces supplementing import supply.
- Health food consumption growth drives retail and ingredient demand for flaxseed products.
- Domestic cultivation in northern provinces provides local supply supplementing imports.
- Bakery industry expansion increases flaxseed incorporation as a functional ingredient.
Demand Outlook for Flaxseeds Market in India
India is expanding at 9.63% through 2036. Traditional use of flaxseeds in Indian cuisine (known as alsi) provides cultural familiarity. Growing health awareness and Ayurvedic nutrition interest support modern retail demand for packaged flaxseed products.
- Traditional culinary use of flaxseeds (alsi) provides cultural familiarity and acceptance.
- Ayurvedic nutrition interest supports growing demand for omega-3 rich plant-based foods.
- Modern retail and e-commerce channels expand packaged flaxseed product accessibility.
Future Outlook for Flaxseeds Market in the United States
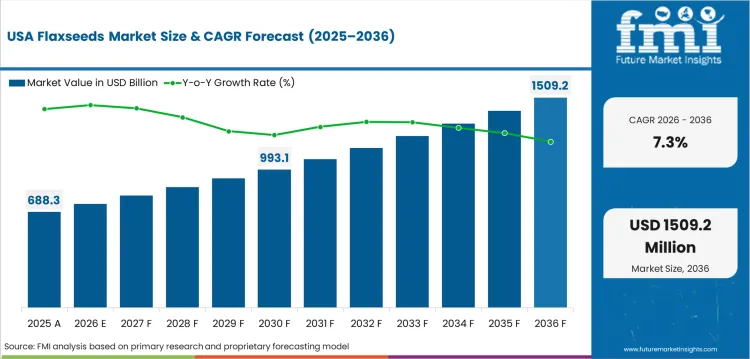
The USA is growing at 6.5% through 2036. The USA imports the majority of its flaxseed supply from Canada. Consumer demand for functional foods and omega-3 supplementation sustains retail and food manufacturing procurement.
- Functional food and omega-3 supplement demand sustains retail and manufacturing flaxseed procurement.
- Canadian import supply provides consistent availability for US food manufacturers and retailers.
- Organic flaxseed products command premium pricing in natural and health food retail channels.
In-depth Analysis of Flaxseeds Market in Germany
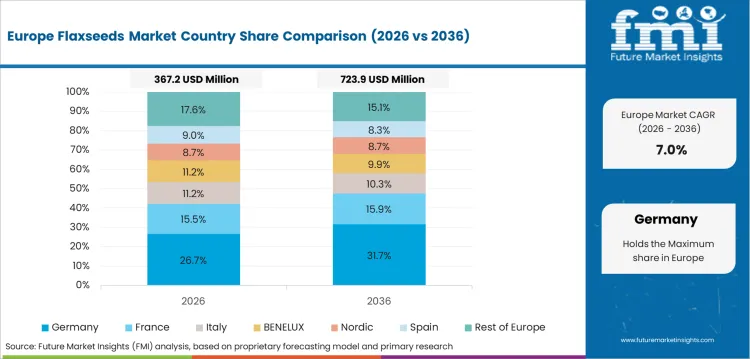
Germany is expanding at 6.2% through 2036. Strong consumer preference for functional and organic food products supports flaxseed demand. EU organic certification standards and health claims regulation shape product positioning.
- Consumer preference for functional and organic food products supports premium flaxseed demand.
- EU organic certification standards ensure product quality and traceability.
- Bakery integration of flaxseeds as health-positioned ingredients sustains manufacturing demand.
In-depth Analysis of Flaxseeds Market in Japan
Japan is growing at 5.8% through 2036. Health-conscious Japanese consumers recognize flaxseeds as a functional food ingredient. Import dependency creates procurement relationships with Canadian and Australian suppliers.
- Health-conscious consumer base recognizes flaxseeds as a functional omega-3 source.
- Import dependency for raw material creates trade relationships with major producing countries.
- Functional food regulatory framework supports validated health claims for flaxseed products.
Competitive Landscape and Strategic Positioning
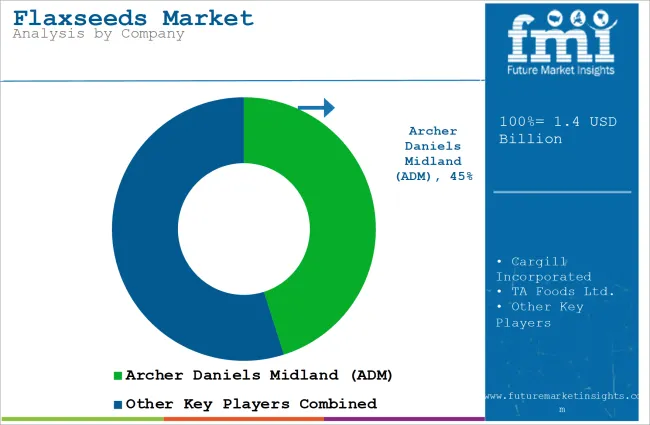
- Archer Daniels Midland (ADM) is at the forefront with its integrated agricultural commodity procurement, processing and global distribution infrastructure, providing flaxseed product formats for food manufacturing, animal feed and retail customers.
- Cargill Incorporated competes through its global agricultural commodity trading, oilseed processing and ingredient distribution capabilities that ensure a consistent supply of flaxseed for food manufacturers.
- Canadian specialty processors such as TA Foods, Richardson International and CanMar Foods serve the premium and organic flaxseed segment due to their proximity to Canadian production regions and processing expertise.
The competitive landscape is shaped by global leaders with integrated supply chains and regional specialists with niche capabilities.
Key Companies in the Flaxseeds Market
Key global companies leading the flaxseeds market include:
- Archer Daniels Midland (USA) and Cargill Incorporated (USA) lead through integrated agricultural trading, oilseed processing, and global distribution infrastructure serving food manufacturing and retail channels.
- TA Foods Ltd. (Canada), Richardson International Limited (Canada), and Johnson Seeds (Canada) serve through Canadian production proximity, flaxseed processing specialization, and established export relationships.
- AgMotion Inc. (USA), CanMar Foods Ltd. (Canada), Simosis (Greece), Stokes Seeds (Canada), and Bioriginal Food and Science Corp (Canada) compete through organic specialization, niche processing, and regional market expertise.
Competitive Benchmarking: Flaxseeds Market
| Company | Sourcing Scale | Processing Capability | Organic Portfolio | Distribution Reach |
|---|---|---|---|---|
| ADM | Very High | Very High | Medium | Global |
| Cargill | Very High | Very High | Medium | Global |
| TA Foods | Medium | High | High | N. America, Europe |
| Richardson International | High | High | Medium | Global |
| Johnson Seeds | Medium | Medium | High | N. America |
| AgMotion | Medium | Medium | High | N. America |
| CanMar Foods | Medium | High | Very High | N. America |
| Bioriginal | Medium | Medium | High | N. America, Europe |
Source: Future Market Insights competitive analysis, 2026.
Key Developments in Flaxseeds Market
- In 2025, ADM expanded its flaxseed processing capacity with a new cold-pressing facility targeting food-grade flaxseed oil production for functional food and nutraceutical applications.
- In 2025, CanMar Foods launched a new certified organic roasted flaxseed product line targeting premium retail and direct-to-consumer health food channels.
Key Players in the Flaxseeds Market
Major Global Players
- Archer Daniels Midland (ADM)
- Cargill Incorporated
- TA Foods Ltd.
- oRICHARDSON INTERNATIONAL LIMITED
- johnson Seeds
Emerging Players/Startups
- AgMotion, Inc.
- CanMar Foods Ltd.
- Simosis
- Stokes Seeds
- Bioriginal Food & Science Corp
Report Scope and Coverage
| Parameter | Details |
|---|---|
| Quantitative Units | USD 1.51 billion to USD 3.17 billion, at a CAGR of 7.7% |
| Market Definition | The flaxseeds market encompasses commercially traded flaxseed products valued for their omega-3 fatty acid, dietary fiber, and lignan content. Product categories include whole flaxseeds, ground flaxseeds, flaxseed oil, and flaxseed flour used across food and beverage, nutraceutical, animal feed, and industrial applications. |
| Regions Covered | North America, Latin America, Europe, East Asia, South Asia and Pacific, Middle East and Africa |
| Countries Covered | China, India, Germany, Brazil, USA, UK, Japan, 30 plus countries |
| Key Companies Profiled | Archer Daniels Midland (ADM), Cargill Incorporated, TA Foods Ltd., oRICHARDSON INTERNATIONAL LIMITED, johnson Seeds, AgMotion, Inc., CanMar Foods Ltd., Simosis |
| Forecast Period | 2026 to 2036 |
| Approach | Hybrid bottom-up and top-down methodology starting with verified transaction data, projecting adoption velocity across segments and regions. |
Market Segmentation Analysis
Flaxseeds Market Segmented by Product:
- Whole Flaxseeds
- Brown Flaxseeds
- Conventional Brown Seeds
- Organic Brown Seeds
- Golden Flaxseeds
- Conventional Golden Seeds
- Organic Golden Seeds
- Brown Flaxseeds
- Ground Flaxseeds
- Flaxseed Meal
- Fine Ground Meal
- Coarse Ground Meal
- Stabilized Flax Powder
- Heat Treated Powder
- Shelf Stable Powder
- Flaxseed Meal
- Flaxseed Oil
- Cold Pressed Oil
- Virgin Oil
- Unrefined Oil
- Refined Oil
- Filtered Oil
- Deodorized Oil
- Cold Pressed Oil
Flaxseeds Market Segmented by Application:
- Food And Beverage
- Bakery Products
- Bread And Rolls
- Cookies And Biscuits
- Dairy Alternatives
- Plant Based Milk
- Yogurt Alternatives
- Functional Foods
- Nutritional Bars
- Fortified Foods
- Bakery Products
- Animal Feed
- Livestock Feed
- Cattle Feed
- Poultry Feed
- Pet Food
- Dog Food
- Cat Food
- Livestock Feed
- Nutraceuticals
- Dietary Supplements
- Capsules And Tablets
- Powder Supplements
- Functional Ingredients
- Omega Three Enrichment
- Fiber Enrichment
- Dietary Supplements
Flaxseeds Market Segmented by End Use:
- Food Manufacturers
- Bakery Manufacturers
- Industrial Bakeries
- Artisanal Bakeries
- Processed Food Companies
- Snack Manufacturers
- Ready Meal Producers
- Bakery Manufacturers
- Retail Consumers
- Health Conscious Consumers
- Fitness Focused Users
- Organic Product Buyers
- General Consumers
- Household Cooking
- Diet Based Consumption
- Health Conscious Consumers
- Feed Manufacturers
- Livestock Feed Producers
- Commercial Feed Mills
- Integrated Feed Producers
- Livestock Feed Producers
Flaxseeds Market Segmented by Distribution Channel:
- Offline Retail
- Supermarkets And Hypermarkets
- Large Format Stores
- Discount Stores
- Specialty Stores
- Health Food Stores
- Organic Stores
- Traditional Grocery Stores
- Local Retailers
- Bulk Stores
- Supermarkets And Hypermarkets
- Online Retail
- E Commerce Platforms
- Marketplace Platforms
- Brand Owned Websites
- Direct To Consumer
- Subscription Models
- Bundle Offerings
- E Commerce Platforms
Flaxseeds Market Segmented by Form:
- Whole Seeds
- Raw Seeds
- Unprocessed Seeds
- Bulk Seeds
- Processed Seeds
- Cleaned Seeds
- Packaged Seeds
- Raw Seeds
- Powder Form
- Ground Meal
- Fine Powder
- Coarse Powder
- Blended Powder
- Nutritional Blends
- Functional Blends
- Ground Meal
- Oil Form
- Liquid Oil
- Cold Pressed
- Refined Oil
- Encapsulated Oil
- Softgel Capsules
- Functional Capsules
- Liquid Oil
Flaxseeds Market Segmented by Nature:
- Conventional
- Standard Farming
- High Yield Crops
- Commercial Farming
- Standard Farming
- Organic
- Certified Organic
- Organic Farming
- Sustainable Practices
- Certified Organic
Flaxseeds Market Segmented by Pricing Tier:
- Mid Range
- Standard Retail Products
- Packaged Seeds
- Standard Retail Products
- Economy
- Bulk Supply Products
- Loose Seeds
- Wholesale Supply
- Bulk Supply Products
- Premium
- Organic And Specialty Products
- Certified Organic Seeds
- Cold Pressed Oil Products
- Organic And Specialty Products
Flaxseeds Market by Region:
- North America
- USA
- Canada
- Mexico
- Latin America
- Brazil
- Chile
- Rest of Latin America
- Western Europe
- Germany
- UK
- Italy
- Spain
- France
- Nordic
- BENELUX
- Rest of Western Europe
- Eastern Europe
- Russia
- Poland
- Hungary
- Balkan & Baltic
- Rest of Eastern Europe
- East Asia
- China
- Japan
- South Korea
- South Asia and Pacific
- India
- ASEAN
- Australia & New Zealand
- Rest of South Asia and Pacific
- Middle East & Africa
- Kingdom of Saudi Arabia
- Other GCC Countries
- Turkiye
- South Africa
- Other African Union
- Rest of Middle East & Africa
Research Sources and Bibliography
- 1. Food and Agriculture Organization. (2025). FAO Global Oilseed Production and Trade Report. FAO.
- 2. Agriculture and Agri-Food Canada. (2025). Canadian Flaxseed Industry Overview. AAFC.
- 3. European Food Safety Authority. (2024). EFSA Scientific Opinion on ALA Health Claims. EFSA.
- 4. USA Department of Agriculture. (2025). USDA Oilseed Yearbook: Flaxseed Statistics. USDA.
- 5. International Organisation for Standardisation. (2024). ISO Standards for Oilseed Testing. ISO.
This bibliography is provided for reader reference.
This Report Answers
- Estimating the market size and revenue generation from 2026 to 2036.
- Segmenting by product, application, end use, distribution channel, form, nature, and pricing tier.
- Providing regional insights across more than 30 markets.
- Analyzing supply chain dynamics across Canadian, Russian, and Kazakh production regions.
- Assessing the competitive landscape across commodity and organic segments.
- Identifying investment opportunities in functional food and organic flaxseed products.
- Tracking omega-3 health claims regulation and consumer awareness trends.
- Delivering data in PDF and Excel formats.
Frequently Asked Questions
How big is the flaxseeds market in 2026?
The global flaxseeds market is estimated to be valued at USD 1.51 billion in 2026.
What will be the size of flaxseeds market in 2036?
The market size for the flaxseeds market is projected to reach USD 3.17 billion by 2036.
How much will be the flaxseeds market growth between 2026 and 2036?
The flaxseeds market is expected to grow at a 7.7% CAGR between 2026 and 2036.
What are the key product types in the flaxseeds market?
The key product types in flaxseeds market are whole flaxseeds, ground flaxseeds and flaxseed oil.
Which application segment is expected to contribute significant share in the flaxseeds market in 2026?
In terms of application, food and beverage segment is expected to command 60.0% share in the flaxseeds market in 2026.
Preview the report firsthand - request a free sample
Get SampleGet the brochure for pricing and purchase details.
Get PDFTable of Content
- Executive Summary
- Global Market Outlook
- Demand-side Trends
- Supply-side Trends
- Technology Roadmap Analysis
- Analysis and Recommendations
- Market Overview
- Market Coverage / Taxonomy
- Market Definition / Scope / Limitations
- Research Methodology
- Chapter Orientation
- Analytical Lens and Working Hypotheses
- Market Structure, Signals, and Trend Drivers
- Benchmarking and Cross-market Comparability
- Market Sizing, Forecasting, and Opportunity Mapping
- Research Design and Evidence Framework
- Desk Research Programme (Secondary Evidence)
- Company Annual and Sustainability Reports
- Peer-reviewed Journals and Academic Literature
- Corporate Websites, Product Literature, and Technical Notes
- Earnings Decks and Investor Briefings
- Statutory Filings and Regulatory Disclosures
- Technical White Papers and Standards Notes
- Trade Journals, Industry Magazines, and Analyst Briefs
- Conference Proceedings, Webinars, and Seminar Materials
- Government Statistics Portals and Public Data Releases
- Press Releases and Reputable Media Coverage
- Specialist Newsletters and Curated Briefings
- Sector Databases and Reference Repositories
- FMI Internal Proprietary Databases and Historical Market Datasets
- Subscription Datasets and Paid Sources
- Social Channels, Communities, and Digital Listening Inputs
- Additional Desk Sources
- Expert Input and Fieldwork (Primary Evidence)
- Primary Modes
- Qualitative Interviews and Expert Elicitation
- Quantitative Surveys and Structured Data Capture
- Blended Approach
- Why Primary Evidence is Used
- Field Techniques
- Interviews
- Surveys
- Focus Groups
- Observational and In-context Research
- Social and Community Interactions
- Stakeholder Universe Engaged
- C-suite Leaders
- Board Members
- Presidents and Vice Presidents
- R&D and Innovation Heads
- Technical Specialists
- Domain Subject-matter Experts
- Scientists
- Physicians and Other Healthcare Professionals
- Governance, Ethics, and Data Stewardship
- Research Ethics
- Data Integrity and Handling
- Primary Modes
- Tooling, Models, and Reference Databases
- Desk Research Programme (Secondary Evidence)
- Data Engineering and Model Build
- Data Acquisition and Ingestion
- Cleaning, Normalisation, and Verification
- Synthesis, Triangulation, and Analysis
- Quality Assurance and Audit Trail
- Market Background
- Market Dynamics
- Drivers
- Restraints
- Opportunity
- Trends
- Scenario Forecast
- Demand in Optimistic Scenario
- Demand in Likely Scenario
- Demand in Conservative Scenario
- Opportunity Map Analysis
- Product Life Cycle Analysis
- Supply Chain Analysis
- Investment Feasibility Matrix
- Value Chain Analysis
- PESTLE and Porter’s Analysis
- Regulatory Landscape
- Regional Parent Market Outlook
- Production and Consumption Statistics
- Import and Export Statistics
- Market Dynamics
- Global Market Analysis 2021 to 2025 and Forecast, 2026 to 2036
- Historical Market Size Value (USD Million) Analysis, 2021 to 2025
- Current and Future Market Size Value (USD Million) Projections, 2026 to 2036
- Y-o-Y Growth Trend Analysis
- Absolute $ Opportunity Analysis
- Global Market Pricing Analysis 2021 to 2025 and Forecast 2026 to 2036
- Global Market Analysis 2021 to 2025 and Forecast 2026 to 2036, By Product
- Introduction / Key Findings
- Historical Market Size Value (USD Million) Analysis By Product , 2021 to 2025
- Current and Future Market Size Value (USD Million) Analysis and Forecast By Product , 2026 to 2036
- Whole Flaxseeds
- Brown Flaxseeds
- Conventional Brown Seeds
- Organic Brown Seeds
- Golden Flaxseeds
- Conventional Golden Seeds
- Organic Golden Seeds
- Ground Flaxseeds
- Flaxseed Meal
- Fine Ground Meal
- Coarse Ground Meal
- Stabilized Flax Powder
- Heat Treated Powder
- Flaxseed Oil
- Cold Pressed Oil
- Virgin Oil
- Unrefined Oil
- Refined Oil
- Filtered Oil
- Whole Flaxseeds
- Y-o-Y Growth Trend Analysis By Product , 2021 to 2025
- Absolute $ Opportunity Analysis By Product , 2026 to 2036
- Global Market Analysis 2021 to 2025 and Forecast 2026 to 2036, By Application
- Introduction / Key Findings
- Historical Market Size Value (USD Million) Analysis By Application, 2021 to 2025
- Current and Future Market Size Value (USD Million) Analysis and Forecast By Application, 2026 to 2036
- Food And Beverage
- Bakery Products
- Bread And Rolls
- Cookies And Biscuits
- Dairy Alternatives
- Plant Based Milk
- Yogurt Alternatives
- Functional Foods
- Nutritional Bars
- Fortified Foods
- Animal Feed
- Livestock Feed
- Cattle Feed
- Poultry Feed
- Pet Food
- Dog Food
- Nutraceuticals
- Dietary Supplements
- Capsules And Tablets
- Powder Supplements
- Functional Ingredients
- Omega Three Enrichment
- Food And Beverage
- Y-o-Y Growth Trend Analysis By Application, 2021 to 2025
- Absolute $ Opportunity Analysis By Application, 2026 to 2036
- Global Market Analysis 2021 to 2025 and Forecast 2026 to 2036, By End Use
- Introduction / Key Findings
- Historical Market Size Value (USD Million) Analysis By End Use, 2021 to 2025
- Current and Future Market Size Value (USD Million) Analysis and Forecast By End Use, 2026 to 2036
- Food Manufacturers
- Bakery Manufacturers
- Industrial Bakeries
- Artisanal Bakeries
- Processed Food Companies
- Snack Manufacturers
- Ready Meal Producers
- Retail Consumers
- Health Conscious Consumers
- Fitness Focused Users
- Organic Product Buyers
- General Consumers
- Household Cooking
- Feed Manufacturers
- Livestock Feed Producers
- Commercial Feed Mills
- Integrated Feed Producers
- Food Manufacturers
- Y-o-Y Growth Trend Analysis By End Use, 2021 to 2025
- Absolute $ Opportunity Analysis By End Use, 2026 to 2036
- Global Market Analysis 2021 to 2025 and Forecast 2026 to 2036, By Distribution Channel
- Introduction / Key Findings
- Historical Market Size Value (USD Million) Analysis By Distribution Channel, 2021 to 2025
- Current and Future Market Size Value (USD Million) Analysis and Forecast By Distribution Channel, 2026 to 2036
- Offline Retail
- Supermarkets And Hypermarkets
- Large Format Stores
- Discount Stores
- Specialty Stores
- Health Food Stores
- Organic Stores
- Traditional Grocery Stores
- Local Retailers
- Bulk Stores
- Online Retail
- E Commerce Platforms
- Marketplace Platforms
- Brand Owned Websites
- Direct To Consumer
- Subscription Models
- Offline Retail
- Y-o-Y Growth Trend Analysis By Distribution Channel, 2021 to 2025
- Absolute $ Opportunity Analysis By Distribution Channel, 2026 to 2036
- Global Market Analysis 2021 to 2025 and Forecast 2026 to 2036, By Form
- Introduction / Key Findings
- Historical Market Size Value (USD Million) Analysis By Form, 2021 to 2025
- Current and Future Market Size Value (USD Million) Analysis and Forecast By Form, 2026 to 2036
- Whole Seeds
- Raw Seeds
- Unprocessed Seeds
- Bulk Seeds
- Processed Seeds
- Cleaned Seeds
- Packaged Seeds
- Powder Form
- Ground Meal
- Fine Powder
- Coarse Powder
- Blended Powder
- Nutritional Blends
- Oil Form
- Liquid Oil
- Cold Pressed
- Refined Oil
- Encapsulated Oil
- Softgel Capsules
- Whole Seeds
- Y-o-Y Growth Trend Analysis By Form, 2021 to 2025
- Absolute $ Opportunity Analysis By Form, 2026 to 2036
- Global Market Analysis 2021 to 2025 and Forecast 2026 to 2036, By Nature
- Introduction / Key Findings
- Historical Market Size Value (USD Million) Analysis By Nature, 2021 to 2025
- Current and Future Market Size Value (USD Million) Analysis and Forecast By Nature, 2026 to 2036
- Conventional
- Standard Farming
- High Yield Crops
- Commercial Farming
- Organic
- Certified Organic
- Organic Farming
- Sustainable Practices
- Conventional
- Y-o-Y Growth Trend Analysis By Nature, 2021 to 2025
- Absolute $ Opportunity Analysis By Nature, 2026 to 2036
- Global Market Analysis 2021 to 2025 and Forecast 2026 to 2036, By Pricing Tier
- Introduction / Key Findings
- Historical Market Size Value (USD Million) Analysis By Pricing Tier, 2021 to 2025
- Current and Future Market Size Value (USD Million) Analysis and Forecast By Pricing Tier, 2026 to 2036
- Mid Range
- Standard Retail Products
- Packaged Seeds
- Economy
- Bulk Supply Products
- Loose Seeds
- Wholesale Supply
- Premium
- Organic And Specialty Products
- Certified Organic Seeds
- Cold Pressed Oil Products
- Mid Range
- Y-o-Y Growth Trend Analysis By Pricing Tier, 2021 to 2025
- Absolute $ Opportunity Analysis By Pricing Tier, 2026 to 2036
- Global Market Analysis 2021 to 2025 and Forecast 2026 to 2036, By Region
- Introduction
- Historical Market Size Value (USD Million) Analysis By Region, 2021 to 2025
- Current Market Size Value (USD Million) Analysis and Forecast By Region, 2026 to 2036
- North America
- Latin America
- Western Europe
- Eastern Europe
- East Asia
- South Asia and Pacific
- Middle East & Africa
- Market Attractiveness Analysis By Region
- North America Market Analysis 2021 to 2025 and Forecast 2026 to 2036, By Country
- Historical Market Size Value (USD Million) Trend Analysis By Market Taxonomy, 2021 to 2025
- Market Size Value (USD Million) Forecast By Market Taxonomy, 2026 to 2036
- By Country
- USA
- Canada
- Mexico
- By Product
- By Application
- By End Use
- By Distribution Channel
- By Form
- By Nature
- By Pricing Tier
- By Country
- Market Attractiveness Analysis
- By Country
- By Product
- By Application
- By End Use
- By Distribution Channel
- By Form
- By Nature
- By Pricing Tier
- Key Takeaways
- Latin America Market Analysis 2021 to 2025 and Forecast 2026 to 2036, By Country
- Historical Market Size Value (USD Million) Trend Analysis By Market Taxonomy, 2021 to 2025
- Market Size Value (USD Million) Forecast By Market Taxonomy, 2026 to 2036
- By Country
- Brazil
- Chile
- Rest of Latin America
- By Product
- By Application
- By End Use
- By Distribution Channel
- By Form
- By Nature
- By Pricing Tier
- By Country
- Market Attractiveness Analysis
- By Country
- By Product
- By Application
- By End Use
- By Distribution Channel
- By Form
- By Nature
- By Pricing Tier
- Key Takeaways
- Western Europe Market Analysis 2021 to 2025 and Forecast 2026 to 2036, By Country
- Historical Market Size Value (USD Million) Trend Analysis By Market Taxonomy, 2021 to 2025
- Market Size Value (USD Million) Forecast By Market Taxonomy, 2026 to 2036
- By Country
- Germany
- UK
- Italy
- Spain
- France
- Nordic
- BENELUX
- Rest of Western Europe
- By Product
- By Application
- By End Use
- By Distribution Channel
- By Form
- By Nature
- By Pricing Tier
- By Country
- Market Attractiveness Analysis
- By Country
- By Product
- By Application
- By End Use
- By Distribution Channel
- By Form
- By Nature
- By Pricing Tier
- Key Takeaways
- Eastern Europe Market Analysis 2021 to 2025 and Forecast 2026 to 2036, By Country
- Historical Market Size Value (USD Million) Trend Analysis By Market Taxonomy, 2021 to 2025
- Market Size Value (USD Million) Forecast By Market Taxonomy, 2026 to 2036
- By Country
- Russia
- Poland
- Hungary
- Balkan & Baltic
- Rest of Eastern Europe
- By Product
- By Application
- By End Use
- By Distribution Channel
- By Form
- By Nature
- By Pricing Tier
- By Country
- Market Attractiveness Analysis
- By Country
- By Product
- By Application
- By End Use
- By Distribution Channel
- By Form
- By Nature
- By Pricing Tier
- Key Takeaways
- East Asia Market Analysis 2021 to 2025 and Forecast 2026 to 2036, By Country
- Historical Market Size Value (USD Million) Trend Analysis By Market Taxonomy, 2021 to 2025
- Market Size Value (USD Million) Forecast By Market Taxonomy, 2026 to 2036
- By Country
- China
- Japan
- South Korea
- By Product
- By Application
- By End Use
- By Distribution Channel
- By Form
- By Nature
- By Pricing Tier
- By Country
- Market Attractiveness Analysis
- By Country
- By Product
- By Application
- By End Use
- By Distribution Channel
- By Form
- By Nature
- By Pricing Tier
- Key Takeaways
- South Asia and Pacific Market Analysis 2021 to 2025 and Forecast 2026 to 2036, By Country
- Historical Market Size Value (USD Million) Trend Analysis By Market Taxonomy, 2021 to 2025
- Market Size Value (USD Million) Forecast By Market Taxonomy, 2026 to 2036
- By Country
- India
- ASEAN
- Australia & New Zealand
- Rest of South Asia and Pacific
- By Product
- By Application
- By End Use
- By Distribution Channel
- By Form
- By Nature
- By Pricing Tier
- By Country
- Market Attractiveness Analysis
- By Country
- By Product
- By Application
- By End Use
- By Distribution Channel
- By Form
- By Nature
- By Pricing Tier
- Key Takeaways
- Middle East & Africa Market Analysis 2021 to 2025 and Forecast 2026 to 2036, By Country
- Historical Market Size Value (USD Million) Trend Analysis By Market Taxonomy, 2021 to 2025
- Market Size Value (USD Million) Forecast By Market Taxonomy, 2026 to 2036
- By Country
- Kingdom of Saudi Arabia
- Other GCC Countries
- Turkiye
- South Africa
- Other African Union
- Rest of Middle East & Africa
- By Product
- By Application
- By End Use
- By Distribution Channel
- By Form
- By Nature
- By Pricing Tier
- By Country
- Market Attractiveness Analysis
- By Country
- By Product
- By Application
- By End Use
- By Distribution Channel
- By Form
- By Nature
- By Pricing Tier
- Key Takeaways
- Key Countries Market Analysis
- USA
- Pricing Analysis
- Market Share Analysis, 2025
- By Product
- By Application
- By End Use
- By Distribution Channel
- By Form
- By Nature
- By Pricing Tier
- Canada
- Pricing Analysis
- Market Share Analysis, 2025
- By Product
- By Application
- By End Use
- By Distribution Channel
- By Form
- By Nature
- By Pricing Tier
- Mexico
- Pricing Analysis
- Market Share Analysis, 2025
- By Product
- By Application
- By End Use
- By Distribution Channel
- By Form
- By Nature
- By Pricing Tier
- Brazil
- Pricing Analysis
- Market Share Analysis, 2025
- By Product
- By Application
- By End Use
- By Distribution Channel
- By Form
- By Nature
- By Pricing Tier
- Chile
- Pricing Analysis
- Market Share Analysis, 2025
- By Product
- By Application
- By End Use
- By Distribution Channel
- By Form
- By Nature
- By Pricing Tier
- Germany
- Pricing Analysis
- Market Share Analysis, 2025
- By Product
- By Application
- By End Use
- By Distribution Channel
- By Form
- By Nature
- By Pricing Tier
- UK
- Pricing Analysis
- Market Share Analysis, 2025
- By Product
- By Application
- By End Use
- By Distribution Channel
- By Form
- By Nature
- By Pricing Tier
- Italy
- Pricing Analysis
- Market Share Analysis, 2025
- By Product
- By Application
- By End Use
- By Distribution Channel
- By Form
- By Nature
- By Pricing Tier
- Spain
- Pricing Analysis
- Market Share Analysis, 2025
- By Product
- By Application
- By End Use
- By Distribution Channel
- By Form
- By Nature
- By Pricing Tier
- France
- Pricing Analysis
- Market Share Analysis, 2025
- By Product
- By Application
- By End Use
- By Distribution Channel
- By Form
- By Nature
- By Pricing Tier
- India
- Pricing Analysis
- Market Share Analysis, 2025
- By Product
- By Application
- By End Use
- By Distribution Channel
- By Form
- By Nature
- By Pricing Tier
- ASEAN
- Pricing Analysis
- Market Share Analysis, 2025
- By Product
- By Application
- By End Use
- By Distribution Channel
- By Form
- By Nature
- By Pricing Tier
- Australia & New Zealand
- Pricing Analysis
- Market Share Analysis, 2025
- By Product
- By Application
- By End Use
- By Distribution Channel
- By Form
- By Nature
- By Pricing Tier
- China
- Pricing Analysis
- Market Share Analysis, 2025
- By Product
- By Application
- By End Use
- By Distribution Channel
- By Form
- By Nature
- By Pricing Tier
- Japan
- Pricing Analysis
- Market Share Analysis, 2025
- By Product
- By Application
- By End Use
- By Distribution Channel
- By Form
- By Nature
- By Pricing Tier
- South Korea
- Pricing Analysis
- Market Share Analysis, 2025
- By Product
- By Application
- By End Use
- By Distribution Channel
- By Form
- By Nature
- By Pricing Tier
- Russia
- Pricing Analysis
- Market Share Analysis, 2025
- By Product
- By Application
- By End Use
- By Distribution Channel
- By Form
- By Nature
- By Pricing Tier
- Poland
- Pricing Analysis
- Market Share Analysis, 2025
- By Product
- By Application
- By End Use
- By Distribution Channel
- By Form
- By Nature
- By Pricing Tier
- Hungary
- Pricing Analysis
- Market Share Analysis, 2025
- By Product
- By Application
- By End Use
- By Distribution Channel
- By Form
- By Nature
- By Pricing Tier
- Kingdom of Saudi Arabia
- Pricing Analysis
- Market Share Analysis, 2025
- By Product
- By Application
- By End Use
- By Distribution Channel
- By Form
- By Nature
- By Pricing Tier
- Turkiye
- Pricing Analysis
- Market Share Analysis, 2025
- By Product
- By Application
- By End Use
- By Distribution Channel
- By Form
- By Nature
- By Pricing Tier
- South Africa
- Pricing Analysis
- Market Share Analysis, 2025
- By Product
- By Application
- By End Use
- By Distribution Channel
- By Form
- By Nature
- By Pricing Tier
- USA
- Market Structure Analysis
- Competition Dashboard
- Competition Benchmarking
- Market Share Analysis of Top Players
- By Regional
- By Product
- By Application
- By End Use
- By Distribution Channel
- By Form
- By Nature
- By Pricing Tier
- Competition Analysis
- Competition Deep Dive
- Archer Daniels Midland (ADM)
- Overview
- Product Portfolio
- Profitability by Market Segments (Product/Age /Sales Channel/Region)
- Sales Footprint
- Strategy Overview
- Marketing Strategy
- Product Strategy
- Channel Strategy
- Cargill Incorporated
- TA Foods Ltd.
- oRICHARDSON INTERNATIONAL LIMITED
- johnson Seeds
- AgMotion, Inc.
- CanMar Foods Ltd.
- Simosis
- Stokes Seeds
- Bioriginal Food & Science Corp
- Archer Daniels Midland (ADM)
- Competition Deep Dive
- Assumptions & Acronyms Used


