Reports

- Global Locations -

Headquarters

Future Market Insights, Inc.

Christiana Corporate, 200
Continental Drive, Suite 401,
Newark, Delaware - 19713,
United States

T: +1-845-579-5705

Americas

Future Market Insights, Inc.

616 Corporate Way, Suite 2-9018,
Valley Cottage, NY 10989, United States

T: +1-347-918-3531

MEA

Future Market Insights

1602-6 Jumeirah Bay X2 Tower, Plot No: JLT-PH2-X2A,
Jumeirah Lakes Towers, Dubai,
United Arab Emirates

Europe

Future Market Insights

3rd Floor, 207 Regent Street,
W1B 3HH London
United Kingdom

T: + 44 (0) 20 8123 9659
D: +44 (0) 20 3287 4268

Asia Pacific

Future Market Insights

IndiaLand Global Tech Park, Unit UG-1, Behind Grand HighStreet, Phase 1, Hinjawadi, MH, Pune – 411057, India

Dietary Fiber Market Outlook (2024 to 2034)

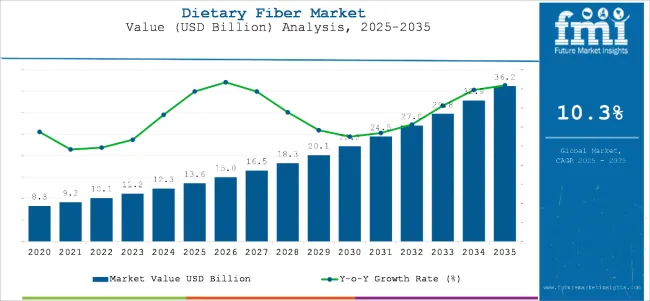
The global dietary fiber market is projected to increase from US$ 12,343.6 million in 2024 to US$ 33,098.0 million by 2034. Global sales of dietary fiber are anticipated to increase at a CAGR of 10.3% over the forecast period.

Key Factors Driving the Dietary Fiber Market:

  • More consumers are shifting toward natural and organic food, benefitting the dietary fiber industry.
  • Growing consumer preference toward vegan and vegetarian food products, which prominently contain dietary fiber, is leading to the market’s acceleration.
  • Growing recognition of lignin as a valuable component for materials like adhesives and surfactants, as well as in power generation, is driving the demand for the material in the dietary fiber industry.
Attributes Key Insights
Estimated Market Size (2024E) US$ 12,343.6 million
Projected Market Value (2034F) US$ 33,098.0 million
Value-based CAGR (2024 to 2034) 10.3%

Don't pay for what you don't need

Customize your report by selecting specific countries or regions and save 30%!

Market Trends

  • Companies are keen to invest in sports nutrition, and a healthy material like dietary fiber is finding increasing use in the nutrition of sports players.
  • Growing demand for plant-based and functional foods is driving the dietary fiber market.
  • Rising awareness of the health benefits of fiber intake is fueling the demand for innovative fiber-rich products in the dietary fiber market.
  • The rising popularity of resistant starch is leading to demand for dietary fiber, as the starch falls under the dietary fiber umbrella.

Adjacent Markets Overview

In addition to dietary fiber, two related markets in the supplements sector have been analyzed in the section. These are the insoluble dietary fiber market and the soluble corn fiber market.

Consumer preference toward supplements can be gleaned by looking at the markets in conjunction. It can also be seen that supplements are increasing acceptance in consumers' diets.

Dietary Fiber Market:

Attributes Dietary Fiber Market
Value-based CAGR (2024 to 2034) 10.3%
Growth Factor Consumers are shifting toward natural and organic foods
Opportunity Increasing demand for clean labels and transparency in ingredients
Market Trends Growing consumer preference toward vegan and vegetarian food products

Insoluble Dietary Fiber Market:

Attributes Insoluble Dietary Fiber Market
Value-based CAGR (2024 to 2034) 9.2%
Growth Factor Increasing incidence of lifestyle-related diseases like obesity, diabetes, and cardiovascular diseases
Opportunity Growing demand for fiber-fortified processed foods and beverages as consumers seek healthier and functional food alternatives
Market Trends Increasing consumption of fiber-rich food amid growing health concerns expected to drive sales of insoluble dietary fiber

Soluble Corn Fiber Market:

Attributes Soluble Corn Fiber Market
Value-based CAGR (2024 to 2034) 4.9%
Growth Factor Prebiotic properties promote the growth of beneficial gut bacteria, which aligns with the trend of maintaining gut health
Opportunity Manufacturers expected to make use of soluble corn fiber as an effective sugar substitute
Market Trends Demand is rising as a result of soluble corn fiber’s properties that enhance the texture and thickness of food products
Nandini Roy Choudhury

Principal Consultant

Talk to Analyst

Find your sweet spots for generating winning opportunities in this market.

Country-wise Insights

Countries CAGR (2024 to 2034)
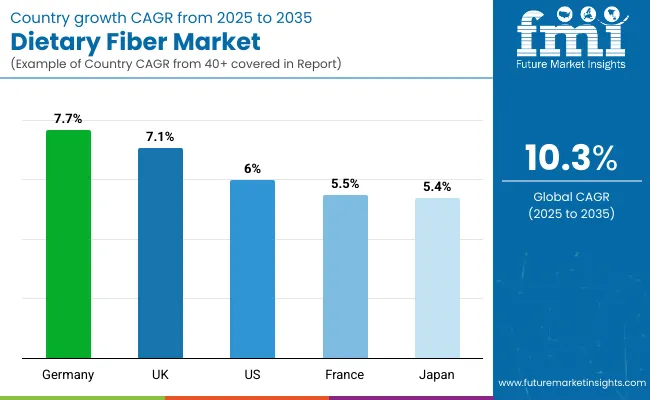
United States 6.0%
United Kingdom 7.1%
Germany 7.7%
China 4.9%
India 5.9%
Japan 5.4%

Growing Demand for Balanced Nutrition Having a Positive Impact on the United States Market

The market is expected to progress at a CAGR of 6.0% in the United States. The growth can be attributed to various factors that are closely linked:

  • As individuals become increasingly aware of how their diet impacts their overall well-being, the importance of dietary fibers in promoting good health has become more apparent. This awareness extends to proactive health measures, with people making dietary changes to prevent potential health issues, especially those related to digestive health.
  • The rising concern over weight management, given the growing rates of obesity, is a significant driver. Dietary fibers play a crucial role in controlling weight by creating a sense of fullness and satisfaction, making them a highly sought-after component in diets focused on maintaining a healthy weight. Government initiatives and dietary guidelines that promote balanced nutrition have also emphasized the importance of including an adequate amount of dietary fiber in daily diets.
  • The (FDA) in the United States and the European Food Safety Authority (EFSA) are expected to stymie the entry of new businesses.

Increasingly Urban Population Makes Germany one of the Lucrative Market

The market size of dietary fiber in Germany is accelerating, with a growing number of health-conscious consumers who are eager to use dietary supplement products. The CAGR for Germany over the forecast period is pegged at 7.7%. Some of the factors influencing growth are:

  • Significant changes in culinary patterns have occurred from lifestyle changes, lack of leisure and economic development, as well as the country's growing urban population. Other significant drivers boosting the market include an increase in fiber consumption in daily foods and a promising trend in functional food development.
  • The growth in health-conscious individuals can be attributed to a combination of factors, including heightened awareness of the role of nutrition in overall health, increased access to information on wellness and nutrition, and a general trend toward preventive healthcare. As a result, the dietary fiber market in Germany is experiencing rapid growth, with a diverse range of products catering to various health needs.

Expanding Product Portfolio Given Prime Importance by Manufacturers in China

The market is expected to progress at a CAGR of 4.9% in China. Some factors influencing the growth of the market in China are:

  • China's population has a wide range of interests and preferences. Manufacturers continually develop and expand their product portfolio to satisfy changing consumer needs. Several urban areas in China have hectic lives, which provide an ideal chance for on-the-go breakfast and handy goods. Excessive consumption of baked products and processed foods, in particular, is driving growth in China's growing marketplaces.
  • The country is seeing rapid growth in terms of new product releases and developments. Leading corporations are planning commercial expansion to expand their market share, and they are spending to augment the country's manufacturing capacity. Urbanization and economic development in China have led to changes in dietary patterns. As lifestyles become more fast-paced, there is a shift toward processed and convenience foods, which may lack sufficient dietary fiber. This has created a demand for dietary fiber supplements and fiber-enriched food products in China.

Focus on Children’s Nutrition Propels the Market of Dietary Fiber in the United Kingdom

The market is expected to progress at a CAGR of 7.1% in the United Kingdom. Some factors influencing the growth of the market in the United Kingdom are:

  • Increased focus is being paid to the nutrition of children in the United Kingdom. Dietary fiber is being sought on an increasing basis by parents and doctors in the country to improve the health of children. Thus, the market in the United Kingdom has bright prospects.
  • Government healthcare institutions have laid out recommended dietary plans in the United Kingdom. Many of these plans include dietary fiber as a key ingredient, thus laying out the path for the adoption of the product in the country.

Indian Consumers Taking Dietary Supplements as a Way to Boost Fitness Levels

The market is expected to progress at a CAGR of 5.9% in India. Some factors influencing the growth of the market in India are:

  • The young population of India is becoming increasingly fitness-conscious. Dietary fiber is thus being resorted to for losing body weight.
  • India’s rich tapestry of local cuisine contains dietary fiber by the bucketful. Thus, the population is accepting of the product and its benefits, allowing for the easy sales of dietary fiber in India.

Category-wise Insights

Multiple Applications of Dietary Fiber in Food and Beverages Ensure the Industry Remains in the Lead

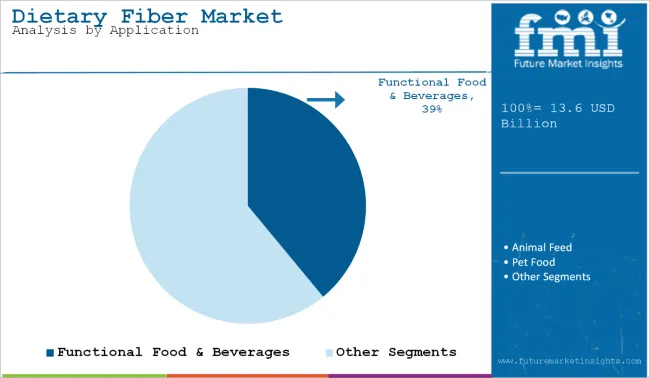
Food and beverages continue to be the leading industry for the market. For 2024, food and beverage is expected to account for 38.43% of the market share. Some of the reasons for the ever-rising use of dietary fiber in food and beverages include:

  • Dietary fibers play a crucial role in promoting human health and are widely used in various food products and supplements, including beverages like protein drinks, coffee, sports drinks, tea, and carbonated beverages. The animal food industry is also recognizing the health benefits of dietary fibers for pets.
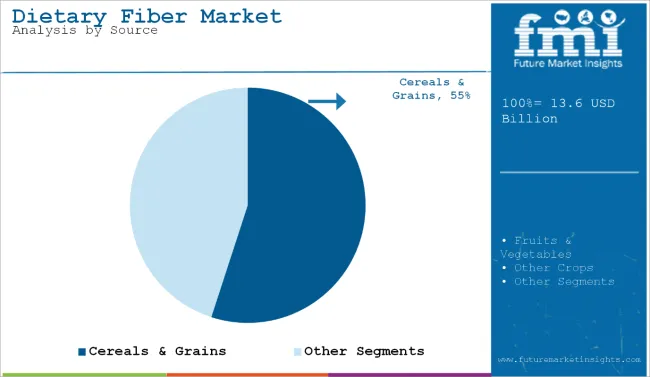
  • The surge in the natural and organic food sector in the last ten years is driven by the recognized health advantages of organic and natural foods. Consequently, more consumers are opting for natural and organic products. Dietary fiber, derived from cereals, grains, fruits, and vegetables, is a natural ingredient gaining popularity.

Soluble Dietary Fiber’s Capabilities in Improving Health Make it a Popular Type of Dietary Fiber in the Market

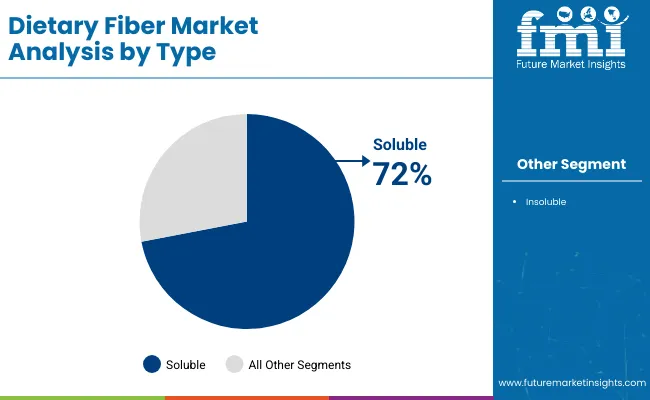
Soluble dietary fiber is anticipated to contribute a dominant 71.9% of the market share in 2024. Some of the reasons soluble dietary fiber remains a prominent type of dietary fiber are:

  • Soluble dietary fibers turn to gel during the digestion of food. Thus, soluble dietary fibers form an essential part of the digestion method. Soluble dietary fibers are especially recognized for the vital part they play in gut health.
  • Soluble dietary fibers form a part of many foods that have become commonplace in households. Barley, nuts, lentils, and numerous other food products contain soluble dietary fibers. As the sale of food products continues to grow, the market for soluble dietary fiber is benefitting, too.
  • Among the many recognized health benefits of soluble dietary fiber, reducing the risk of heart disease is viewed with particular admiration. Particular soluble nutritional fibers are claimed to reduce blood sugar levels and cholesterol. Thus, soluble dietary fibers remain popular over insoluble ones.

Get the data you need at a Fraction of the cost

Personalize your report by choosing insights you need
and save 40%!

Competitive Landscape

Dietary fiber manufacturers are pursuing strategic alliances and strategic partnerships with other manufacturers to enhance productivity and meet the demands of an ever-growing patient pool. The industry is defined by a high level of capital expenditure and a complicated manufacturing process. Cost-effective manufacturing procedures can help establish global market sustainability.

Recent Development

  • Cargill, Inc. invested about US$ 35 million in Europe in October 2019 to expand its current product line of sweeteners, starches, and texturizers to include soluble dietary fibers. This strategic project is the company's first foray into soluble dietary fibers in Europe, and it was launched to give on-trend solutions to makers of high-quality products such as bakery and confectionery goods, cereals, and dairy products.
  • In 2022, Brightseed Bioactives, a biotechnology company based in California, launched Brightseed Bio 01, a new dietary fiber that is formulated to enhance bioactive content and support gut health.

Key Companies in the Dietary Fiber Market

  • BENEO
  • ADM
  • Cargill, Incorporated
  • DuPont
  • Ingredion Incorporated
  • Roquette Frères
  • Emsland Group
  • Kerry Inc.
  • The Green Labs LLC
  • Nexira
  • Tate & Lyle
  • Farbest Brands
  • Taiyo International
  • AGT Food and Ingredients
  • Batory Foods

Dietary Fibers by Category

By Type:

  • Soluble
    • Inulin
    • Polydextrose
    • Dietary Fibers
    • Beta-Glucan
  • Insoluble
    • Cellulose
    • Hemicellulose
    • Chitosan
    • Chitin
    • Lignin
    • Resistant Starch

By Source:

  • Cereals & Grains
    • Wheat
    • Rice
    • Bran
    • Others
  • Fruits & Vegetables
    • Apples
    • Others
  • Other Crops

By Application:

  • Functional Food & Beverages
  • Animal Feed
  • Pet Food
  • Pharmaceuticals

By Region:

  • North America
  • Latin America
  • Europe
  • South Asia
  • East Asia
  • Oceania
  • The Middle East and Africa (MEA)

Frequently Asked Questions

How Much is the Dietary Fiber Market Expected to Reach in 2024?

The market is anticipated to be worth US$ 12,343.6 million in 2024.

How Much is the Market Estimated to be Worth by the End of 2034?

The market is estimated to reach nearly US$ 33,098.0 million by 2034.

At what CAGR is the Market Expected to Grow Over the Period from 2024 to 2034?

The market revenue is anticipated to increase at a CAGR of around 10.3% during the period from 2024 to 2034.

Who are the Key Players Operating in the market?

Cargill Incorporated, DuPont, BENEO, and ADM are some of the key players operating in the market.

What is the Scope of Dietary Fiber in the United States?

Dietary fiber is expected to progress at a CAGR of 6.0% in the United States.

Table of Content

1. Executive Summary

    1.1. Global Market Outlook

    1.2. Demand Side Trends

    1.3. Supply Side Trends

    1.4. Technology Roadmap

    1.5. Analysis and Recommendations

2. Market Overview

    2.1. Market Coverage / Taxonomy

    2.2. Market Definition

3. Market Background

    3.1. Drivers

        3.1.1. Supply Side Drivers

        3.1.2. Demand Side drivers

        3.1.3. Economic Side Drivers

    3.2. Restraints

    3.3. Opportunity

    3.4. Market trends By Region

    3.5. Forecast Factors - Relevance & Impact

    3.6. Regulations and Policies

4. Global Market- Pricing Analysis

    4.1. Price Point Assessment by Region

        4.1.1. Manufacturer Level Pricing

        4.1.2. Distributor Level Pricing

    4.2. Price Point Assessment By Type

    4.3. Price Forecast till 2033

5. Value Chain Analysis

    5.1. Operating margins at each node of supply chain

    5.2. List of Active Market Participants

6. Global Market Size in Value (US$ million) and Volume (Unit) Analysis 2018 to 2022 and Forecast, 2023 to 2033

    6.1. Historical Market Size in Value (US$ million) and Volume (Unit) Analysis, 2018 to 2022

    6.2. Current and Future Market Size in Value (US$ million) and Volume (Unit) Analysis, 2023 to 2033

        6.2.1. Y-o-Y Growth Trend Analysis

        6.2.2. Absolute $ Opportunity Analysis

7. Global Market Analysis 2018 to 2022 and Forecast 2023 to 2033, By Type

    7.1. Introduction / Key Findings

    7.2. Historical Market Size in Value (US$ million) and Volume (Unit) Analysis By Type, 2018 to 2022

    7.3. Current and Future Market Size in Value (US$ million) and Volume (Unit) Analysis and Forecast By Type, 2023 to 2033

        7.3.1. Soluble

            7.3.1.1. Inulin

            7.3.1.2. Polydextrose

            7.3.1.3. Dietary Fibres

            7.3.1.4. Beta-Glucan

        7.3.2. Insoluble

            7.3.2.1. Cellulose

            7.3.2.2. Hemicellulose

            7.3.2.3. Chitosan

            7.3.2.4. Chitin

            7.3.2.5. Lignin

            7.3.2.6. Resistant Starch

    7.4. Market Attractiveness Analysis By Type

8. Global Market Analysis 2018 to 2022 and Forecast 2023 to 2033, By Source

    8.1. Introduction / Key Findings

    8.2. Historical Market Size in Value (US$ million) and Volume (Unit) Analysis By Source, 2018 to 2022

    8.3. Current and Future Market Size in Value (US$ million) and Volume (Unit) Analysis and Forecast By Source, 2023 to 2033

        8.3.1. Cereals & Grains

            8.3.1.1. Wheat

            8.3.1.2. Rice

            8.3.1.3. Bran

            8.3.1.4. Others

        8.3.2. Fruits & Vegetables

            8.3.2.1. Apples

            8.3.2.2. Others

        8.3.3. Other Crops

    8.4. Market Attractiveness Analysis By Source

9. Global Market Analysis 2018 to 2022 and Forecast 2023 to 2033, By Application

    9.1. Introduction / Key Findings

    9.2. Historical Market Size in Value (US$ million) and Volume (Unit) Analysis By Application, 2018 to 2022

    9.3. Current and Future Market Size in Value (US$ million) and Volume (Unit) Analysis and Forecast By End Use, 2023 to 2033

        9.3.1. Functional Food & Beverages

        9.3.2. Animal Feed

        9.3.3. Pet Food

        9.3.4. Pharmaceuticals

    9.4. Market Attractiveness Analysis By End Use

10. Global Market Analysis 2018 to 2022 and Forecast 2023 to 2033, by Region

    10.1. Introduction

    10.2. Historical Market Size in Value (US$ million) and Volume (Unit) Analysis By Region, 2018 to 2022

    10.3. Current Market Size in Value (US$ million) and Volume (Unit) Analysis and Forecast By Region, 2023 to 2033

        10.3.1. North America

        10.3.2. Latin America

        10.3.3. Europe

        10.3.4. East Asia

        10.3.5. South Asia

        10.3.6. Oceania

        10.3.7. Middle East & Africa

    10.4. Market Attractiveness Analysis By Region

11. North America Market Analysis 2018 to 2022 and Forecast 2023 to 2033

    11.1. Introduction

    11.2. Historical Market Size (US$ million) and Volume(Unit) Trend Analysis By Market Taxonomy, 2018 to 2022

    11.3. Market Size (US$ million) and Volume(Unit) Forecast By Market Taxonomy, 2023 to 2033

        11.3.1. By Country

            11.3.1.1. United States

            11.3.1.2. Canada

        11.3.2. By Type

        11.3.3. By Source

        11.3.4. By Application

    11.4. Market Attractiveness Analysis

        11.4.1. By Country

        11.4.2. By Type

        11.4.3. By Source

        11.4.4. By Application

    11.5. Key takeaways

12. Latin America Market Analysis 2018 to 2022 and Forecast 2023 to 2033

    12.1. Introduction

    12.2. Historical Market Size (US$ million) and Volume(Unit) Trend Analysis By Market Taxonomy, 2018 to 2022

    12.3. Market Size (US$ million) and Volume (Unit) Forecast By Market Taxonomy, 2023 to 2033

        12.3.1. By Country

            12.3.1.1. Brazil

            12.3.1.2. Mexico

            12.3.1.3. Argentina

            12.3.1.4. Rest of Latin America

        12.3.2. By Type

        12.3.3. By Source

        12.3.4. By Application

    12.4. Market Attractiveness Analysis

        12.4.1. By Country

        12.4.2. By Type

        12.4.3. By Source

        12.4.4. By Application

    12.5. Key takeaways

13. Europe Market Analysis 2018 to 2022 and Forecast 2023 to 2033

    13.1. Introduction

    13.2. Historical Market Size (US$ million) and Volume(Unit) Trend Analysis By Market Taxonomy, 2018 to 2022

    13.3. Market Size (US$ million) and Volume(Unit) Forecast By Market Taxonomy, 2023 to 2033

        13.3.1. By Country

            13.3.1.1. Germany

            13.3.1.2. United Kingdom

            13.3.1.3. France

            13.3.1.4. Italy

            13.3.1.5. Spain

            13.3.1.6. BENELUX

            13.3.1.7. Nordic

            13.3.1.8. Russia

            13.3.1.9. Poland

            13.3.1.10. Rest of Europe

        13.3.2. By Type

        13.3.3. By Source

        13.3.4. By Application

    13.4. Market Attractiveness Analysis

        13.4.1. By Country

        13.4.2. By Type

        13.4.3. By Source

        13.4.4. By Application

    13.5. Key takeaways

14. East Asia Market Analysis 2018 to 2022 and Forecast 2023 to 2033

    14.1. Introduction

    14.2. Historical Market Size (US$ million) and Volume(Unit) Trend Analysis By Market Taxonomy, 2018 to 2022

    14.3. Market Size (US$ million) and Volume(Unit) Forecast By Market Taxonomy, 2023 to 2033

        14.3.1. By Country

            14.3.1.1. China

            14.3.1.2. Japan

            14.3.1.3. South Korea

        14.3.2. By Type

        14.3.3. By Source

        14.3.4. By Application

    14.4. Market Attractiveness Analysis

        14.4.1. By Country

        14.4.2. By Type

        14.4.3. By Source

        14.4.4. By Application

    14.5. Key takeaways

15. South Asia Market Analysis 2018 to 2022 and Forecast 2023 to 2033

    15.1. Introduction

    15.2. Historical Market Size (US$ million) and Volume(Unit) Trend Analysis By Market Taxonomy, 2018 to 2022

    15.3. Market Size (US$ million) and Volume(Unit) Forecast By Market Taxonomy, 2023 to 2033

        15.3.1. By Country

            15.3.1.1. India

            15.3.1.2. Thailand

            15.3.1.3. Malaysia

            15.3.1.4. Indonesia

            15.3.1.5. Vietnam

            15.3.1.6. Philippines

            15.3.1.7. Singapore

            15.3.1.8. Rest of South Asia

        15.3.2. By Type

        15.3.3. By Source

        15.3.4. By Application

    15.4. Market Attractiveness Analysis

        15.4.1. By Country

        15.4.2. By Type

        15.4.3. By Source

        15.4.4. By Application

    15.5. Key takeaways

16. Oceania Market Analysis 2018 to 2022 and Forecast 2023 to 2033

    16.1. Introduction

    16.2. Historical Market Size (US$ million) and Volume(Unit) Trend Analysis By Market Taxonomy, 2018 to 2022

    16.3. Market Size (US$ million) and Volume(Unit) Forecast By Market Taxonomy, 2023 to 2033

        16.3.1. By Country

            16.3.1.1. Australia

            16.3.1.2. New Zealand

        16.3.2. By Type

        16.3.3. By Source

        16.3.4. By Application

    16.4. Market Attractiveness Analysis

        16.4.1. By Country

        16.4.2. By Type

        16.4.3. By Source

        16.4.4. By Application

    16.5. Key takeaways

17. MEA Market Analysis 2018 to 2022 and Forecast 2023 to 2033

    17.1. Introduction

    17.2. Historical Market Size (US$ million) and Volume(Unit) Trend Analysis By Market Taxonomy, 2018 to 2022

    17.3. Market Size (US$ million) and Volume(Unit) Forecast By Market Taxonomy, 2023 to 2033

        17.3.1. By Country

            17.3.1.1. GCC Countries

            17.3.1.2. Turkeye

            17.3.1.3. Egypt

            17.3.1.4. South Africa

            17.3.1.5. Rest of MEA

        17.3.2. By Type

        17.3.3. By Source

        17.3.4. By Application

    17.4. Market Attractiveness Analysis

        17.4.1. By Country

        17.4.2. By Type

        17.4.3. By Source

        17.4.4. By Application

    17.5. Key takeaways

18. Country-level Market Analysis, 2022

    18.1. United States Market Analysis

        18.1.1. By Type

        18.1.2. By Source

        18.1.3. By Application

    18.2. Canada Market Analysis

        18.2.1. By Type

        18.2.2. By Source

        18.2.3. By Application

    18.3. Brazil Market Analysis

        18.3.1. By Type

        18.3.2. By Source

        18.3.3. By Application

    18.4. Mexico Market Analysis

        18.4.1. By Type

        18.4.2. By Source

        18.4.3. By Application

    18.5. Argentina Market Analysis

        18.5.1. By Type

        18.5.2. By Source

        18.5.3. By Application

    18.6. Germany Market Analysis

        18.6.1. By Type

        18.6.2. By Source

        18.6.3. By Application

    18.7. United Kingdom Market Analysis

        18.7.1. By Type

        18.7.2. By Source

        18.7.3. By Application

    18.8. France Market Analysis

        18.8.1. By Type

        18.8.2. By Source

        18.8.3. By Application

    18.9. Italy Market Analysis

        18.9.1. By Type

        18.9.2. By Source

        18.9.3. By Application

    18.10. Spain Market Analysis

        18.10.1. By Type

        18.10.2. By Source

        18.10.3. By Application

    18.11. BENELUX Market Analysis

        18.11.1. By Type

        18.11.2. By Source

        18.11.3. By Application

    18.12. Nordic Market Analysis

        18.12.1. By Type

        18.12.2. By Source

        18.12.3. By Application

    18.13. Russia Region Market Analysis

        18.13.1. By Type

        18.13.2. By Source

        18.13.3. By Application

    18.14. Poland Market Analysis

        18.14.1. By Type

        18.14.2. By Source

        18.14.3. By Application

    18.15. China Market Analysis

        18.15.1. By Type

        18.15.2. By Source

        18.15.3. By Application

    18.16. Japan Market Analysis

        18.16.1. By Type

        18.16.2. By Source

        18.16.3. By Application

    18.17. South Korea Market Analysis

        18.17.1. By Type

        18.17.2. By Source

        18.17.3. By Application

    18.18. India Market Analysis

        18.18.1. By Type

        18.18.2. By Source

        18.18.3. By Application

    18.19. Thailand Market Analysis

        18.19.1. By Type

        18.19.2. By Source

        18.19.3. By Application

    18.20. Malaysia Market Analysis

        18.20.1. By Type

        18.20.2. By Source

        18.20.3. By Application

    18.21. Indonesia Market Analysis

        18.21.1. By Type

        18.21.2. By Source

        18.21.3. By Application

    18.22. Vietnam Market Analysis

        18.22.1. By Type

        18.22.2. By Source

        18.22.3. By Application

    18.23. Philippines Market Analysis

        18.23.1. By Type

        18.23.2. By Source

        18.23.3. By Application

    18.24. Singapore Market Analysis

        18.24.1. By Type

        18.24.2. By Source

        18.24.3. By Application

    18.25. Australia Market Analysis

        18.25.1. By Type

        18.25.2. By Source

        18.25.3. By Application

    18.26. New Zealand Market Analysis

        18.26.1. By Type

        18.26.2. By Source

        18.26.3. By Application

    18.27. GCC Countries Market Analysis

        18.27.1. By Type

        18.27.2. By Source

        18.27.3. By Application

    18.28. Turkey Market Analysis

        18.28.1. By Type

        18.28.2. By Source

        18.28.3. By Application

    18.29. Egypt Market Analysis

        18.29.1. By Type

        18.29.2. By Source

        18.29.3. By Application

    18.30. South Africa Market Analysis

        18.30.1. By Type

        18.30.2. By Source

        18.30.3. By Application

19. Market Structure Analysis

    19.1. Global Market Competition - a Dashboard View

    19.2. Industry Structure Analysis

        19.2.1. % tier 1 market players

        19.2.2. % tier 2 market players

        19.2.3. % tier 3 market players

    19.3. Global Market Company Share Analysis

        19.3.1. For Tier 1 Market Players, 2023

        19.3.2. Company Market Share Analysis of Top 5 Players, By Region

    19.4. Key Participants Market Presence (Intensity Mapping) by Region

20. Competition Analysis

    20.1. Competition Dashboard

    20.2. Competition Benchmarking

    20.3. Competition Deep Dive

        20.3.1. DIC Corporation

            20.3.1.1. Product Portfolio

            20.3.1.2. Product Claim

            20.3.1.3. Revenue by Market Segments (Product/Channel/Region)

            20.3.1.4. Sales Footprint

            20.3.1.5. Strategy Overview

                20.3.1.5.1. Marketing Strategy

                20.3.1.5.2. Product Strategy

                20.3.1.5.3. Channel Strategy

            20.3.1.6. SWOT Analysis

        20.3.2. Church & Dwight Co Inc

        20.3.3. Hero Nutritionals LLC

        20.3.4. Nutranext

        20.3.5. Herbaland Naturals Inc

        20.3.6. ABH Nature's Products, Inc

        20.3.7. Life Science Nutritionals

        20.3.8. Bayer AG

        20.3.9. Zanon Vitamec

        20.3.10. The Honest Company, Inc

        20.3.11. Pharmavite LLC

        20.3.12. Boscogen Inc

        20.3.13. Pharmavite

        20.3.14. Wellnext Health

        20.3.15. Taura Natural Ingredients Ltd

        20.3.16. Viva 5 Corporation

        20.3.17. Other Players (On Additional Requests)

21. Research Methodology

Don't pay for what you don't need

Customize your report by selecting specific countries or regions and save 30%!

List of Tables

Table 1: Global Market Value (US$ million) Forecast by Region, 2018 to 2033

Table 2: Global Market Volume (MT) Forecast by Region, 2018 to 2033

Table 3: Global Market Value (US$ million) Forecast by Type, 2018 to 2033

Table 4: Global Market Volume (MT) Forecast by Type, 2018 to 2033

Table 5: Global Market Value (US$ million) Forecast by Source, 2018 to 2033

Table 6: Global Market Volume (MT) Forecast by Source, 2018 to 2033

Table 7: Global Market Value (US$ million) Forecast by Application, 2018 to 2033

Table 8: Global Market Volume (MT) Forecast by Application, 2018 to 2033

Table 9: North America Market Value (US$ million) Forecast by Country, 2018 to 2033

Table 10: North America Market Volume (MT) Forecast by Country, 2018 to 2033

Table 11: North America Market Value (US$ million) Forecast by Type, 2018 to 2033

Table 12: North America Market Volume (MT) Forecast by Type, 2018 to 2033

Table 13: North America Market Value (US$ million) Forecast by Source, 2018 to 2033

Table 14: North America Market Volume (MT) Forecast by Source, 2018 to 2033

Table 15: North America Market Value (US$ million) Forecast by Application, 2018 to 2033

Table 16: North America Market Volume (MT) Forecast by Application, 2018 to 2033

Table 17: Latin America Market Value (US$ million) Forecast by Country, 2018 to 2033

Table 18: Latin America Market Volume (MT) Forecast by Country, 2018 to 2033

Table 19: Latin America Market Value (US$ million) Forecast by Type, 2018 to 2033

Table 20: Latin America Market Volume (MT) Forecast by Type, 2018 to 2033

Table 21: Latin America Market Value (US$ million) Forecast by Source, 2018 to 2033

Table 22: Latin America Market Volume (MT) Forecast by Source, 2018 to 2033

Table 23: Latin America Market Value (US$ million) Forecast by Application, 2018 to 2033

Table 24: Latin America Market Volume (MT) Forecast by Application, 2018 to 2033

Table 25: Europe Market Value (US$ million) Forecast by Country, 2018 to 2033

Table 26: Europe Market Volume (MT) Forecast by Country, 2018 to 2033

Table 27: Europe Market Value (US$ million) Forecast by Type, 2018 to 2033

Table 28: Europe Market Volume (MT) Forecast by Type, 2018 to 2033

Table 29: Europe Market Value (US$ million) Forecast by Source, 2018 to 2033

Table 30: Europe Market Volume (MT) Forecast by Source, 2018 to 2033

Table 31: Europe Market Value (US$ million) Forecast by Application, 2018 to 2033

Table 32: Europe Market Volume (MT) Forecast by Application, 2018 to 2033

Table 33: East Asia Market Value (US$ million) Forecast by Country, 2018 to 2033

Table 34: East Asia Market Volume (MT) Forecast by Country, 2018 to 2033

Table 35: East Asia Market Value (US$ million) Forecast by Type, 2018 to 2033

Table 36: East Asia Market Volume (MT) Forecast by Type, 2018 to 2033

Table 37: East Asia Market Value (US$ million) Forecast by Source, 2018 to 2033

Table 38: East Asia Market Volume (MT) Forecast by Source, 2018 to 2033

Table 39: East Asia Market Value (US$ million) Forecast by Application, 2018 to 2033

Table 40: East Asia Market Volume (MT) Forecast by Application, 2018 to 2033

Table 41: South Asia Market Value (US$ million) Forecast by Country, 2018 to 2033

Table 42: South Asia Market Volume (MT) Forecast by Country, 2018 to 2033

Table 43: South Asia Market Value (US$ million) Forecast by Type, 2018 to 2033

Table 44: South Asia Market Volume (MT) Forecast by Type, 2018 to 2033

Table 45: South Asia Market Value (US$ million) Forecast by Source, 2018 to 2033

Table 46: South Asia Market Volume (MT) Forecast by Source, 2018 to 2033

Table 47: South Asia Market Value (US$ million) Forecast by Application, 2018 to 2033

Table 48: South Asia Market Volume (MT) Forecast by Application, 2018 to 2033

Table 49: Oceania Market Value (US$ million) Forecast by Country, 2018 to 2033

Table 50: Oceania Market Volume (MT) Forecast by Country, 2018 to 2033

Table 51: Oceania Market Value (US$ million) Forecast by Type, 2018 to 2033

Table 52: Oceania Market Volume (MT) Forecast by Type, 2018 to 2033

Table 53: Oceania Market Value (US$ million) Forecast by Source, 2018 to 2033

Table 54: Oceania Market Volume (MT) Forecast by Source, 2018 to 2033

Table 55: Oceania Market Value (US$ million) Forecast by Application, 2018 to 2033

Table 56: Oceania Market Volume (MT) Forecast by Application, 2018 to 2033

Table 57: MEA Market Value (US$ million) Forecast by Country, 2018 to 2033

Table 58: MEA Market Volume (MT) Forecast by Country, 2018 to 2033

Table 59: MEA Market Value (US$ million) Forecast by Type, 2018 to 2033

Table 60: MEA Market Volume (MT) Forecast by Type, 2018 to 2033

Table 61: MEA Market Value (US$ million) Forecast by Source, 2018 to 2033

Table 62: MEA Market Volume (MT) Forecast by Source, 2018 to 2033

Table 63: MEA Market Value (US$ million) Forecast by Application, 2018 to 2033

Table 64: MEA Market Volume (MT) Forecast by Application, 2018 to 2033
Nandini Roy Choudhury

Principal Consultant

Talk to Analyst

Find your sweet spots for generating winning opportunities in this market.

List of Charts

Figure 1: Global Market Value (US$ million) by Type, 2023 to 2033

Figure 2: Global Market Value (US$ million) by Source, 2023 to 2033

Figure 3: Global Market Value (US$ million) by Application, 2023 to 2033

Figure 4: Global Market Value (US$ million) by Region, 2023 to 2033

Figure 5: Global Market Value (US$ million) Analysis by Region, 2018 to 2033

Figure 6: Global Market Volume (MT) Analysis by Region, 2018 to 2033

Figure 7: Global Market Value Share (%) and BPS Analysis by Region, 2023 to 2033

Figure 8: Global Market Y-o-Y Growth (%) Projections by Region, 2023 to 2033

Figure 9: Global Market Value (US$ million) Analysis by Type, 2018 to 2033

Figure 10: Global Market Volume (MT) Analysis by Type, 2018 to 2033

Figure 11: Global Market Value Share (%) and BPS Analysis by Type, 2023 to 2033

Figure 12: Global Market Y-o-Y Growth (%) Projections by Type, 2023 to 2033

Figure 13: Global Market Value (US$ million) Analysis by Source, 2018 to 2033

Figure 14: Global Market Volume (MT) Analysis by Source, 2018 to 2033

Figure 15: Global Market Value Share (%) and BPS Analysis by Source, 2023 to 2033

Figure 16: Global Market Y-o-Y Growth (%) Projections by Source, 2023 to 2033

Figure 17: Global Market Value (US$ million) Analysis by Application, 2018 to 2033

Figure 18: Global Market Volume (MT) Analysis by Application, 2018 to 2033

Figure 19: Global Market Value Share (%) and BPS Analysis by Application, 2023 to 2033

Figure 20: Global Market Y-o-Y Growth (%) Projections by Application, 2023 to 2033

Figure 21: Global Market Attractiveness by Type, 2023 to 2033

Figure 22: Global Market Attractiveness by Source, 2023 to 2033

Figure 23: Global Market Attractiveness by Application, 2023 to 2033

Figure 24: Global Market Attractiveness by Region, 2023 to 2033

Figure 25: North America Market Value (US$ million) by Type, 2023 to 2033

Figure 26: North America Market Value (US$ million) by Source, 2023 to 2033

Figure 27: North America Market Value (US$ million) by Application, 2023 to 2033

Figure 28: North America Market Value (US$ million) by Country, 2023 to 2033

Figure 29: North America Market Value (US$ million) Analysis by Country, 2018 to 2033

Figure 30: North America Market Volume (MT) Analysis by Country, 2018 to 2033

Figure 31: North America Market Value Share (%) and BPS Analysis by Country, 2023 to 2033

Figure 32: North America Market Y-o-Y Growth (%) Projections by Country, 2023 to 2033

Figure 33: North America Market Value (US$ million) Analysis by Type, 2018 to 2033

Figure 34: North America Market Volume (MT) Analysis by Type, 2018 to 2033

Figure 35: North America Market Value Share (%) and BPS Analysis by Type, 2023 to 2033

Figure 36: North America Market Y-o-Y Growth (%) Projections by Type, 2023 to 2033

Figure 37: North America Market Value (US$ million) Analysis by Source, 2018 to 2033

Figure 38: North America Market Volume (MT) Analysis by Source, 2018 to 2033

Figure 39: North America Market Value Share (%) and BPS Analysis by Source, 2023 to 2033

Figure 40: North America Market Y-o-Y Growth (%) Projections by Source, 2023 to 2033

Figure 41: North America Market Value (US$ million) Analysis by Application, 2018 to 2033

Figure 42: North America Market Volume (MT) Analysis by Application, 2018 to 2033

Figure 43: North America Market Value Share (%) and BPS Analysis by Application, 2023 to 2033

Figure 44: North America Market Y-o-Y Growth (%) Projections by Application, 2023 to 2033

Figure 45: North America Market Attractiveness by Type, 2023 to 2033

Figure 46: North America Market Attractiveness by Source, 2023 to 2033

Figure 47: North America Market Attractiveness by Application, 2023 to 2033

Figure 48: North America Market Attractiveness by Country, 2023 to 2033

Figure 49: Latin America Market Value (US$ million) by Type, 2023 to 2033

Figure 50: Latin America Market Value (US$ million) by Source, 2023 to 2033

Figure 51: Latin America Market Value (US$ million) by Application, 2023 to 2033

Figure 52: Latin America Market Value (US$ million) by Country, 2023 to 2033

Figure 53: Latin America Market Value (US$ million) Analysis by Country, 2018 to 2033

Figure 54: Latin America Market Volume (MT) Analysis by Country, 2018 to 2033

Figure 55: Latin America Market Value Share (%) and BPS Analysis by Country, 2023 to 2033

Figure 56: Latin America Market Y-o-Y Growth (%) Projections by Country, 2023 to 2033

Figure 57: Latin America Market Value (US$ million) Analysis by Type, 2018 to 2033

Figure 58: Latin America Market Volume (MT) Analysis by Type, 2018 to 2033

Figure 59: Latin America Market Value Share (%) and BPS Analysis by Type, 2023 to 2033

Figure 60: Latin America Market Y-o-Y Growth (%) Projections by Type, 2023 to 2033

Figure 61: Latin America Market Value (US$ million) Analysis by Source, 2018 to 2033

Figure 62: Latin America Market Volume (MT) Analysis by Source, 2018 to 2033

Figure 63: Latin America Market Value Share (%) and BPS Analysis by Source, 2023 to 2033

Figure 64: Latin America Market Y-o-Y Growth (%) Projections by Source, 2023 to 2033

Figure 65: Latin America Market Value (US$ million) Analysis by Application, 2018 to 2033

Figure 66: Latin America Market Volume (MT) Analysis by Application, 2018 to 2033

Figure 67: Latin America Market Value Share (%) and BPS Analysis by Application, 2023 to 2033

Figure 68: Latin America Market Y-o-Y Growth (%) Projections by Application, 2023 to 2033

Figure 69: Latin America Market Attractiveness by Type, 2023 to 2033

Figure 70: Latin America Market Attractiveness by Source, 2023 to 2033

Figure 71: Latin America Market Attractiveness by Application, 2023 to 2033

Figure 72: Latin America Market Attractiveness by Country, 2023 to 2033

Figure 73: Europe Market Value (US$ million) by Type, 2023 to 2033

Figure 74: Europe Market Value (US$ million) by Source, 2023 to 2033

Figure 75: Europe Market Value (US$ million) by Application, 2023 to 2033

Figure 76: Europe Market Value (US$ million) by Country, 2023 to 2033

Figure 77: Europe Market Value (US$ million) Analysis by Country, 2018 to 2033

Figure 78: Europe Market Volume (MT) Analysis by Country, 2018 to 2033

Figure 79: Europe Market Value Share (%) and BPS Analysis by Country, 2023 to 2033

Figure 80: Europe Market Y-o-Y Growth (%) Projections by Country, 2023 to 2033

Figure 81: Europe Market Value (US$ million) Analysis by Type, 2018 to 2033

Figure 82: Europe Market Volume (MT) Analysis by Type, 2018 to 2033

Figure 83: Europe Market Value Share (%) and BPS Analysis by Type, 2023 to 2033

Figure 84: Europe Market Y-o-Y Growth (%) Projections by Type, 2023 to 2033

Figure 85: Europe Market Value (US$ million) Analysis by Source, 2018 to 2033

Figure 86: Europe Market Volume (MT) Analysis by Source, 2018 to 2033

Figure 87: Europe Market Value Share (%) and BPS Analysis by Source, 2023 to 2033

Figure 88: Europe Market Y-o-Y Growth (%) Projections by Source, 2023 to 2033

Figure 89: Europe Market Value (US$ million) Analysis by Application, 2018 to 2033

Figure 90: Europe Market Volume (MT) Analysis by Application, 2018 to 2033

Figure 91: Europe Market Value Share (%) and BPS Analysis by Application, 2023 to 2033

Figure 92: Europe Market Y-o-Y Growth (%) Projections by Application, 2023 to 2033

Figure 93: Europe Market Attractiveness by Type, 2023 to 2033

Figure 94: Europe Market Attractiveness by Source, 2023 to 2033

Figure 95: Europe Market Attractiveness by Application, 2023 to 2033

Figure 96: Europe Market Attractiveness by Country, 2023 to 2033

Figure 97: East Asia Market Value (US$ million) by Type, 2023 to 2033

Figure 98: East Asia Market Value (US$ million) by Source, 2023 to 2033

Figure 99: East Asia Market Value (US$ million) by Application, 2023 to 2033

Figure 100: East Asia Market Value (US$ million) by Country, 2023 to 2033

Figure 101: East Asia Market Value (US$ million) Analysis by Country, 2018 to 2033

Figure 102: East Asia Market Volume (MT) Analysis by Country, 2018 to 2033

Figure 103: East Asia Market Value Share (%) and BPS Analysis by Country, 2023 to 2033

Figure 104: East Asia Market Y-o-Y Growth (%) Projections by Country, 2023 to 2033

Figure 105: East Asia Market Value (US$ million) Analysis by Type, 2018 to 2033

Figure 106: East Asia Market Volume (MT) Analysis by Type, 2018 to 2033

Figure 107: East Asia Market Value Share (%) and BPS Analysis by Type, 2023 to 2033

Figure 108: East Asia Market Y-o-Y Growth (%) Projections by Type, 2023 to 2033

Figure 109: East Asia Market Value (US$ million) Analysis by Source, 2018 to 2033

Figure 110: East Asia Market Volume (MT) Analysis by Source, 2018 to 2033

Figure 111: East Asia Market Value Share (%) and BPS Analysis by Source, 2023 to 2033

Figure 112: East Asia Market Y-o-Y Growth (%) Projections by Source, 2023 to 2033

Figure 113: East Asia Market Value (US$ million) Analysis by Application, 2018 to 2033

Figure 114: East Asia Market Volume (MT) Analysis by Application, 2018 to 2033

Figure 115: East Asia Market Value Share (%) and BPS Analysis by Application, 2023 to 2033

Figure 116: East Asia Market Y-o-Y Growth (%) Projections by Application, 2023 to 2033

Figure 117: East Asia Market Attractiveness by Type, 2023 to 2033

Figure 118: East Asia Market Attractiveness by Source, 2023 to 2033

Figure 119: East Asia Market Attractiveness by Application, 2023 to 2033

Figure 120: East Asia Market Attractiveness by Country, 2023 to 2033

Figure 121: South Asia Market Value (US$ million) by Type, 2023 to 2033

Figure 122: South Asia Market Value (US$ million) by Source, 2023 to 2033

Figure 123: South Asia Market Value (US$ million) by Application, 2023 to 2033

Figure 124: South Asia Market Value (US$ million) by Country, 2023 to 2033

Figure 125: South Asia Market Value (US$ million) Analysis by Country, 2018 to 2033

Figure 126: South Asia Market Volume (MT) Analysis by Country, 2018 to 2033

Figure 127: South Asia Market Value Share (%) and BPS Analysis by Country, 2023 to 2033

Figure 128: South Asia Market Y-o-Y Growth (%) Projections by Country, 2023 to 2033

Figure 129: South Asia Market Value (US$ million) Analysis by Type, 2018 to 2033

Figure 130: South Asia Market Volume (MT) Analysis by Type, 2018 to 2033

Figure 131: South Asia Market Value Share (%) and BPS Analysis by Type, 2023 to 2033

Figure 132: South Asia Market Y-o-Y Growth (%) Projections by Type, 2023 to 2033

Figure 133: South Asia Market Value (US$ million) Analysis by Source, 2018 to 2033

Figure 134: South Asia Market Volume (MT) Analysis by Source, 2018 to 2033

Figure 135: South Asia Market Value Share (%) and BPS Analysis by Source, 2023 to 2033

Figure 136: South Asia Market Y-o-Y Growth (%) Projections by Source, 2023 to 2033

Figure 137: South Asia Market Value (US$ million) Analysis by Application, 2018 to 2033

Figure 138: South Asia Market Volume (MT) Analysis by Application, 2018 to 2033

Figure 139: South Asia Market Value Share (%) and BPS Analysis by Application, 2023 to 2033

Figure 140: South Asia Market Y-o-Y Growth (%) Projections by Application, 2023 to 2033

Figure 141: South Asia Market Attractiveness by Type, 2023 to 2033

Figure 142: South Asia Market Attractiveness by Source, 2023 to 2033

Figure 143: South Asia Market Attractiveness by Application, 2023 to 2033

Figure 144: South Asia Market Attractiveness by Country, 2023 to 2033

Figure 145: Oceania Market Value (US$ million) by Type, 2023 to 2033

Figure 146: Oceania Market Value (US$ million) by Source, 2023 to 2033

Figure 147: Oceania Market Value (US$ million) by Application, 2023 to 2033

Figure 148: Oceania Market Value (US$ million) by Country, 2023 to 2033

Figure 149: Oceania Market Value (US$ million) Analysis by Country, 2018 to 2033

Figure 150: Oceania Market Volume (MT) Analysis by Country, 2018 to 2033

Figure 151: Oceania Market Value Share (%) and BPS Analysis by Country, 2023 to 2033

Figure 152: Oceania Market Y-o-Y Growth (%) Projections by Country, 2023 to 2033

Figure 153: Oceania Market Value (US$ million) Analysis by Type, 2018 to 2033

Figure 154: Oceania Market Volume (MT) Analysis by Type, 2018 to 2033

Figure 155: Oceania Market Value Share (%) and BPS Analysis by Type, 2023 to 2033

Figure 156: Oceania Market Y-o-Y Growth (%) Projections by Type, 2023 to 2033

Figure 157: Oceania Market Value (US$ million) Analysis by Source, 2018 to 2033

Figure 158: Oceania Market Volume (MT) Analysis by Source, 2018 to 2033

Figure 159: Oceania Market Value Share (%) and BPS Analysis by Source, 2023 to 2033

Figure 160: Oceania Market Y-o-Y Growth (%) Projections by Source, 2023 to 2033

Figure 161: Oceania Market Value (US$ million) Analysis by Application, 2018 to 2033

Figure 162: Oceania Market Volume (MT) Analysis by Application, 2018 to 2033

Figure 163: Oceania Market Value Share (%) and BPS Analysis by Application, 2023 to 2033

Figure 164: Oceania Market Y-o-Y Growth (%) Projections by Application, 2023 to 2033

Figure 165: Oceania Market Attractiveness by Type, 2023 to 2033

Figure 166: Oceania Market Attractiveness by Source, 2023 to 2033

Figure 167: Oceania Market Attractiveness by Application, 2023 to 2033

Figure 168: Oceania Market Attractiveness by Country, 2023 to 2033

Figure 169: MEA Market Value (US$ million) by Type, 2023 to 2033

Figure 170: MEA Market Value (US$ million) by Source, 2023 to 2033

Figure 171: MEA Market Value (US$ million) by Application, 2023 to 2033

Figure 172: MEA Market Value (US$ million) by Country, 2023 to 2033

Figure 173: MEA Market Value (US$ million) Analysis by Country, 2018 to 2033

Figure 174: MEA Market Volume (MT) Analysis by Country, 2018 to 2033

Figure 175: MEA Market Value Share (%) and BPS Analysis by Country, 2023 to 2033

Figure 176: MEA Market Y-o-Y Growth (%) Projections by Country, 2023 to 2033

Figure 177: MEA Market Value (US$ million) Analysis by Type, 2018 to 2033

Figure 178: MEA Market Volume (MT) Analysis by Type, 2018 to 2033

Figure 179: MEA Market Value Share (%) and BPS Analysis by Type, 2023 to 2033

Figure 180: MEA Market Y-o-Y Growth (%) Projections by Type, 2023 to 2033

Figure 181: MEA Market Value (US$ million) Analysis by Source, 2018 to 2033

Figure 182: MEA Market Volume (MT) Analysis by Source, 2018 to 2033

Figure 183: MEA Market Value Share (%) and BPS Analysis by Source, 2023 to 2033

Figure 184: MEA Market Y-o-Y Growth (%) Projections by Source, 2023 to 2033

Figure 185: MEA Market Value (US$ million) Analysis by Application, 2018 to 2033

Figure 186: MEA Market Volume (MT) Analysis by Application, 2018 to 2033

Figure 187: MEA Market Value Share (%) and BPS Analysis by Application, 2023 to 2033

Figure 188: MEA Market Y-o-Y Growth (%) Projections by Application, 2023 to 2033

Figure 189: MEA Market Attractiveness by Type, 2023 to 2033

Figure 190: MEA Market Attractiveness by Source, 2023 to 2033

Figure 191: MEA Market Attractiveness by Application, 2023 to 2033

Figure 192: MEA Market Attractiveness by Country, 2023 to 2033

Recommendations

Food and Beverage

Soluble Corn Fiber Market

Published : January 2024

Food and Beverage

Insoluble Dietary Fiber Market

Published : July 2022

Explore Food and Beverage Insights

View Reports