Pet Dietary Supplements Market
“Increased Pet Humanization along with Expanding Pet Care Awareness propels the Pet Dietary Supplements Market Growth. FMI Observes Strategic Investment Opportunities in 30+ Countries.”
Pet Dietary Supplements Market By Product Type, Application & Region – Forecast 2023–2033
Pet Dietary Supplements Market Outlook 2023–2033
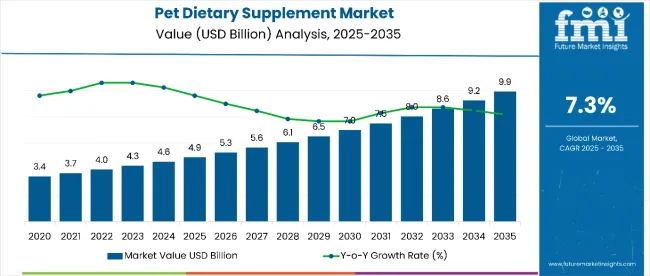
The pet dietary supplements market is anticipated to expand its boundaries at a steady CAGR of 7.3% during the forecast period. The market holds a share of US$ 4.3 Bn in 2023 while expecting revenue of US$ 8.7 Bn by 2033.
Pet dietary supplements market outlook explains that the market is likely to thrive in the forecast period due to the rising pet humanization along with higher pet adoption during the forecast period. The wide range of pet diseases due to domestication and new viruses spreading is expanding the market size. Vendors now create new supplements backed by research and development programs that help them choose the right element to add to their supplement formula. Advanced veterinary research organizations tie up with private pet supplements and medication centers to provide an effective proportion of nutrients.
A higher number of orphaned pets is another reason that fuels the demand for pet dietary supplements, as these pets are usually malnutritional and require protein fulfillment. Government programs supporting the pet pharma brands to ensure the industry's expansion help in fueling the sales of pet dietary supplements. New products such as chewable tablets, gels, and food mixes help in providing the right nutrients to dogs, cats, and other pets while also taking care of the taste. With new startups coming into the market, organic supplements are going to replace the major share of processed supplements. Thus, the pet dietary supplements market is dynamic and has the potential.
Attributes |
Details |
Pet Dietary Supplements Market CAGR (2023-2033) |
7.3% |
Pet Dietary Supplements Market Size (2023) |
US$ 4.3 billion |
Pet Dietary Supplements Market Size (2033) |
US$ 8.7 billion |
Let us know your requirement to get
100% FREE customization
How is the Future Outlook for Pet dietary supplements Market in Comparison to Historical Pattern?
Short-term Growth: The pet dietary supplements market is quite dynamic and is expanding at a fast pace. The use of dietary supplements or nutraceuticals for pets is increasing in response to the rising number of pet parents. Several veterinarians and practitioners have added private-label brands or even their own-label supplements and nutraceuticals for sale within the clinic, fueling the demand.
Mid-term Growth: Nutritional supplements are known as complementary needs. Since there is an increasing value attached to the comfort and health of pets, people have started to go beyond just basic pet food. The pet care industry is experiencing a slight transition towards high-end pet foods, such as organic, grain-free, refrigerated, and raw food. Subsequently, the pet dietary supplements market is witnessing exemplary growth.
Nowadays, pet humanization is a popular trend where owners are treating their pets as counterparts and are willing to spend to provide their pets with human-like products or experiences. Pet humanization is a major reason behind the increase in the demand for luxury goods in the pet care industry. As pets are treated as an integral part of the family, people owning pets take care of their pets in a manner similar to parents taking care of their children in a family.
Long-term Growth: Many even consider pet parenting as preparation for parenting a baby. This is a significant reason for not hesitating to spend for the well-being of their pets. The impact of this trend is positively felt on the pet dietary supplements market, which according to FMI, is projected to rise at a CAGR of 7.3% between 2023 and 2033
How Is Increasing Pet Adoption Affecting Pet Dietary Supplements Sales?
According to the statistics of National Pet Owners in 2019, the number of pet owners increased by 11% from 1988. In 2019, around 67% of U.S. households owned a pet, among which dogs are a popular pet owned by the majority of households.
Besides this, according to the Pet Food Manufacturers Association in the United Kingdom, in 2019, 40% of households (around 12 million) owned a pet, among which 25% owned a dog. The global increase in pet adoption for companionship is indicative of growing affection toward pet animals.
This also reflects in behaviour of pet owners as they are more willing to spend on healthier food and supplements for their pets. Pet adoption trends are expected to create lucrative opportunities for the overall expansion of the market.
Find your sweet spots for generating winning opportunities in this market.
Talk to AnalystWhat is the Commercial Potential of Pet Dietary Supplements?
Pet dietary supplements will continue witnessing high sales, thanks to their increasing visibility across ecommerce platforms and other online channels. The overall awareness about the various nutritional benefits of dietary supplements for pets is growing. For instance, probiotic supplements contain bacteria and are known for their benefits in keeping the digestive tract healthy.
Besides this, there is high demand for nutritional supplements to prevent the risk of chronic ailments in pets, which is a key factor driving pet dietary supplements sales globally. Against this backdrop, the demand for supplements such as fish oil, amino acid, biotin, and others has increased to improve the overall health of pets.
Canine multivitamins promote better health by improving levels of essential vitamins and minerals in the diet. Multivitamin supplements complete nutritional requirements in dogs. A majority of multivitamins for dogs come in the form of tablets. Mostly these tablets are chewable format tablets with a meat flavor to encourage dogs to eat them.
Vendors have also introduced powdered and liquid dog multivitamins into the market, which are designed to be mixed with food. Multivitamins are also formulated in a manner that is tailored towards dogs with particular needs, such as senior dogs or still recovering dogs.
However, there are also products designed or blended in a fashion supporting the dog at all stages of life. Major multivitamins for dogs are Wowdog, Rumatec Vetcare, Intas, Wuff-wuff, Virbac, Drools, Boltz, and Medilogy Biotech.
Comparative View of Pet Dietary Supplements Market
Pet Dietary Supplements Market:
Attributes |
Pet Dietary Supplements Market |
CAGR (2023-2033) |
7.3% |
Market Value (2033) |
US$ 8.7 billion |
Growth Factor |
Increased pet humanization and advanced supplements manufacturing fuels the demand. |
Opportunity |
Organic pet dietary supplements along with an increased number of pet supplement startups. |
Key Trends |
Expanding pet care industry is likely to trend in the future |
Pet Food Market
Attributes |
Pet Food Market |
CAGR (2023-2033) |
7.9% |
Market Value (2033) |
US$ 480 million |
Growth Factor |
The higher pet adoption and increase in number of orphaned pets. |
Opportunity |
Rising organizations that adopts baby pets are likely to create opportunities for the market. |
Key Trends |
Flavored identical dietary supplements with varied nutrients proportions are trending in the market. |
Pet Supplement Market:
Attributes |
Pet Supplement Market |
CAGR (2023-2033) |
5.7% |
Market Value (2033) |
US$ 3.70 billion |
Growth Factor |
The rising number of unhealthy pets with deficiencies are likely to surge the demand for pet supplements. |
Opportunity |
New companies delivering vegan and full meat supplements are likely to create opportunities |
Key Trends |
Medically-certified supplements are trending in the market. |

A unified Market Research Subscription Platform, built for today's disparate research needs.
Pet Dietary Supplements Market Country-wise Insights
Region |
Absolute Market Growth |
US |
1.2 Bn |
UK |
35.5 Mn |
China |
400.7 Mn |
Japan |
86.0 Mn |
South Korea |
522.8 Mn |
What makes US the Biggest Region in the Global Pet Dietary Supplements Market?
“Colossal creates the Opportunities for the Pet Dietary Supplements.”
Region |
Attributes |
US Market CAGR (2023-2033) |
5.1% |
US Market Absolute Doller Growth (US$ Mn/Bn) |
US$ 1.2 Billion |
As per the FMI analysis, North America is one of the leading markets for pet dietary supplements and is anticipated to remain dominant throughout the course of the forecast period. Consumers across the world are willing to pay more for premium products, thus augmenting the pet dietary supplements market in the U.S.
The U.S. market is likely to reach a valuation of US$ 3.1 Bn by 2033. Millennials are leading this trend toward healthy living, driven both by the sheer number of consumers in this age group as well as their buying behavior. In the United States, millennials became the largest demographic group in 2015, overtaking the baby boomer generation, which had been the largest for roughly 60 years.
For millennials, discovering new products and building authentic relationships with these brands is essential. They prefer products that reflect their aspirations for a healthy lifestyle and their ethical and environmental standards.
According to the National Pet Owners Survey undertaken in 2019, nearly 67% of U.S. households have a pet, which adds up to nearly 85 million families and a big scope for the expansion of the pet dietary supplements market.
What makes South Korea the Fastest Growing Space in Global Pet Dietary Supplements Market?
“The Urban Setting and Higher Adoption of Pets during Pandemic leads to the sales of Pet Dietary Supplements.”
Region |
Attributes |
South Korean Market CAGR (2023-2033) |
13.6% |
South Korean Market Absolute Doller Growth (US$ Mn/Bn) |
522.8 Million |
Increased standard of living and higher per capita income of Korean citizens have pushed them to a more sophisticated urban residential setting. Thus, the growing pet humanization and adoption of pets have increased. Furthermore, the government supports pet pharma agencies while being the home to a major pet dietary supplements market.
What Makes Japan the Significant Market for the Pet Dietary Supplements?
“Higher population and the Advent of Organic Supplements in the Region is likely to Propel the Growth.”
Region |
Attributes |
Japanese Market CAGR (2023-2033) |
8.0% |
Japanese Market Absolute Doller Growth (US$ Mn/Bn) |
US$ 86.0 Million |
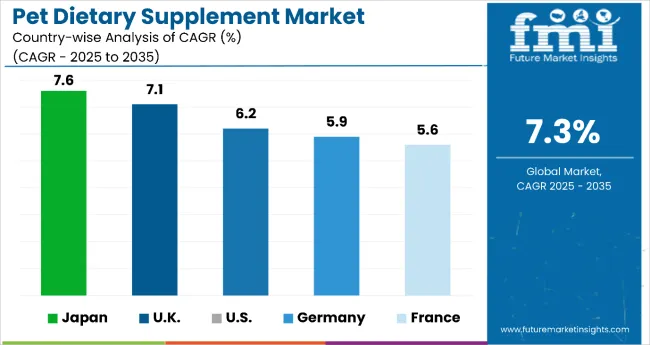
Pet healthcare industry is well developed in Japan. The retail space is filled with delicacies, special vitamins, and a number of shops offer spa and ayurveda sessions for dogs and cats. Specialized treatments are offered to target the digestive and immune health of the pets. The Lactis Zoo pet supplement is targeted towards cats, dogs and other small mammals such as rabbit, hamster etc. The Japanese market is likely to reach to a value of US$ 159.9 Mn by 2033.
The supplements are universal for all mammals, and help to maintain the health and vitality of pets. Specialized vitamins for dogs and cats constitute natural and effective components. An example being, overall growth supplement for puppies comprises the highest quality natural fish oil. Vitamins for joint health and activity of cats and dogs include natural marine collagen and chondroitin derived from shells of deep-sea crabs that are 100% ecologically safe.
Why is Germany Considered a Lucrative Pet Dietary Supplements Market?
Consumers have expressed their desire to use more sustainable products to avoid the impact of these products on the environment. This has encouraged pet supplement manufacturers to offer more sustainable products. Pet dietary supplement companies in the market are increasingly opting for sustainable practices to ensure less impact of their products on the environment.
For instance, German-based Grau has been leading in the production and distribution of dog food and supplements through its brand Hokamix. In order to stay ahead in the market space, the company continues to focus on quality and claims to be using only the best ingredients for its products
What is Driving Pet Dietary Supplements Sales in France?
Pet ownership is highly prevalent in France, making it one of the ideal markets for sales of pet dietary supplements. In fact, the country has various stringent guidelines to ensure the wellbeing of pets. For instance, deworming guidelines created by the European Scientific Counsel Companion Animal Parasites (ESCCAP) have recommended the frequency of deworming to avoid the risk of infection in pets.
Besides deworming compliances, pet care, in general, is considered of high importance in France. Pet care in the country is gaining strength, driven by the ever-growing pet humanization trend. The humanization of pets also influences the nature of pet food, which primarily features an increasing number of dietary supplement brands.
Category-wise Insights
Segment | Top Product Type |
Top Sub-segment | Glucosamine |
CAGR (2017-2022) | 3.7% |
CAGR (2023-2033) | 5.2% |
Segment | Top Application |
Top Sub-segment | Joint Health |
CAGR (2017-2022) | 4.3% |
CAGR (2023-2033) | 5.9% |
“Glucosamine is the major Supplement that supports the Pet’s Health.”
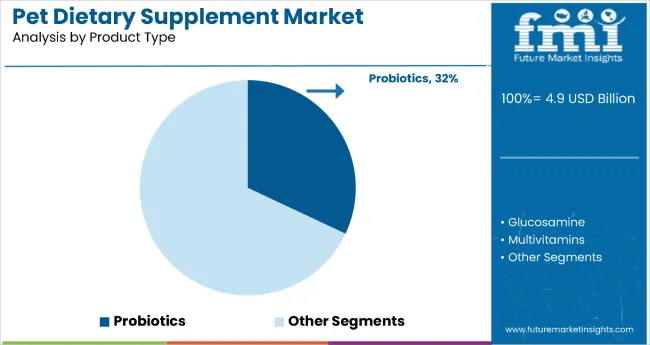
Based on product type, Glucosamine accounts for the major share of the pet dietary supplements market. It happens to be the most commonly used supplement for hip and joint support in dogs. Zesty Paws, Tomlyn Joint & Hip Chews, Cosequin Mini Soft Chews, Infinite Pet Supplements, Liquid Health Pets Glucosamine Dog Supplements, Healthscape Pets Muscle Mobility, Blue Buffalo Life Protection Formula, and ProSense Glucosamine Chew tablets are the most trending glucosamine supplements for dogs.
Glucosamine is one of several natural substances, or nutraceuticals, that are known as chondroprotective agents, used in the treatment of arthritis in humans, dogs, horses, and other animals.
“Poor Bone Heath and Increased Ortho Issues are likely to thrive the segment.”
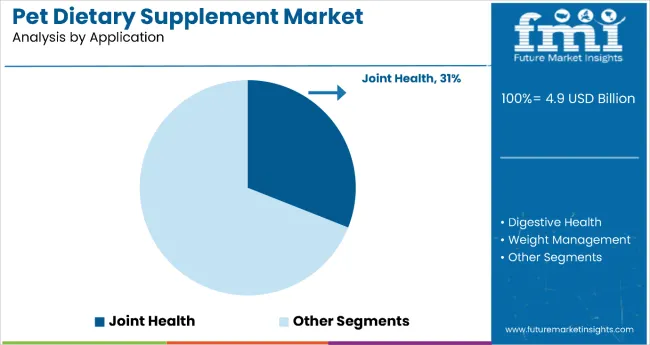
Based on application, the Joint health segment tops with an anticipated CAGR of 5.9% between 2023 and 2033. The joint health application of pet dietary supplements gains traction as older pets tend to go slow with weakened bones and other properties. Pet parents are sensitive about their pet’s health, and hence the rising diseases around pets’ orthopedic health are fueling the demand for this segment.
How Big is the Penetration of Pet Dietary Supplement Capsules?
Capsules are gaining traction owing to their greater benefits in comparison to other forms of pet dietary supplements, especially tablets. Soft-gel capsules differ from hard-shelled capsules in appearance. Soft-gel capsules are typically wider and are usually semi-transparent as opposed to opaque.
These soft-gel capsules are also known as liquid gels since they contain medication suspended in gelatin or a similar substance. Easy digestion is guaranteed by this format of medication, at which point active ingredients are released and absorbed. According to the analysis of FMI, the capsules category is expected to reach an approximate 25.2% market share by 2030.
How is Online Retailing Benefitting the Market?
No sooner did the COVID-19 pandemic hit, and a majority of the store retailers shifted to internet retailing. The trend of Omni-channel retailing had begun even before the COVID-19 pandemic became known to the world. However, the lockdown period was a nail in the coffin. A more important fact is that a considerable section of new e-Commerce users intends to continue with online retailing. Primarily, stores that develop effective Omni-channel capabilities so as to maintain a position among the physical grocers and also in a digital sphere are driving the market’s momentum.
Competitors Focus on Shifting Towards More Organic Substances
Market players are adopting various strategies to survive in the highly competitive environment. With an aim to create a brand name, these companies focus on innovation and product launches. Besides this, there is ample focus on strategic collaborations.
Latest Developments:
- Purina announced the development of a groundbreaking cat diet in February 2020, which includes egg-based ingredients containing antibodies of Fel d1, which is a major cat allergen that can also cause an adverse reaction in some humans.
- Bond Pet Foods Inc. launched a protein-packed treat bar in 2020, which is formulated with novel yeast protein and has more than 29% protein per bar.
- Scout & Zoe’s, which is a leading pet food and treat brand in the U.S., launched its product line called Super Fly for dogs in 2020. It is the first insect-based product introduced by the company that includes dry powdered larvae, whole larvae treat, and larvae meal topper
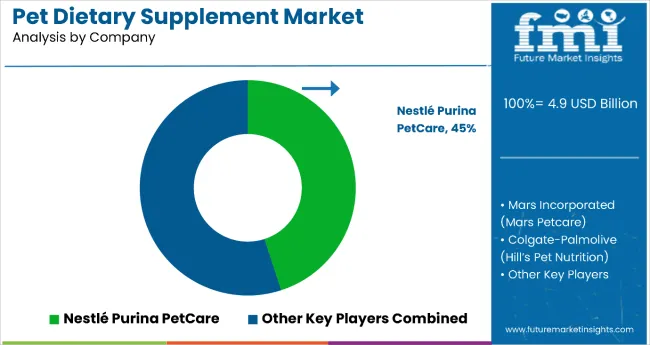
Major Contributors of the Pet Dietary Supplements Market are
- Nestle SA
- Mars Incorporated
- NOW Foods
- Blue Buffalo Co. Ltd.
- Ark Naturals
- Virbac
- Novotech Nutraceuticals, Inc.
- Zoetis
- PetAg, Inc.
- VetClassics
- GNC
Key Segments
Product Type:
- Glucosamine
- Probiotics
- Multivitamins
- Omega-3 fatty acids
- Others
Application:
- Joint Health
- Digestive Health
- Weight Management
- Skin and Coat Health
- Dental Care
- Others
By Region:
- North America
- Latin America
- Europe
- Asia Pacific (APAC)
- Middle East & Africa (MEA)
Frequently Asked Questions
The pet dietary supplements market is estimated to be worth US$ 4.3 billion in 2023.
The pet dietary supplements market is expected to have a CAGR of 7.3% by 2033.
The pet dietary supplements market expanded at an elevated 5.6% CAGR in the last five years, from 2017 to 2022.
Japan accounted for 4.4% CAGR in the global pet dietary supplements market by 2033.
Table of Content
1. Executive Summary
1.1. Global Market Outlook
1.2. Demand-side Trends
1.3. Supply-side Trends
1.4. Technology Roadmap Analysis
1.5. Analysis and Recommendations
2. Market Overview
2.1. Market Coverage / Taxonomy
2.2. Market Definition / Scope / Limitations
3. Market Background
3.1. Market Dynamics
3.1.1. Drivers
3.1.2. Restraints
3.1.3. Opportunity
3.1.4. Trends
3.2. Scenario Forecast
3.2.1. Demand in Optimistic Scenario
3.2.2. Demand in Likely Scenario
3.2.3. Demand in Conservative Scenario
3.3. Opportunity Map Analysis
3.4. Product Life Cycle Analysis
3.5. Supply Chain Analysis
3.5.1. Supply Side Participants and their Roles
3.5.1.1. Producers
3.5.1.2. Mid-Level Participants (Traders/ Agents/ Brokers)
3.5.1.3. Wholesalers and Distributors
3.5.2. Value Added and Value Created at Node in the Supply Chain
3.5.3. List of Raw Material Suppliers
3.5.4. List of Existing and Potential Buyer’s
3.6. Investment Feasibility Matrix
3.7. Value Chain Analysis
3.7.1. Profit Margin Analysis
3.7.2. Wholesalers and Distributors
3.7.3. Retailers
3.8. PESTLE and Porter’s Analysis
3.9. Regulatory Landscape
3.9.1. By Key Regions
3.9.2. By Key Countries
3.10. Regional Parent Market Outlook
3.11. Production and Consumption Statistics
3.12. Import and Export Statistics
4. Global Market Analysis 2017-2022 and Forecast, 2023-2033
4.1. Historical Market Size Value (US$ Mn) & Volume (Tons) Analysis, 2017-2022
4.2. Current and Future Market Size Value (US$ Mn) & Volume (Tons) Projections, 2023-2033
4.2.1. Y-o-Y Growth Trend Analysis
4.2.2. Absolute $ Opportunity Analysis
5. Global Market Analysis 2017-2022 and Forecast 2023-2033, By Product Type
5.1. Introduction / Key Findings
5.2. Historical Market Size Value (US$ Mn) & Volume (Tons) Analysis By Product Type, 2017-2022
5.3. Current and Future Market Size Value (US$ Mn) & Volume (Tons) Analysis and Forecast By Product Type, 2023-2033
5.3.1. Glucosamine
5.3.2. Probiotics
5.3.3. Multivitamins
5.3.4. Omega 3- fatty acids
5.3.5. Others
5.4. Y-o-Y Growth Trend Analysis By Product Type, 2017-2022
5.5. Absolute $ Opportunity Analysis By Product Type, 2023-2033
6. Global Market Analysis 2017-2022 and Forecast 2023-2033, By Application
6.1. Introduction / Key Findings
6.2. Historical Market Size Value (US$ Mn) & Volume (Tons) Analysis By Application, 2017-2022
6.3. Current and Future Market Size Value (US$ Mn) & Volume (Tons) Analysis and Forecast By Application, 2023-2033
6.3.1. Joint Health
6.3.2. Digestive Health
6.3.3. Weight Management
6.3.4. Skin and Coat Health
6.3.5. Dental Care
6.3.6. Others
6.4. Y-o-Y Growth Trend Analysis By Application, 2017-2022
6.5. Absolute $ Opportunity Analysis By Application, 2023-2033
7. Global Market Analysis 2017-2022 and Forecast 2023-2033, By Form
7.1. Introduction / Key Findings
7.2. Historical Market Size Value (US$ Mn) & Volume (Tons) Analysis By Form, 2017-2022
7.3. Current and Future Market Size Value (US$ Mn) & Volume (Tons) Analysis and Forecast By Form, 2023-2033
7.3.1. Capsules
7.3.2. Tablets
7.3.3. Powder
7.3.4. Others
7.4. Y-o-Y Growth Trend Analysis By Form, 2017-2022
7.5. Absolute $ Opportunity Analysis By Form, 2023-2033
8. Global Market Analysis 2017-2022 and Forecast 2023-2033, By Pet Type
8.1. Introduction / Key Findings
8.2. Historical Market Size Value (US$ Mn) & Volume (Tons) Analysis By Pet Type, 2017-2022
8.3. Current and Future Market Size Value (US$ Mn) & Volume (Tons) Analysis and Forecast By Pet Type, 2023-2033
8.3.1. Dog
8.3.2. Cat
8.3.3. Horse
8.3.4. Others
8.4. Y-o-Y Growth Trend Analysis By Pet Type, 2017-2022
8.5. Absolute $ Opportunity Analysis By Pet Type, 2023-2033
9. Global Market Analysis 2017-2022 and Forecast 2023-2033, By Sales Channel
9.1. Introduction / Key Findings
9.2. Historical Market Size Value (US$ Mn) & Volume (Tons) Analysis By Sales Channel, 2017-2022
9.3. Current and Future Market Size Value (US$ Mn) & Volume (Tons) Analysis and Forecast By Sales Channel, 2023-2033
9.3.1. Wholesalers & Distributors
9.3.2. Modern Trade
9.3.3. Convenience Stores
9.3.4. Multi-brand Stores
9.3.5. Pet Specialty Stores
9.3.6. Online Retailing
9.4. Y-o-Y Growth Trend Analysis By Sales Channel, 2017-2022
9.5. Absolute $ Opportunity Analysis By Sales Channel, 2023-2033
10. Global Market Analysis 2017-2022 and Forecast 2023-2033, By Region
10.1. Introduction
10.2. Historical Market Size Value (US$ Mn) & Volume (Tons) Analysis By Region, 2017-2022
10.3. Current Market Size Value (US$ Mn) & Volume (Tons) Analysis and Forecast By Region, 2023-2033
10.3.1. North America
10.3.2. Latin America
10.3.3. Europe
10.3.4. East Asia
10.3.5. South Asia
10.3.6. Oceania
10.3.7. MEA
10.4. Market Attractiveness Analysis By Region
11. North America Market Analysis 2017-2022 and Forecast 2023-2033, By Country
11.1. Historical Market Size Value (US$ Mn) & Volume (Tons) Trend Analysis By Market Taxonomy, 2017-2022
11.2. Market Size Value (US$ Mn) & Volume (Tons) Forecast By Market Taxonomy, 2023-2033
11.2.1. By Country
11.2.1.1. U.S.
11.2.1.2. Canada
11.2.2. By Product Type
11.2.3. By Application
11.2.4. By Form
11.2.5. By Pet Type
11.2.6. By Sales Channel
11.3. Market Attractiveness Analysis
11.3.1. By Country
11.3.2. By Product Type
11.3.3. By Application
11.3.4. By Form
11.3.5. By Pet Type
11.3.6. By Sales Channel
11.4. Key Takeaways
12. Latin America Market Analysis 2017-2022 and Forecast 2023-2033, By Country
12.1. Historical Market Size Value (US$ Mn) & Volume (Tons) Trend Analysis By Market Taxonomy, 2017-2022
12.2. Market Size Value (US$ Mn) & Volume (Tons) Forecast By Market Taxonomy, 2023-2033
12.2.1. By Country
12.2.1.1. Brazil
12.2.1.2. Mexico
12.2.1.3. Rest of Latin America
12.2.2. By Product Type
12.2.3. By Application
12.2.4. By Form
12.2.5. By Pet Type
12.2.6. By Sales Channel
12.3. Market Attractiveness Analysis
12.3.1. By Country
12.3.2. By Product Type
12.3.3. By Application
12.3.4. By Form
12.3.5. By Pet Type
12.3.6. By Sales Channel
12.4. Key Takeaways
13. Europe Market Analysis 2017-2022 and Forecast 2023-2033, By Country
13.1. Historical Market Size Value (US$ Mn) & Volume (Tons) Trend Analysis By Market Taxonomy, 2017-2022
13.2. Market Size Value (US$ Mn) & Volume (Tons) Forecast By Market Taxonomy, 2023-2033
13.2.1. By Country
13.2.1.1. Germany
13.2.1.2. France
13.2.1.3. U.K.
13.2.1.4. Spain
13.2.1.5. Italy
13.2.1.6. Rest of Europe
13.2.2. By Product Type
13.2.3. By Application
13.2.4. By Form
13.2.5. By Pet Type
13.2.6. By Sales Channel
13.3. Market Attractiveness Analysis
13.3.1. By Country
13.3.2. By Product Type
13.3.3. By Application
13.3.4. By Form
13.3.5. By Pet Type
13.3.6. By Sales Channel
13.4. Key Takeaways
14. East Asia Market Analysis 2017-2022 and Forecast 2023-2033, By Country
14.1. Historical Market Size Value (US$ Mn) & Volume (Tons) Trend Analysis By Market Taxonomy, 2017-2022
14.2. Market Size Value (US$ Mn) & Volume (Tons) Forecast By Market Taxonomy, 2023-2033
14.2.1. By Country
14.2.1.1. China
14.2.1.2. Japan
14.2.1.3. South Korea
14.2.2. By Product Type
14.2.3. By Application
14.2.4. By Form
14.2.5. By Pet Type
14.2.6. By Sales Channel
14.3. Market Attractiveness Analysis
14.3.1. By Country
14.3.2. By Product Type
14.3.3. By Application
14.3.4. By Form
14.3.5. By Pet Type
14.3.6. By Sales Channel
14.4. Key Takeaways
15. South Asia Market Analysis 2017-2022 and Forecast 2023-2033, By Country
15.1. Historical Market Size Value (US$ Mn) & Volume (Tons) Trend Analysis By Market Taxonomy, 2017-2022
15.2. Market Size Value (US$ Mn) & Volume (Tons) Forecast By Market Taxonomy, 2023-2033
15.2.1. By Country
15.2.1.1. India
15.2.1.2. Thailand
15.2.1.3. Indonesia
15.2.1.4. Malaysia
15.2.1.5. Rest of South Asia
15.2.2. By Product Type
15.2.3. By Application
15.2.4. By Form
15.2.5. By Pet Type
15.2.6. By Sales Channel
15.3. Market Attractiveness Analysis
15.3.1. By Country
15.3.2. By Product Type
15.3.3. By Application
15.3.4. By Form
15.3.5. By Pet Type
15.3.6. By Sales Channel
15.4. Key Takeaways
16. Oceania Market Analysis 2017-2022 and Forecast 2023-2033, By Country
16.1. Historical Market Size Value (US$ Mn) & Volume (Tons) Trend Analysis By Market Taxonomy, 2017-2022
16.2. Market Size Value (US$ Mn) & Volume (Tons) Forecast By Market Taxonomy, 2023-2033
16.2.1. By Country
16.2.1.1. Australia
16.2.1.2. New Zealand
16.2.2. By Product Type
16.2.3. By Application
16.2.4. By Form
16.2.5. By Pet Type
16.2.6. By Sales Channel
16.3. Market Attractiveness Analysis
16.3.1. By Country
16.3.2. By Product Type
16.3.3. By Application
16.3.4. By Form
16.3.5. By Pet Type
16.3.6. By Sales Channel
16.4. Key Takeaways
17. MEA Market Analysis 2017-2022 and Forecast 2023-2033, By Country
17.1. Historical Market Size Value (US$ Mn) & Volume (Tons) Trend Analysis By Market Taxonomy, 2017-2022
17.2. Market Size Value (US$ Mn) & Volume (Tons) Forecast By Market Taxonomy, 2023-2033
17.2.1. By Country
17.2.1.1. GCC Countries
17.2.1.2. Northern Africa
17.2.1.3. South Africa
17.2.1.4. Rest of MEA
17.2.2. By Product Type
17.2.3. By Application
17.2.4. By Form
17.2.5. By Pet Type
17.2.6. By Sales Channel
17.3. Market Attractiveness Analysis
17.3.1. By Country
17.3.2. By Product Type
17.3.3. By Application
17.3.4. By Form
17.3.5. By Pet Type
17.3.6. By Sales Channel
17.4. Key Takeaways
18. Key Countries Market Analysis
18.1. U.S.
18.1.1. Pricing Analysis
18.1.2. Market Share Analysis, 2022
18.1.2.1. By Product Type
18.1.2.2. By Application
18.1.2.3. By Form
18.1.2.4. By Pet Type
18.1.2.5. By Sales Channel
18.2. Canada
18.2.1. Pricing Analysis
18.2.2. Market Share Analysis, 2022
18.2.2.1. By Product Type
18.2.2.2. By Application
18.2.2.3. By Form
18.2.2.4. By Pet Type
18.2.2.5. By Sales Channel
18.3. Brazil
18.3.1. Pricing Analysis
18.3.2. Market Share Analysis, 2022
18.3.2.1. By Product Type
18.3.2.2. By Application
18.3.2.3. By Form
18.3.2.4. By Pet Type
18.3.2.5. By Sales Channel
18.4. Mexico
18.4.1. Pricing Analysis
18.4.2. Market Share Analysis, 2022
18.4.2.1. By Product Type
18.4.2.2. By Application
18.4.2.3. By Form
18.4.2.4. By Pet Type
18.4.2.5. By Sales Channel
18.5. Germany
18.5.1. Pricing Analysis
18.5.2. Market Share Analysis, 2022
18.5.2.1. By Product Type
18.5.2.2. By Application
18.5.2.3. By Form
18.5.2.4. By Pet Type
18.5.2.5. By Sales Channel
18.6. Italy
18.6.1. Pricing Analysis
18.6.2. Market Share Analysis, 2022
18.6.2.1. By Product Type
18.6.2.2. By Application
18.6.2.3. By Form
18.6.2.4. By Pet Type
18.6.2.5. By Sales Channel
18.7. France
18.7.1. Pricing Analysis
18.7.2. Market Share Analysis, 2022
18.7.2.1. By Product Type
18.7.2.2. By Application
18.7.2.3. By Form
18.7.2.4. By Pet Type
18.7.2.5. By Sales Channel
18.8. U.K.
18.8.1. Pricing Analysis
18.8.2. Market Share Analysis, 2022
18.8.2.1. By Product Type
18.8.2.2. By Application
18.8.2.3. By Form
18.8.2.4. By Pet Type
18.8.2.5. By Sales Channel
18.9. Spain
18.9.1. Pricing Analysis
18.9.2. Market Share Analysis, 2022
18.9.2.1. By Product Type
18.9.2.2. By Application
18.9.2.3. By Form
18.9.2.4. By Pet Type
18.9.2.5. By Sales Channel
18.10. China
18.10.1. Pricing Analysis
18.10.2. Market Share Analysis, 2022
18.10.2.1. By Product Type
18.10.2.2. By Application
18.10.2.3. By Form
18.10.2.4. By Pet Type
18.10.2.5. By Sales Channel
18.11. Japan
18.11.1. Pricing Analysis
18.11.2. Market Share Analysis, 2022
18.11.2.1. By Product Type
18.11.2.2. By Application
18.11.2.3. By Form
18.11.2.4. By Pet Type
18.11.2.5. By Sales Channel
18.12. South Korea
18.12.1. Pricing Analysis
18.12.2. Market Share Analysis, 2022
18.12.2.1. By Product Type
18.12.2.2. By Application
18.12.2.3. By Form
18.12.2.4. By Pet Type
18.12.2.5. By Sales Channel
18.13. India
18.13.1. Pricing Analysis
18.13.2. Market Share Analysis, 2022
18.13.2.1. By Product Type
18.13.2.2. By Application
18.13.2.3. By Form
18.13.2.4. By Pet Type
18.13.2.5. By Sales Channel
18.14. Thailand
18.14.1. Pricing Analysis
18.14.2. Market Share Analysis, 2022
18.14.2.1. By Product Type
18.14.2.2. By Application
18.14.2.3. By Form
18.14.2.4. By Pet Type
18.14.2.5. By Sales Channel
18.15. Indonesia
18.15.1. Pricing Analysis
18.15.2. Market Share Analysis, 2022
18.15.2.1. By Product Type
18.15.2.2. By Application
18.15.2.3. By Form
18.15.2.4. By Pet Type
18.15.2.5. By Sales Channel
18.16. Malaysia
18.16.1. Pricing Analysis
18.16.2. Market Share Analysis, 2022
18.16.2.1. By Product Type
18.16.2.2. By Application
18.16.2.3. By Form
18.16.2.4. By Pet Type
18.16.2.5. By Sales Channel
18.17. Australia
18.17.1. Pricing Analysis
18.17.2. Market Share Analysis, 2022
18.17.2.1. By Product Type
18.17.2.2. By Application
18.17.2.3. By Form
18.17.2.4. By Pet Type
18.17.2.5. By Sales Channel
18.18. New Zealand
18.18.1. Pricing Analysis
18.18.2. Market Share Analysis, 2022
18.18.2.1. By Product Type
18.18.2.2. By Application
18.18.2.3. By Form
18.18.2.4. By Pet Type
18.18.2.5. By Sales Channel
18.19. GCC Countries
18.19.1. Pricing Analysis
18.19.2. Market Share Analysis, 2022
18.19.2.1. By Product Type
18.19.2.2. By Application
18.19.2.3. By Form
18.19.2.4. By Pet Type
18.19.2.5. By Sales Channel
18.20. Northern Africa
18.20.1. Pricing Analysis
18.20.2. Market Share Analysis, 2022
18.20.2.1. By Product Type
18.20.2.2. By Application
18.20.2.3. By Form
18.20.2.4. By Pet Type
18.20.2.5. By Sales Channel
18.21. South Africa
18.21.1. Pricing Analysis
18.21.2. Market Share Analysis, 2022
18.21.2.1. By Product Type
18.21.2.2. By Application
18.21.2.3. By Form
18.21.2.4. By Pet Type
18.21.2.5. By Sales Channel
19. Market Structure Analysis
19.1. Competition Dashboard
19.2. Competition Benchmarking
19.3. Market Share Analysis of Top Players
19.3.1. By Regional
19.3.2. By Product Type
19.3.3. By Application
19.3.4. By Form
19.3.5. By Pet Type
19.3.6. By Sales Channel
20. Competition Analysis
20.1. Competition Deep Dive
20.1.1. Nestle SA
20.1.1.1. Overview
20.1.1.2. Product Portfolio
20.1.1.3. Profitability by Market Segments
20.1.1.4. Sales Footprint
20.1.1.5. Strategy Overview
20.1.1.5.1. Marketing Strategy
20.1.1.5.2. Product Strategy
20.1.1.5.3. Channel Strategy
20.1.2. Mars Incorporated
20.1.2.1. Overview
20.1.2.2. Product Portfolio
20.1.2.3. Profitability by Market Segments
20.1.2.4. Sales Footprint
20.1.2.5. Strategy Overview
20.1.2.5.1. Marketing Strategy
20.1.2.5.2. Product Strategy
20.1.2.5.3. Channel Strategy
20.1.3. NOW Foods
20.1.3.1. Overview
20.1.3.2. Product Portfolio
20.1.3.3. Profitability by Market Segments
20.1.3.4. Sales Footprint
20.1.3.5. Strategy Overview
20.1.3.5.1. Marketing Strategy
20.1.3.5.2. Product Strategy
20.1.3.5.3. Channel Strategy
20.1.4. Blue Buffalo Co. Ltd.
20.1.4.1. Overview
20.1.4.2. Product Portfolio
20.1.4.3. Profitability by Market Segments
20.1.4.4. Sales Footprint
20.1.4.5. Strategy Overview
20.1.4.5.1. Marketing Strategy
20.1.4.5.2. Product Strategy
20.1.4.5.3. Channel Strategy
20.1.5. Ark Naturals
20.1.5.1. Overview
20.1.5.2. Product Portfolio
20.1.5.3. Profitability by Market Segments
20.1.5.4. Sales Footprint
20.1.5.5. Strategy Overview
20.1.5.5.1. Marketing Strategy
20.1.5.5.2. Product Strategy
20.1.5.5.3. Channel Strategy
20.1.6. Virbac
20.1.6.1. Overview
20.1.6.2. Product Portfolio
20.1.6.3. Profitability by Market Segments
20.1.6.4. Sales Footprint
20.1.6.5. Strategy Overview
20.1.6.5.1. Marketing Strategy
20.1.6.5.2. Product Strategy
20.1.6.5.3. Channel Strategy
20.1.7. Novotech Nutraceuticals, Inc.
20.1.7.1. Overview
20.1.7.2. Product Portfolio
20.1.7.3. Profitability by Market Segments
20.1.7.4. Sales Footprint
20.1.7.5. Strategy Overview
20.1.7.5.1. Marketing Strategy
20.1.7.5.2. Product Strategy
20.1.7.5.3. Channel Strategy
20.1.8. Zoetis
20.1.8.1. Overview
20.1.8.2. Product Portfolio
20.1.8.3. Profitability by Market Segments
20.1.8.4. Sales Footprint
20.1.8.5. Strategy Overview
20.1.8.5.1. Marketing Strategy
20.1.8.5.2. Product Strategy
20.1.8.5.3. Channel Strategy
20.1.9. PetAg, Inc.
20.1.9.1. Overview
20.1.9.2. Product Portfolio
20.1.9.3. Profitability by Market Segments
20.1.9.4. Sales Footprint
20.1.9.5. Strategy Overview
20.1.9.5.1. Marketing Strategy
20.1.9.5.2. Product Strategy
20.1.9.5.3. Channel Strategy
20.1.10. VetClassics
20.1.10.1. Overview
20.1.10.2. Product Portfolio
20.1.10.3. Profitability by Market Segments
20.1.10.4. Sales Footprint
20.1.10.5. Strategy Overview
20.1.10.5.1. Marketing Strategy
20.1.10.5.2. Product Strategy
20.1.10.5.3. Channel Strategy
20.1.11. GNC
20.1.11.1. Overview
20.1.11.2. Product Portfolio
20.1.11.3. Profitability by Market Segments
20.1.11.4. Sales Footprint
20.1.11.5. Strategy Overview
20.1.11.5.1. Marketing Strategy
20.1.11.5.2. Product Strategy
20.1.11.5.3. Channel Strategy
21. Assumptions & Acronyms Used
22. Research Methodology
Let us know your requirement to get
100% FREE customization
List of Tables
Table 1: Global Market Value (US$ Mn) Forecast by Region, 2017-2033
Table 2: Global Market Volume (Tons) Forecast by Region, 2017-2033
Table 3: Global Market Value (US$ Mn) Forecast by Product Type, 2017-2033
Table 4: Global Market Volume (Tons) Forecast by Product Type, 2017-2033
Table 5: Global Market Value (US$ Mn) Forecast by Application, 2017-2033
Table 6: Global Market Volume (Tons) Forecast by Application, 2017-2033
Table 7: Global Market Value (US$ Mn) Forecast by Form, 2017-2033
Table 8: Global Market Volume (Tons) Forecast by Form, 2017-2033
Table 9: Global Market Value (US$ Mn) Forecast by Pet Type, 2017-2033
Table 10: Global Market Volume (Tons) Forecast by Pet Type, 2017-2033
Table 11: Global Market Value (US$ Mn) Forecast by Sales Channel, 2017-2033
Table 12: Global Market Volume (Tons) Forecast by Sales Channel, 2017-2033
Table 13: North America Market Value (US$ Mn) Forecast by Country, 2017-2033
Table 14: North America Market Volume (Tons) Forecast by Country, 2017-2033
Table 15: North America Market Value (US$ Mn) Forecast by Product Type, 2017-2033
Table 16: North America Market Volume (Tons) Forecast by Product Type, 2017-2033
Table 17: North America Market Value (US$ Mn) Forecast by Application, 2017-2033
Table 18: North America Market Volume (Tons) Forecast by Application, 2017-2033
Table 19: North America Market Value (US$ Mn) Forecast by Form, 2017-2033
Table 20: North America Market Volume (Tons) Forecast by Form, 2017-2033
Table 21: North America Market Value (US$ Mn) Forecast by Pet Type, 2017-2033
Table 22: North America Market Volume (Tons) Forecast by Pet Type, 2017-2033
Table 23: North America Market Value (US$ Mn) Forecast by Sales Channel, 2017-2033
Table 24: North America Market Volume (Tons) Forecast by Sales Channel, 2017-2033
Table 25: Latin America Market Value (US$ Mn) Forecast by Country, 2017-2033
Table 26: Latin America Market Volume (Tons) Forecast by Country, 2017-2033
Table 27: Latin America Market Value (US$ Mn) Forecast by Product Type, 2017-2033
Table 28: Latin America Market Volume (Tons) Forecast by Product Type, 2017-2033
Table 29: Latin America Market Value (US$ Mn) Forecast by Application, 2017-2033
Table 30: Latin America Market Volume (Tons) Forecast by Application, 2017-2033
Table 31: Latin America Market Value (US$ Mn) Forecast by Form, 2017-2033
Table 32: Latin America Market Volume (Tons) Forecast by Form, 2017-2033
Table 33: Latin America Market Value (US$ Mn) Forecast by Pet Type, 2017-2033
Table 34: Latin America Market Volume (Tons) Forecast by Pet Type, 2017-2033
Table 35: Latin America Market Value (US$ Mn) Forecast by Sales Channel, 2017-2033
Table 36: Latin America Market Volume (Tons) Forecast by Sales Channel, 2017-2033
Table 37: Europe Market Value (US$ Mn) Forecast by Country, 2017-2033
Table 38: Europe Market Volume (Tons) Forecast by Country, 2017-2033
Table 39: Europe Market Value (US$ Mn) Forecast by Product Type, 2017-2033
Table 40: Europe Market Volume (Tons) Forecast by Product Type, 2017-2033
Table 41: Europe Market Value (US$ Mn) Forecast by Application, 2017-2033
Table 42: Europe Market Volume (Tons) Forecast by Application, 2017-2033
Table 43: Europe Market Value (US$ Mn) Forecast by Form, 2017-2033
Table 44: Europe Market Volume (Tons) Forecast by Form, 2017-2033
Table 45: Europe Market Value (US$ Mn) Forecast by Pet Type, 2017-2033
Table 46: Europe Market Volume (Tons) Forecast by Pet Type, 2017-2033
Table 47: Europe Market Value (US$ Mn) Forecast by Sales Channel, 2017-2033
Table 48: Europe Market Volume (Tons) Forecast by Sales Channel, 2017-2033
Table 49: East Asia Market Value (US$ Mn) Forecast by Country, 2017-2033
Table 50: East Asia Market Volume (Tons) Forecast by Country, 2017-2033
Table 51: East Asia Market Value (US$ Mn) Forecast by Product Type, 2017-2033
Table 52: East Asia Market Volume (Tons) Forecast by Product Type, 2017-2033
Table 53: East Asia Market Value (US$ Mn) Forecast by Application, 2017-2033
Table 54: East Asia Market Volume (Tons) Forecast by Application, 2017-2033
Table 55: East Asia Market Value (US$ Mn) Forecast by Form, 2017-2033
Table 56: East Asia Market Volume (Tons) Forecast by Form, 2017-2033
Table 57: East Asia Market Value (US$ Mn) Forecast by Pet Type, 2017-2033
Table 58: East Asia Market Volume (Tons) Forecast by Pet Type, 2017-2033
Table 59: East Asia Market Value (US$ Mn) Forecast by Sales Channel, 2017-2033
Table 60: East Asia Market Volume (Tons) Forecast by Sales Channel, 2017-2033
Table 61: South Asia Market Value (US$ Mn) Forecast by Country, 2017-2033
Table 62: South Asia Market Volume (Tons) Forecast by Country, 2017-2033
Table 63: South Asia Market Value (US$ Mn) Forecast by Product Type, 2017-2033
Table 64: South Asia Market Volume (Tons) Forecast by Product Type, 2017-2033
Table 65: South Asia Market Value (US$ Mn) Forecast by Application, 2017-2033
Table 66: South Asia Market Volume (Tons) Forecast by Application, 2017-2033
Table 67: South Asia Market Value (US$ Mn) Forecast by Form, 2017-2033
Table 68: South Asia Market Volume (Tons) Forecast by Form, 2017-2033
Table 69: South Asia Market Value (US$ Mn) Forecast by Pet Type, 2017-2033
Table 70: South Asia Market Volume (Tons) Forecast by Pet Type, 2017-2033
Table 71: South Asia Market Value (US$ Mn) Forecast by Sales Channel, 2017-2033
Table 72: South Asia Market Volume (Tons) Forecast by Sales Channel, 2017-2033
Table 73: Oceania Market Value (US$ Mn) Forecast by Country, 2017-2033
Table 74: Oceania Market Volume (Tons) Forecast by Country, 2017-2033
Table 75: Oceania Market Value (US$ Mn) Forecast by Product Type, 2017-2033
Table 76: Oceania Market Volume (Tons) Forecast by Product Type, 2017-2033
Table 77: Oceania Market Value (US$ Mn) Forecast by Application, 2017-2033
Table 78: Oceania Market Volume (Tons) Forecast by Application, 2017-2033
Table 79: Oceania Market Value (US$ Mn) Forecast by Form, 2017-2033
Table 80: Oceania Market Volume (Tons) Forecast by Form, 2017-2033
Table 81: Oceania Market Value (US$ Mn) Forecast by Pet Type, 2017-2033
Table 82: Oceania Market Volume (Tons) Forecast by Pet Type, 2017-2033
Table 83: Oceania Market Value (US$ Mn) Forecast by Sales Channel, 2017-2033
Table 84: Oceania Market Volume (Tons) Forecast by Sales Channel, 2017-2033
Table 85: MEA Market Value (US$ Mn) Forecast by Country, 2017-2033
Table 86: MEA Market Volume (Tons) Forecast by Country, 2017-2033
Table 87: MEA Market Value (US$ Mn) Forecast by Product Type, 2017-2033
Table 88: MEA Market Volume (Tons) Forecast by Product Type, 2017-2033
Table 89: MEA Market Value (US$ Mn) Forecast by Application, 2017-2033
Table 90: MEA Market Volume (Tons) Forecast by Application, 2017-2033
Table 91: MEA Market Value (US$ Mn) Forecast by Form, 2017-2033
Table 92: MEA Market Volume (Tons) Forecast by Form, 2017-2033
Table 93: MEA Market Value (US$ Mn) Forecast by Pet Type, 2017-2033
Table 94: MEA Market Volume (Tons) Forecast by Pet Type, 2017-2033
Table 95: MEA Market Value (US$ Mn) Forecast by Sales Channel, 2017-2033
Table 96: MEA Market Volume (Tons) Forecast by Sales Channel, 2017-2033
Find your sweet spots for generating winning opportunities in this market.
Talk to AnalystList of Charts
Figure 1: Global Market Value (US$ Mn) by Product Type, 2023-2033
Figure 2: Global Market Value (US$ Mn) by Application, 2023-2033
Figure 3: Global Market Value (US$ Mn) by Form, 2023-2033
Figure 4: Global Market Value (US$ Mn) by Pet Type, 2023-2033
Figure 5: Global Market Value (US$ Mn) by Sales Channel, 2023-2033
Figure 6: Global Market Value (US$ Mn) by Region, 2023-2033
Figure 7: Global Market Value (US$ Mn) Analysis by Region, 2017-2033
Figure 8: Global Market Volume (Tons) Analysis by Region, 2017-2033
Figure 9: Global Market Value Share (%) and BPS Analysis by Region, 2023-2033
Figure 10: Global Market Y-o-Y Growth (%) Projections by Region, 2023-2033
Figure 11: Global Market Value (US$ Mn) Analysis by Product Type, 2017-2033
Figure 12: Global Market Volume (Tons) Analysis by Product Type, 2017-2033
Figure 13: Global Market Value Share (%) and BPS Analysis by Product Type, 2023-2033
Figure 14: Global Market Y-o-Y Growth (%) Projections by Product Type, 2023-2033
Figure 15: Global Market Value (US$ Mn) Analysis by Application, 2017-2033
Figure 16: Global Market Volume (Tons) Analysis by Application, 2017-2033
Figure 17: Global Market Value Share (%) and BPS Analysis by Application, 2023-2033
Figure 18: Global Market Y-o-Y Growth (%) Projections by Application, 2023-2033
Figure 19: Global Market Value (US$ Mn) Analysis by Form, 2017-2033
Figure 20: Global Market Volume (Tons) Analysis by Form, 2017-2033
Figure 21: Global Market Value Share (%) and BPS Analysis by Form, 2023-2033
Figure 22: Global Market Y-o-Y Growth (%) Projections by Form, 2023-2033
Figure 23: Global Market Value (US$ Mn) Analysis by Pet Type, 2017-2033
Figure 24: Global Market Volume (Tons) Analysis by Pet Type, 2017-2033
Figure 25: Global Market Value Share (%) and BPS Analysis by Pet Type, 2023-2033
Figure 26: Global Market Y-o-Y Growth (%) Projections by Pet Type, 2023-2033
Figure 27: Global Market Value (US$ Mn) Analysis by Sales Channel, 2017-2033
Figure 28: Global Market Volume (Tons) Analysis by Sales Channel, 2017-2033
Figure 29: Global Market Value Share (%) and BPS Analysis by Sales Channel, 2023-2033
Figure 30: Global Market Y-o-Y Growth (%) Projections by Sales Channel, 2023-2033
Figure 31: Global Market Attractiveness by Product Type, 2023-2033
Figure 32: Global Market Attractiveness by Application, 2023-2033
Figure 33: Global Market Attractiveness by Form, 2023-2033
Figure 34: Global Market Attractiveness by Pet Type, 2023-2033
Figure 35: Global Market Attractiveness by Sales Channel, 2023-2033
Figure 36: Global Market Attractiveness by Region, 2023-2033
Figure 37: North America Market Value (US$ Mn) by Product Type, 2023-2033
Figure 38: North America Market Value (US$ Mn) by Application, 2023-2033
Figure 39: North America Market Value (US$ Mn) by Form, 2023-2033
Figure 40: North America Market Value (US$ Mn) by Pet Type, 2023-2033
Figure 41: North America Market Value (US$ Mn) by Sales Channel, 2023-2033
Figure 42: North America Market Value (US$ Mn) by Country, 2023-2033
Figure 43: North America Market Value (US$ Mn) Analysis by Country, 2017-2033
Figure 44: North America Market Volume (Tons) Analysis by Country, 2017-2033
Figure 45: North America Market Value Share (%) and BPS Analysis by Country, 2023-2033
Figure 46: North America Market Y-o-Y Growth (%) Projections by Country, 2023-2033
Figure 47: North America Market Value (US$ Mn) Analysis by Product Type, 2017-2033
Figure 48: North America Market Volume (Tons) Analysis by Product Type, 2017-2033
Figure 49: North America Market Value Share (%) and BPS Analysis by Product Type, 2023-2033
Figure 50: North America Market Y-o-Y Growth (%) Projections by Product Type, 2023-2033
Figure 51: North America Market Value (US$ Mn) Analysis by Application, 2017-2033
Figure 52: North America Market Volume (Tons) Analysis by Application, 2017-2033
Figure 53: North America Market Value Share (%) and BPS Analysis by Application, 2023-2033
Figure 54: North America Market Y-o-Y Growth (%) Projections by Application, 2023-2033
Figure 55: North America Market Value (US$ Mn) Analysis by Form, 2017-2033
Figure 56: North America Market Volume (Tons) Analysis by Form, 2017-2033
Figure 57: North America Market Value Share (%) and BPS Analysis by Form, 2023-2033
Figure 58: North America Market Y-o-Y Growth (%) Projections by Form, 2023-2033
Figure 59: North America Market Value (US$ Mn) Analysis by Pet Type, 2017-2033
Figure 60: North America Market Volume (Tons) Analysis by Pet Type, 2017-2033
Figure 61: North America Market Value Share (%) and BPS Analysis by Pet Type, 2023-2033
Figure 62: North America Market Y-o-Y Growth (%) Projections by Pet Type, 2023-2033
Figure 63: North America Market Value (US$ Mn) Analysis by Sales Channel, 2017-2033
Figure 64: North America Market Volume (Tons) Analysis by Sales Channel, 2017-2033
Figure 65: North America Market Value Share (%) and BPS Analysis by Sales Channel, 2023-2033
Figure 66: North America Market Y-o-Y Growth (%) Projections by Sales Channel, 2023-2033
Figure 67: North America Market Attractiveness by Product Type, 2023-2033
Figure 68: North America Market Attractiveness by Application, 2023-2033
Figure 69: North America Market Attractiveness by Form, 2023-2033
Figure 70: North America Market Attractiveness by Pet Type, 2023-2033
Figure 71: North America Market Attractiveness by Sales Channel, 2023-2033
Figure 72: North America Market Attractiveness by Country, 2023-2033
Figure 73: Latin America Market Value (US$ Mn) by Product Type, 2023-2033
Figure 74: Latin America Market Value (US$ Mn) by Application, 2023-2033
Figure 75: Latin America Market Value (US$ Mn) by Form, 2023-2033
Figure 76: Latin America Market Value (US$ Mn) by Pet Type, 2023-2033
Figure 77: Latin America Market Value (US$ Mn) by Sales Channel, 2023-2033
Figure 78: Latin America Market Value (US$ Mn) by Country, 2023-2033
Figure 79: Latin America Market Value (US$ Mn) Analysis by Country, 2017-2033
Figure 80: Latin America Market Volume (Tons) Analysis by Country, 2017-2033
Figure 81: Latin America Market Value Share (%) and BPS Analysis by Country, 2023-2033
Figure 82: Latin America Market Y-o-Y Growth (%) Projections by Country, 2023-2033
Figure 83: Latin America Market Value (US$ Mn) Analysis by Product Type, 2017-2033
Figure 84: Latin America Market Volume (Tons) Analysis by Product Type, 2017-2033
Figure 85: Latin America Market Value Share (%) and BPS Analysis by Product Type, 2023-2033
Figure 86: Latin America Market Y-o-Y Growth (%) Projections by Product Type, 2023-2033
Figure 87: Latin America Market Value (US$ Mn) Analysis by Application, 2017-2033
Figure 88: Latin America Market Volume (Tons) Analysis by Application, 2017-2033
Figure 89: Latin America Market Value Share (%) and BPS Analysis by Application, 2023-2033
Figure 90: Latin America Market Y-o-Y Growth (%) Projections by Application, 2023-2033
Figure 91: Latin America Market Value (US$ Mn) Analysis by Form, 2017-2033
Figure 92: Latin America Market Volume (Tons) Analysis by Form, 2017-2033
Figure 93: Latin America Market Value Share (%) and BPS Analysis by Form, 2023-2033
Figure 94: Latin America Market Y-o-Y Growth (%) Projections by Form, 2023-2033
Figure 95: Latin America Market Value (US$ Mn) Analysis by Pet Type, 2017-2033
Figure 96: Latin America Market Volume (Tons) Analysis by Pet Type, 2017-2033
Figure 97: Latin America Market Value Share (%) and BPS Analysis by Pet Type, 2023-2033
Figure 98: Latin America Market Y-o-Y Growth (%) Projections by Pet Type, 2023-2033
Figure 99: Latin America Market Value (US$ Mn) Analysis by Sales Channel, 2017-2033
Figure 100: Latin America Market Volume (Tons) Analysis by Sales Channel, 2017-2033
Figure 101: Latin America Market Value Share (%) and BPS Analysis by Sales Channel, 2023-2033
Figure 102: Latin America Market Y-o-Y Growth (%) Projections by Sales Channel, 2023-2033
Figure 103: Latin America Market Attractiveness by Product Type, 2023-2033
Figure 104: Latin America Market Attractiveness by Application, 2023-2033
Figure 105: Latin America Market Attractiveness by Form, 2023-2033
Figure 106: Latin America Market Attractiveness by Pet Type, 2023-2033
Figure 107: Latin America Market Attractiveness by Sales Channel, 2023-2033
Figure 108: Latin America Market Attractiveness by Country, 2023-2033
Figure 109: Europe Market Value (US$ Mn) by Product Type, 2023-2033
Figure 110: Europe Market Value (US$ Mn) by Application, 2023-2033
Figure 111: Europe Market Value (US$ Mn) by Form, 2023-2033
Figure 112: Europe Market Value (US$ Mn) by Pet Type, 2023-2033
Figure 113: Europe Market Value (US$ Mn) by Sales Channel, 2023-2033
Figure 114: Europe Market Value (US$ Mn) by Country, 2023-2033
Figure 115: Europe Market Value (US$ Mn) Analysis by Country, 2017-2033
Figure 116: Europe Market Volume (Tons) Analysis by Country, 2017-2033
Figure 117: Europe Market Value Share (%) and BPS Analysis by Country, 2023-2033
Figure 118: Europe Market Y-o-Y Growth (%) Projections by Country, 2023-2033
Figure 119: Europe Market Value (US$ Mn) Analysis by Product Type, 2017-2033
Figure 120: Europe Market Volume (Tons) Analysis by Product Type, 2017-2033
Figure 121: Europe Market Value Share (%) and BPS Analysis by Product Type, 2023-2033
Figure 122: Europe Market Y-o-Y Growth (%) Projections by Product Type, 2023-2033
Figure 123: Europe Market Value (US$ Mn) Analysis by Application, 2017-2033
Figure 124: Europe Market Volume (Tons) Analysis by Application, 2017-2033
Figure 125: Europe Market Value Share (%) and BPS Analysis by Application, 2023-2033
Figure 126: Europe Market Y-o-Y Growth (%) Projections by Application, 2023-2033
Figure 127: Europe Market Value (US$ Mn) Analysis by Form, 2017-2033
Figure 128: Europe Market Volume (Tons) Analysis by Form, 2017-2033
Figure 129: Europe Market Value Share (%) and BPS Analysis by Form, 2023-2033
Figure 130: Europe Market Y-o-Y Growth (%) Projections by Form, 2023-2033
Figure 131: Europe Market Value (US$ Mn) Analysis by Pet Type, 2017-2033
Figure 132: Europe Market Volume (Tons) Analysis by Pet Type, 2017-2033
Figure 133: Europe Market Value Share (%) and BPS Analysis by Pet Type, 2023-2033
Figure 134: Europe Market Y-o-Y Growth (%) Projections by Pet Type, 2023-2033
Figure 135: Europe Market Value (US$ Mn) Analysis by Sales Channel, 2017-2033
Figure 136: Europe Market Volume (Tons) Analysis by Sales Channel, 2017-2033
Figure 137: Europe Market Value Share (%) and BPS Analysis by Sales Channel, 2023-2033
Figure 138: Europe Market Y-o-Y Growth (%) Projections by Sales Channel, 2023-2033
Figure 139: Europe Market Attractiveness by Product Type, 2023-2033
Figure 140: Europe Market Attractiveness by Application, 2023-2033
Figure 141: Europe Market Attractiveness by Form, 2023-2033
Figure 142: Europe Market Attractiveness by Pet Type, 2023-2033
Figure 143: Europe Market Attractiveness by Sales Channel, 2023-2033
Figure 144: Europe Market Attractiveness by Country, 2023-2033
Figure 145: East Asia Market Value (US$ Mn) by Product Type, 2023-2033
Figure 146: East Asia Market Value (US$ Mn) by Application, 2023-2033
Figure 147: East Asia Market Value (US$ Mn) by Form, 2023-2033
Figure 148: East Asia Market Value (US$ Mn) by Pet Type, 2023-2033
Figure 149: East Asia Market Value (US$ Mn) by Sales Channel, 2023-2033
Figure 150: East Asia Market Value (US$ Mn) by Country, 2023-2033
Figure 151: East Asia Market Value (US$ Mn) Analysis by Country, 2017-2033
Figure 152: East Asia Market Volume (Tons) Analysis by Country, 2017-2033
Figure 153: East Asia Market Value Share (%) and BPS Analysis by Country, 2023-2033
Figure 154: East Asia Market Y-o-Y Growth (%) Projections by Country, 2023-2033
Figure 155: East Asia Market Value (US$ Mn) Analysis by Product Type, 2017-2033
Figure 156: East Asia Market Volume (Tons) Analysis by Product Type, 2017-2033
Figure 157: East Asia Market Value Share (%) and BPS Analysis by Product Type, 2023-2033
Figure 158: East Asia Market Y-o-Y Growth (%) Projections by Product Type, 2023-2033
Figure 159: East Asia Market Value (US$ Mn) Analysis by Application, 2017-2033
Figure 160: East Asia Market Volume (Tons) Analysis by Application, 2017-2033
Figure 161: East Asia Market Value Share (%) and BPS Analysis by Application, 2023-2033
Figure 162: East Asia Market Y-o-Y Growth (%) Projections by Application, 2023-2033
Figure 163: East Asia Market Value (US$ Mn) Analysis by Form, 2017-2033
Figure 164: East Asia Market Volume (Tons) Analysis by Form, 2017-2033
Figure 165: East Asia Market Value Share (%) and BPS Analysis by Form, 2023-2033
Figure 166: East Asia Market Y-o-Y Growth (%) Projections by Form, 2023-2033
Figure 167: East Asia Market Value (US$ Mn) Analysis by Pet Type, 2017-2033
Figure 168: East Asia Market Volume (Tons) Analysis by Pet Type, 2017-2033
Figure 169: East Asia Market Value Share (%) and BPS Analysis by Pet Type, 2023-2033
Figure 170: East Asia Market Y-o-Y Growth (%) Projections by Pet Type, 2023-2033
Figure 171: East Asia Market Value (US$ Mn) Analysis by Sales Channel, 2017-2033
Figure 172: East Asia Market Volume (Tons) Analysis by Sales Channel, 2017-2033
Figure 173: East Asia Market Value Share (%) and BPS Analysis by Sales Channel, 2023-2033
Figure 174: East Asia Market Y-o-Y Growth (%) Projections by Sales Channel, 2023-2033
Figure 175: East Asia Market Attractiveness by Product Type, 2023-2033
Figure 176: East Asia Market Attractiveness by Application, 2023-2033
Figure 177: East Asia Market Attractiveness by Form, 2023-2033
Figure 178: East Asia Market Attractiveness by Pet Type, 2023-2033
Figure 179: East Asia Market Attractiveness by Sales Channel, 2023-2033
Figure 180: East Asia Market Attractiveness by Country, 2023-2033
Figure 181: South Asia Market Value (US$ Mn) by Product Type, 2023-2033
Figure 182: South Asia Market Value (US$ Mn) by Application, 2023-2033
Figure 183: South Asia Market Value (US$ Mn) by Form, 2023-2033
Figure 184: South Asia Market Value (US$ Mn) by Pet Type, 2023-2033
Figure 185: South Asia Market Value (US$ Mn) by Sales Channel, 2023-2033
Figure 186: South Asia Market Value (US$ Mn) by Country, 2023-2033
Figure 187: South Asia Market Value (US$ Mn) Analysis by Country, 2017-2033
Figure 188: South Asia Market Volume (Tons) Analysis by Country, 2017-2033
Figure 189: South Asia Market Value Share (%) and BPS Analysis by Country, 2023-2033
Figure 190: South Asia Market Y-o-Y Growth (%) Projections by Country, 2023-2033
Figure 191: South Asia Market Value (US$ Mn) Analysis by Product Type, 2017-2033
Figure 192: South Asia Market Volume (Tons) Analysis by Product Type, 2017-2033
Figure 193: South Asia Market Value Share (%) and BPS Analysis by Product Type, 2023-2033
Figure 194: South Asia Market Y-o-Y Growth (%) Projections by Product Type, 2023-2033
Figure 195: South Asia Market Value (US$ Mn) Analysis by Application, 2017-2033
Figure 196: South Asia Market Volume (Tons) Analysis by Application, 2017-2033
Figure 197: South Asia Market Value Share (%) and BPS Analysis by Application, 2023-2033
Figure 198: South Asia Market Y-o-Y Growth (%) Projections by Application, 2023-2033
Figure 199: South Asia Market Value (US$ Mn) Analysis by Form, 2017-2033
Figure 200: South Asia Market Volume (Tons) Analysis by Form, 2017-2033
Figure 201: South Asia Market Value Share (%) and BPS Analysis by Form, 2023-2033
Figure 202: South Asia Market Y-o-Y Growth (%) Projections by Form, 2023-2033
Figure 203: South Asia Market Value (US$ Mn) Analysis by Pet Type, 2017-2033
Figure 204: South Asia Market Volume (Tons) Analysis by Pet Type, 2017-2033
Figure 205: South Asia Market Value Share (%) and BPS Analysis by Pet Type, 2023-2033
Figure 206: South Asia Market Y-o-Y Growth (%) Projections by Pet Type, 2023-2033
Figure 207: South Asia Market Value (US$ Mn) Analysis by Sales Channel, 2017-2033
Figure 208: South Asia Market Volume (Tons) Analysis by Sales Channel, 2017-2033
Figure 209: South Asia Market Value Share (%) and BPS Analysis by Sales Channel, 2023-2033
Figure 210: South Asia Market Y-o-Y Growth (%) Projections by Sales Channel, 2023-2033
Figure 211: South Asia Market Attractiveness by Product Type, 2023-2033
Figure 212: South Asia Market Attractiveness by Application, 2023-2033
Figure 213: South Asia Market Attractiveness by Form, 2023-2033
Figure 214: South Asia Market Attractiveness by Pet Type, 2023-2033
Figure 215: South Asia Market Attractiveness by Sales Channel, 2023-2033
Figure 216: South Asia Market Attractiveness by Country, 2023-2033
Figure 217: Oceania Market Value (US$ Mn) by Product Type, 2023-2033
Figure 218: Oceania Market Value (US$ Mn) by Application, 2023-2033
Figure 219: Oceania Market Value (US$ Mn) by Form, 2023-2033
Figure 220: Oceania Market Value (US$ Mn) by Pet Type, 2023-2033
Figure 221: Oceania Market Value (US$ Mn) by Sales Channel, 2023-2033
Figure 222: Oceania Market Value (US$ Mn) by Country, 2023-2033
Figure 223: Oceania Market Value (US$ Mn) Analysis by Country, 2017-2033
Figure 224: Oceania Market Volume (Tons) Analysis by Country, 2017-2033
Figure 225: Oceania Market Value Share (%) and BPS Analysis by Country, 2023-2033
Figure 226: Oceania Market Y-o-Y Growth (%) Projections by Country, 2023-2033
Figure 227: Oceania Market Value (US$ Mn) Analysis by Product Type, 2017-2033
Figure 228: Oceania Market Volume (Tons) Analysis by Product Type, 2017-2033
Figure 229: Oceania Market Value Share (%) and BPS Analysis by Product Type, 2023-2033
Figure 230: Oceania Market Y-o-Y Growth (%) Projections by Product Type, 2023-2033
Figure 231: Oceania Market Value (US$ Mn) Analysis by Application, 2017-2033
Figure 232: Oceania Market Volume (Tons) Analysis by Application, 2017-2033
Figure 233: Oceania Market Value Share (%) and BPS Analysis by Application, 2023-2033
Figure 234: Oceania Market Y-o-Y Growth (%) Projections by Application, 2023-2033
Figure 235: Oceania Market Value (US$ Mn) Analysis by Form, 2017-2033
Figure 236: Oceania Market Volume (Tons) Analysis by Form, 2017-2033
Figure 237: Oceania Market Value Share (%) and BPS Analysis by Form, 2023-2033
Figure 238: Oceania Market Y-o-Y Growth (%) Projections by Form, 2023-2033
Figure 239: Oceania Market Value (US$ Mn) Analysis by Pet Type, 2017-2033
Figure 240: Oceania Market Volume (Tons) Analysis by Pet Type, 2017-2033
Figure 241: Oceania Market Value Share (%) and BPS Analysis by Pet Type, 2023-2033
Figure 242: Oceania Market Y-o-Y Growth (%) Projections by Pet Type, 2023-2033
Figure 243: Oceania Market Value (US$ Mn) Analysis by Sales Channel, 2017-2033
Figure 244: Oceania Market Volume (Tons) Analysis by Sales Channel, 2017-2033
Figure 245: Oceania Market Value Share (%) and BPS Analysis by Sales Channel, 2023-2033
Figure 246: Oceania Market Y-o-Y Growth (%) Projections by Sales Channel, 2023-2033
Figure 247: Oceania Market Attractiveness by Product Type, 2023-2033
Figure 248: Oceania Market Attractiveness by Application, 2023-2033
Figure 249: Oceania Market Attractiveness by Form, 2023-2033
Figure 250: Oceania Market Attractiveness by Pet Type, 2023-2033
Figure 251: Oceania Market Attractiveness by Sales Channel, 2023-2033
Figure 252: Oceania Market Attractiveness by Country, 2023-2033
Figure 253: MEA Market Value (US$ Mn) by Product Type, 2023-2033
Figure 254: MEA Market Value (US$ Mn) by Application, 2023-2033
Figure 255: MEA Market Value (US$ Mn) by Form, 2023-2033
Figure 256: MEA Market Value (US$ Mn) by Pet Type, 2023-2033
Figure 257: MEA Market Value (US$ Mn) by Sales Channel, 2023-2033
Figure 258: MEA Market Value (US$ Mn) by Country, 2023-2033
Figure 259: MEA Market Value (US$ Mn) Analysis by Country, 2017-2033
Figure 260: MEA Market Volume (Tons) Analysis by Country, 2017-2033
Figure 261: MEA Market Value Share (%) and BPS Analysis by Country, 2023-2033
Figure 262: MEA Market Y-o-Y Growth (%) Projections by Country, 2023-2033
Figure 263: MEA Market Value (US$ Mn) Analysis by Product Type, 2017-2033
Figure 264: MEA Market Volume (Tons) Analysis by Product Type, 2017-2033
Figure 265: MEA Market Value Share (%) and BPS Analysis by Product Type, 2023-2033
Figure 266: MEA Market Y-o-Y Growth (%) Projections by Product Type, 2023-2033
Figure 267: MEA Market Value (US$ Mn) Analysis by Application, 2017-2033
Figure 268: MEA Market Volume (Tons) Analysis by Application, 2017-2033
Figure 269: MEA Market Value Share (%) and BPS Analysis by Application, 2023-2033
Figure 270: MEA Market Y-o-Y Growth (%) Projections by Application, 2023-2033
Figure 271: MEA Market Value (US$ Mn) Analysis by Form, 2017-2033
Figure 272: MEA Market Volume (Tons) Analysis by Form, 2017-2033
Figure 273: MEA Market Value Share (%) and BPS Analysis by Form, 2023-2033
Figure 274: MEA Market Y-o-Y Growth (%) Projections by Form, 2023-2033
Figure 275: MEA Market Value (US$ Mn) Analysis by Pet Type, 2017-2033
Figure 276: MEA Market Volume (Tons) Analysis by Pet Type, 2017-2033
Figure 277: MEA Market Value Share (%) and BPS Analysis by Pet Type, 2023-2033
Figure 278: MEA Market Y-o-Y Growth (%) Projections by Pet Type, 2023-2033
Figure 279: MEA Market Value (US$ Mn) Analysis by Sales Channel, 2017-2033
Figure 280: MEA Market Volume (Tons) Analysis by Sales Channel, 2017-2033
Figure 281: MEA Market Value Share (%) and BPS Analysis by Sales Channel, 2023-2033
Figure 282: MEA Market Y-o-Y Growth (%) Projections by Sales Channel, 2023-2033
Figure 283: MEA Market Attractiveness by Product Type, 2023-2033
Figure 284: MEA Market Attractiveness by Application, 2023-2033
Figure 285: MEA Market Attractiveness by Form, 2023-2033
Figure 286: MEA Market Attractiveness by Pet Type, 2023-2033
Figure 287: MEA Market Attractiveness by Sales Channel, 2023-2033
Figure 288: MEA Market Attractiveness by Country, 2023-2033
Need specific information?
Request CustomizationExplore Food and Beverage Insights
View Reports