Pet Antibody Testing Market Size, Share & Forecast Outlook 2025 to 2035

The pet antibody testing market is estimated at USD 534.7 million in 2025 and is projected to exceed USD 879.3 million by 2035, growing at a CAGR of 5.1%.
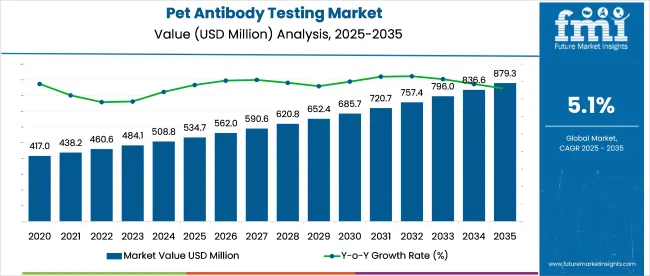
Quick Stats of the Pet Antibody Testing Market

  • Industry Size (2025): USD 534.7 million
  • Industry Value (2035): USD 879.3 million
  • Forecast CAGR (2025 to 2035): 5.1%
  • Leading Segment: Companion Animals (86%)
  • Key Growth Region: South Asia (India)
  • Key Players: IDEXX Laboratories, Biogal-Galed Laboratories, Randox Laboratories, Getein Animal Medical Technology, Guangzhou Wondfo Biotech Co., Ltd.

Pet Antibody Testing Market

Demand is being underpinned by rising pet ownership, enhanced zoonotic disease surveillance, and strict vaccination protocols enforced for international pet movement. Rabies-neutralizing antibody assays are being favored as the gold standard, with rapid fluorescent focus inhibition tests (RFFIT) and mouse neutralization tests (MNT) being prioritized across veterinary laboratories.

It is argued that adoption could be accelerated through point-of-care platforms and blockchain-based result tracking, which would enhance traceability and compliance.

In November 2023, Heska, now part of Antech under Mars Petcare, launched its Element i+™ Respiratory Profile to enhance diagnostic capabilities for companion animals. This multiplex panel uses antibody serology to detect prior exposure to pathogens such as heartworm, Lyme disease, and various respiratory viruses.

The tool supports veterinarians in making timely, evidence-based treatment decisions. Emphasizing the significance of this advancement, Kevin Wilson, Chief Commercial Officer at Heska, noted, “Antibody serology remains critical for detecting exposure to pathogens like heartworm, Lyme, and respiratory viruses in pets. Our new multiplex respiratory panel leverages this technology to provide veterinarians with actionable insights for faster, more informed treatment decisions.”

The industry holds a specialized share within its parent markets. In the veterinary diagnostics market, it accounts for approximately 5-7%, as antibody tests are just one aspect of the broader diagnostic tools used for animals. Within the animal health market, its share is around 3-4%, driven by the increasing focus on disease prevention and monitoring in pets.

In the biotechnology market, the share is about 1-2%, as pet antibody testing leverages biotechnological methods but is a niche segment within the broader biotech industry. Within the pharmaceuticals market, its share is approximately 2-3%, due to its role in vaccine development and monitoring immunity. In the pet care market, the share is around 1-2%, as antibody testing is increasingly used for preventive healthcare in pets.

Analyzing Pet Antibody Testing Market by Top Investment Segments

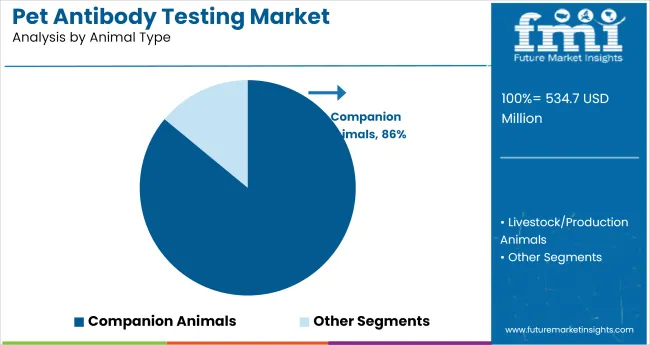
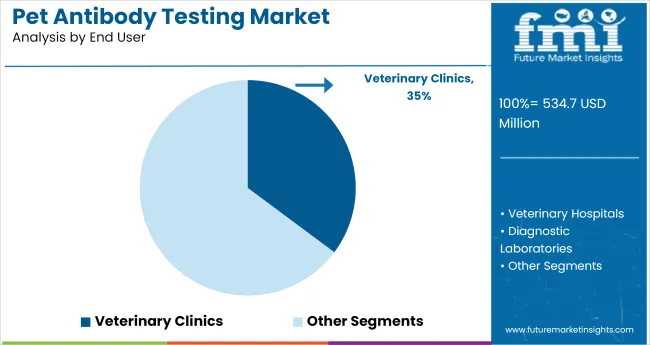
The industry is expected to grow, with kits leading the product type segment at 58.2%. Companion animals will dominate the animal type segment with 86%, chronic conditions will lead the application segment with 55.7%, and veterinary clinics will hold 35.2% of the end-user industry.
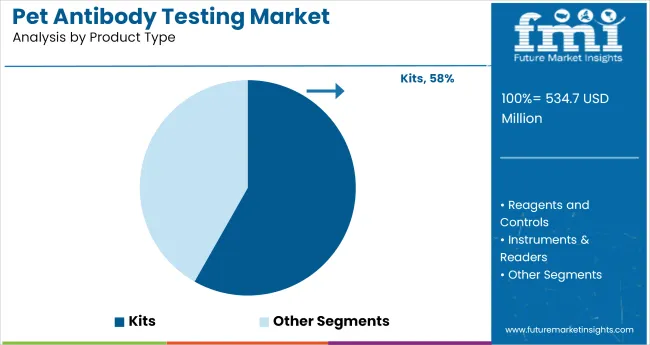
Kits Hold the Largest Share in the Product Type Segment at 58.2%

Pet Antibody Testing Market Analysis By Product Type

Kits are projected to account for 58.2% of the industry share in 2025, with antibody test kits, ELISA kits, immunofluorescence assay (IFA) kits, and at-home kits being the primary drivers. These kits are widely used due to their ease of use, accuracy, and ability to provide quick results. The increasing demand for at-home testing and growing awareness among pet owners are expected to support the continued dominance of kits in the industry.
  • Widely used for their accuracy, ease of use, and quick results
  • At-home kits gaining traction due to convenience and increasing pet owner awareness
  • ELISA and IFA kits remain essential for laboratory and clinical use

Companion Animals Capture the Majority of the Animal Type Segment with 86% Share

Pet Antibody Testing Market Analysis By Animal Type

Companion animals are expected to dominate the animal type segment, capturing 86% of the industry share in 2025. This dominance is driven by the rising pet adoption rates, particularly dogs and cats, and their increasing inclusion in health management and veterinary care.

Pet antibody testing is essential for diagnosing various diseases, including allergies, autoimmune disorders, and chronic conditions, further driving the demand in companion animals. As owners continue to prioritize the health and well-being of pets, the companion animal segment remains the largest industry segment for pet antibody testing.

  • Dominated by dogs and cats due to rising pet adoption rates
  • Growing focus on health management and disease prevention drives demand
  • Increased awareness and care for pets’ health supports industry growth

Chronic Conditions Lead the Application Segment, Accounting for 55.7% of the Industry Share

Chronic conditions are projected to capture 55.7% of the industry in 2025, driven by the need for ongoing diagnostic support and management in pets with long-term health conditions. Conditions like arthritis, diabetes, and kidney disease are common in aging pets, driving the demand for early detection and continuous monitoring through antibody testing.

The growing focus on preventive healthcare and improving the quality of life for aging pets contributes to the dominance of chronic conditions as a key application for pet antibody testing.
  • Ongoing diagnostic support needed for pets with chronic health conditions
  • Rising focus on early detection and monitoring for aging pets with long-term conditions
  • Preventive healthcare trends boost demand for chronic condition testing

Veterinary Clinics Dominate the End-User Segment with 35.2% Industry Share

Pet Antibody Testing Market Analysis By End User

Veterinary clinics are expected to hold 35.2% of the industry share in 2025. Veterinary clinics play a key role in diagnosing and managing pet health conditions, including autoimmune disorders, allergies, and chronic conditions, making them a primary end-user for pet antibody tests.

The growing number of pet clinics, coupled with increasing pet healthcare awareness, drives the demand for antibody testing services. With a strong focus on clinical diagnostics, veterinary clinics remain a vital hub for antibody testing, providing accurate and timely results for pet owners and veterinarians alike.

  • Veterinary clinics are essential for diagnosing and managing various pet health conditions
  • Increasing number of pet clinics and pet healthcare awareness drives demand
  • Focus on clinical diagnostics reinforces veterinary clinics as a dominant end-user

Top Pet Antibody Testing Market Dynamics

The industry is expanding due to increased pet ownership and a growing focus on animal health. However, challenges such as high testing costs and limited access to veterinary services in certain regions hinder broader adoption.

Rising Pet Ownership and Health Awareness

The surge in pet ownership globally is a significant driver of the industry. As more households adopt pets, particularly in emerging economies, the demand for veterinary services, including diagnostic tests, has increased. This trend is coupled with a heightened awareness among pet owners about the importance of preventive healthcare and early disease detection, further propelling the industry's growth.

  • Increased pet ownership globally drives demand for veterinary services.
  • Heightened awareness of preventive healthcare among pet owners.
  • Rising incidence of chronic diseases in pets necessitates regular testing.

High Costs and Limited Access to Veterinary Services

Despite the growing demand, the industry faces challenges related to high costs and limited access to veterinary services. Advanced diagnostic tests can be expensive, making them less accessible to pet owners in lower-income regions. Additionally, in rural or underserved areas, the availability of veterinary clinics equipped to perform such tests is limited, restricting industry growth.
  • High costs of advanced diagnostic tests limit accessibility.
  • Limited availability of veterinary clinics in rural areas.
  • Economic disparities affect pet owners' ability to afford testing.

Analyzing Key Countries Producing, Distributing, and Adopting Pet Antibody Testing Solutions

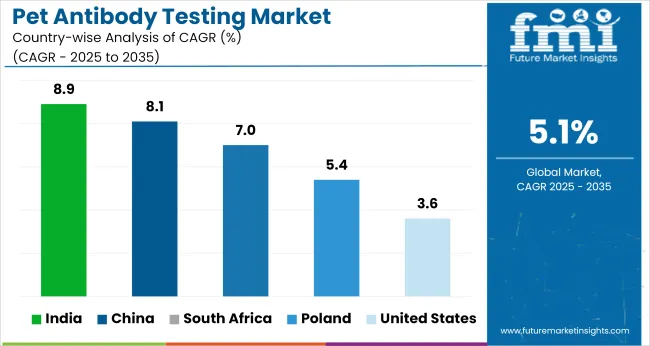
Pet Antibody Testing Market Cagr Analysis By Country

Countries CAGR (2025 to 2035)
India 8.9%
China 8.1%
South Africa 7 %
Poland 5.4%
United States 3.6%

Global industry demand is projected to rise at a 5.1% CAGR from 2025 to 2035. Of the five profiled countries out of 40 covered, India leads at 8.9%, followed by China at 8.1%, and South Africa at 7%, while Poland records 5.4% and the United States posts 3.6%.

These rates translate to a growth premium of +74% for India, +59% for China, and +37% for South Africa versus the baseline, while the United States shows slower growth. Divergence reflects local catalysts: increasing pet ownership and demand for health testing solutions in India and China, while more mature industries like the United States experience slower adoption, and South Africa benefits from rising awareness and veterinary care infrastructure development.

Analysis of Pet Antibody Testing Market in India

The industry in India is forecast to grow at a CAGR of 8.9% through 2035, driven by expanding companion animal ownership and rising interest in clinical diagnostics across urban veterinary centers. Diagnostic kits for canine parvovirus, distemper, and rabies antibodies are seeing higher adoption in Tier-1 and Tier-2 cities. State veterinary universities have initiated testing centers linked with outreach clinics to improve access.

  • Companion animal welfare boards are subsidizing diagnostic kits for NGOs.
  • Demand for pre-vaccination and titer testing has increased post-COVID.
  • Local firms now assemble ELISA-based antibody panels for routine practice.

Demand Forecast for Pet Antibody Testing Market in China

The industry in China is projected to grow at a CAGR of 8.1% from 2025 to 2035, supported by rising disposable income among pet owners and a growing preference for scientific veterinary care. High-end clinics in Beijing, Shanghai, and Guangzhou are deploying antibody tests for disease screening and vaccine monitoring. Partnerships with diagnostic labs and pet pharma firms are fueling innovation in rapid test formats.

  • Large domestic chains have integrated antibody titers into wellness plans.
  • Demand has surged for export-qualifying rabies antibody certificates.
  • E-commerce platforms now distribute home antibody sampling kits for cats and dogs.

Growth Analysis of Pet Antibody Testing Market in South Africa

The industry in South Africa is anticipated to grow at a CAGR of 7%. Diagnostic expansion is driven by increased regulation of pet travel, disease surveillance, and proactive pet health management. Veterinary clinics in Johannesburg and Cape Town have upgraded in-clinic testing labs, and wildlife rehabilitation centers are using antibody assays for zoonotic disease monitoring.

  • The Department of Agriculture mandates antibody testing for imported pets.
  • NGOs conduct antibody testing drives in rural communities for rabies control.
  • Export-certified diagnostic centers offer FAVN tests for outbound travel.

Future Outlook for Pet Antibody Testing Market in Poland

The industry in Poland is expected to rise at a CAGR of 5.4% during the forecast period. Growth is being sustained by the rising number of companion animals and mandatory EU travel testing requirements. Veterinary laboratories offer bundled antibody screening panels, and veterinary associations are promoting continuing education in diagnostic practices.

  • EU pet passport system has pushed demand for rabies antibody testing.
  • Regional veterinary groups are partnering with test manufacturers to expand access.
  • Antibody kits are gaining ground in mobile veterinary units in semi-urban areas.

Pet Antibody Testing Market Growth Outlook in the United States

The United States industry is projected to expand at a CAGR of 3.6% from 2025 to 2035. Testing is concentrated in large veterinary hospitals and specialty clinics. Regulatory-compliant testing, such as rabies titers for international travel, and screening for autoimmune conditions drive demand. Preventive care plans in urban clinics now include annual antibody titer tracking.

  • Companion Animal Parasite Council recommends titer testing as an alternative to re-vaccination.
  • Leading veterinary diagnostic firms offer same-day results for antibody panels.
  • Private pet insurers are reimbursing preventive diagnostic tests under premium plans.

Leading Pet Antibody Testing Market Suppliers

The global industry is dominated by IDEXX Laboratories, Inc., which holds a significant share through its extensive portfolio of diagnostic tests for companion animals. IDEXX’s products are widely used across veterinary clinics and laboratories, providing reliable and rapid results for diagnosing various conditions.

Competitors like Zoetis, Thermo Fisher Scientific, and Neogen also offer similar diagnostic solutions, but IDEXX’s established distribution network and continuous innovation position it as the leader in the industry, strengthening its industry dominance and contributing to ongoing growth in veterinary diagnostics.

Recent Industry Developments

  • In February 2024, BioStone Animal Health launched the AsurDx™ Rabies Antibody Test Kit, an ELISA-based diagnostic tool for rapid, cost-effective screening of rabies antibodies in mammalian serum. The test supports both vaccination monitoring and compliance with international pet travel protocols.
  • In June 2025, Elanco received conditional USDA approval for its Canine Parvovirus Monoclonal Antibody, offering passive immunity to parvo-exposed puppies. Though therapeutic in focus, the rollout includes shelter-based sampling programs, reinforcing Elanco’s presence in antibody-related diagnostics and expanding visibility in the pet antibody testing segment.

Report Scope

Report Attributes Details
Current Industry Size (2025) USD 534.7 million
Projected Industry Size (2035) USD 879.3 million
CAGR (2025 to 2035) 5.1%
Base Year for Estimation 2024
Historical Period 2020 to 2024
Projections Period 2025 to 2035
Quantitative Units USD million for value and million units for volume
Product Type Segmentation Kits (Antibody Test Kits, ELISA Kits, Immunofluorescence Assay (IFA) Kits, At-home Kits), Reagents and Controls, Instruments & Readers
Animal Type Segmentation Companion Animals, Livestock/Production Animals
Application Segmentation Autoimmune Disorders, Allergies & Dermatology, Chronic Conditions
End-User Segmentation Veterinary Hospitals, Veterinary Clinics, Diagnostic Laboratories, Pet Owners / At-Home Testing
Regions Covered North America, Latin America, Western Europe, Eastern Europe, South Asia & Pacific, East Asia, Central Asia, Balkan and Baltic Countries, Russia and Belarus, Middle East & Africa
Countries Covered United States, Canada, Mexico, Brazil, Argentina, Germany, France, United Kingdom, Italy, Spain, Netherlands, China, India, Japan, South Korea, Australia, New Zealand, GCC Countries, South Africa
Key Players Influencing the Industry Biogal - Galed Laboratories, IDEXX Laboratories, Getein Animal Medical Technology, Guangzhou Wondfo Biotech Co., Ltd., TestLine Clinical Diagnostics, Wuhan J.H. Bio-Tech Co., Ltd., Rohi Biotechnology Co., Ltd., Randox Laboratories, DRG Instruments GmbH, ALPCO
Additional Attributes Dollar sales by product type, animal type, application, and end-user, increasing adoption of antibody testing in veterinary care, growing demand for at-home testing kits, advancements in diagnostics for autoimmune and chronic conditions, regional trends in pet healthcare and diagnostics.

Key Players

  • Biogal-Galed Laboratories
  • IDEXX Laboratories
  • Getein Animal Medical Technology
  • Guangzhou Wondfo Biotech Co., Ltd.
  • TestLine Clinical Diagnostics
  • Wuhan J.H. Bio‑Tech Co., Ltd.
  • Rohi Biotechnology Co., Ltd.
  • Randox Laboratories
  • DRG Instruments GmbH
  • ALPCO

Pet Antibody Testing Market Analyzed by Key Investment Segments

By Product Type:

The segmentation by product type includes Kits, Reagents and Controls, and Instruments & Readers. Kits consist of Antibody Test Kits, ELISA Kits, Immunofluorescence Assay (IFA) Kits, and At-home Kits.

By Animal Type:

Based on animal type, the industry is divided into companion animals and livestock/production animals.

By Applications:

Applications include autoimmune disorders, allergies & dermatology, and chronic conditions.

By End User:

End-user categories include veterinary hospitals, veterinary clinics, diagnostic laboratories, and pet owners / at-home testing.

By Region:

The industry spans North America, Latin America, Western Europe, Eastern Europe, South Asia & Pacific, East Asia, Central Asia, Balkan and Baltic Countries, Russia and Belarus, and The Middle East & Africa.

Table of Content

  1. Executive Summary
    • Global Market Outlook
    • Demand-side Trends
    • Supply-side Trends
    • Technology Roadmap Analysis
    • Analysis and Recommendations
  2. Market Overview
    • Market Coverage / Taxonomy
    • Market Definition / Scope / Limitations
  3. Market Background
    • Market Dynamics
      • Drivers
      • Restraints
      • Opportunity
      • Trends
    • Scenario Forecast
      • Demand in Optimistic Scenario
      • Demand in Likely Scenario
      • Demand in Conservative Scenario
    • Opportunity Map Analysis
    • Product Life Cycle Analysis
    • Supply Chain Analysis
      • Supply Side Participants and their Roles
        • Producers
        • Mid-Level Participants (Traders/ Agents/ Brokers)
        • Wholesalers and Distributors
      • Value Added and Value Created at Node in the Supply Chain
      • List of Raw Material Suppliers
      • List of Existing and Potential Buyer’s
    • Investment Feasibility Matrix
    • Value Chain Analysis
      • Profit Margin Analysis
      • Wholesalers and Distributors
      • Retailers
    • PESTLE and Porter’s Analysis
    • Regulatory Landscape
      • By Key Regions
      • By Key Countries
    • Regional Parent Market Outlook
    • Production and Consumption Statistics
    • Import and Export Statistics
  4. Global Market Analysis 2020 to 2024 and Forecast, 2025 to 2035
    • Historical Market Size Value (USD Million) & Volume (Million Units) Analysis, 2020 to 2024
    • Current and Future Market Size Value (USD Million) & Volume (Million Units) Projections, 2025 to 2035
      • Y-o-Y Growth Trend Analysis
      • Absolute $ Opportunity Analysis
  5. Global Market Pricing Analysis 2020 to 2024 and Forecast 2025 to 2035
  6. Global Market Analysis 2020 to 2024 and Forecast 2025 to 2035, By Product Type
    • Introduction / Key Findings
    • Historical Market Size Value (USD Million) & Volume (Million Units) Analysis By Product Type, 2020 to 2024
    • Current and Future Market Size Value (USD Million) & Volume (Million Units) Analysis and Forecast By Product Type, 2025 to 2035
      • Kits
        • Antibody Test Kits
        • ELISA Kits
        • Immunofluorescence Assay (IFA) Kits
        • At-home Kits
      • Reagents and Controls
      • Instruments & Readers
    • Y-o-Y Growth Trend Analysis By Product Type, 2020 to 2024
    • Absolute $ Opportunity Analysis By Product Type, 2025 to 2035
  7. Global Market Analysis 2020 to 2024 and Forecast 2025 to 2035, By Animal Type
    • Introduction / Key Findings
    • Historical Market Size Value (USD Million) & Volume (Million Units) Analysis By Animal Type, 2020 to 2024
    • Current and Future Market Size Value (USD Million) & Volume (Million Units) Analysis and Forecast By Animal Type, 2025 to 2035
      • Companion Animals
      • Livestock/Production Animals
    • Y-o-Y Growth Trend Analysis By Animal Type, 2020 to 2024
    • Absolute $ Opportunity Analysis By Animal Type, 2025 to 2035
  8. Global Market Analysis 2020 to 2024 and Forecast 2025 to 2035, By Applications
    • Introduction / Key Findings
    • Historical Market Size Value (USD Million) & Volume (Million Units) Analysis By Applications, 2020 to 2024
    • Current and Future Market Size Value (USD Million) & Volume (Million Units) Analysis and Forecast By Applications, 2025 to 2035
      • Autoimmune Disorders
      • Allergies & Dermatology
      • Chronic Conditions
    • Y-o-Y Growth Trend Analysis By Applications, 2020 to 2024
    • Absolute $ Opportunity Analysis By Applications, 2025 to 2035
  9. Global Market Analysis 2020 to 2024 and Forecast 2025 to 2035, By End User
    • Introduction / Key Findings
    • Historical Market Size Value (USD Million) & Volume (Million Units) Analysis By End User, 2020 to 2024
    • Current and Future Market Size Value (USD Million) & Volume (Million Units) Analysis and Forecast By End User, 2025 to 2035
      • Veterinary Hospitals
      • Veterinary Clinics
      • Diagnostic Laboratories
      • Pet Owners / At-Home Testing
    • Y-o-Y Growth Trend Analysis By End User, 2020 to 2024
    • Absolute $ Opportunity Analysis By End User, 2025 to 2035
  10. Global Market Analysis 2020 to 2024 and Forecast 2025 to 2035, By Region
    • Introduction
    • Historical Market Size Value (USD Million) & Volume (Million Units) Analysis By Region, 2020 to 2024
    • Current Market Size Value (USD Million) & Volume (Million Units) Analysis and Forecast By Region, 2025 to 2035
      • North America
      • Latin America
      • Western Europe
      • Eastern Europe
      • East Asia
      • South Asia & Pacific
      • Middle East and Africa
    • Market Attractiveness Analysis By Region
  11. North America Market Analysis 2020 to 2024 and Forecast 2025 to 2035, By Country
    • Historical Market Size Value (USD Million) & Volume (Million Units) Trend Analysis By Market Taxonomy, 2020 to 2024
    • Market Size Value (USD Million) & Volume (Million Units) Forecast By Market Taxonomy, 2025 to 2035
      • By Country
        • USA
        • Canada
        • Mexico
      • By Product Type
      • By Animal Type
      • By Applications
      • By End User
    • Market Attractiveness Analysis
      • By Country
      • By Product Type
      • By Animal Type
      • By Applications
      • By End User
    • Key Takeaways
  12. Latin America Market Analysis 2020 to 2024 and Forecast 2025 to 2035, By Country
    • Historical Market Size Value (USD Million) & Volume (Million Units) Trend Analysis By Market Taxonomy, 2020 to 2024
    • Market Size Value (USD Million) & Volume (Million Units) Forecast By Market Taxonomy, 2025 to 2035
      • By Country
        • Brazil&
        • Argentina
        • Rest of LATAM
      • By Product Type
      • By Animal Type
      • By Applications
      • By End User
    • Market Attractiveness Analysis
      • By Country
      • By Product Type
      • By Animal Type
      • By Applications
      • By End User
    • Key Takeaways
  13. Western Europe Market Analysis 2020 to 2024 and Forecast 2025 to 2035, By Country
    • Historical Market Size Value (USD Million) & Volume (Million Units) Trend Analysis By Market Taxonomy, 2020 to 2024
    • Market Size Value (USD Million) & Volume (Million Units) Forecast By Market Taxonomy, 2025 to 2035
      • By Country
        • Germany
        • Italy
        • France
        • UK
        • Spain
        • BENELUX
        • Nordic
        • Rest of W.Europe
      • By Product Type
      • By Animal Type
      • By Applications
      • By End User
    • Market Attractiveness Analysis
      • By Country
      • By Product Type
      • By Animal Type
      • By Applications
      • By End User
    • Key Takeaways
  14. Eastern Europe Market Analysis 2020 to 2024 and Forecast 2025 to 2035, By Country
    • Historical Market Size Value (USD Million) & Volume (Million Units) Trend Analysis By Market Taxonomy, 2020 to 2024
    • Market Size Value (USD Million) & Volume (Million Units) Forecast By Market Taxonomy, 2025 to 2035
      • By Country
        • Russia
        • Hungary
        • Poland
        • Balkan & Baltics
        • Rest of E. Europe
      • By Product Type
      • By Animal Type
      • By Applications
      • By End User
    • Market Attractiveness Analysis
      • By Country
      • By Product Type
      • By Animal Type
      • By Applications
      • By End User
    • Key Takeaways
  15. East Asia Market Analysis 2020 to 2024 and Forecast 2025 to 2035, By Country
    • Historical Market Size Value (USD Million) & Volume (Million Units) Trend Analysis By Market Taxonomy, 2020 to 2024
    • Market Size Value (USD Million) & Volume (Million Units) Forecast By Market Taxonomy, 2025 to 2035
      • By Country
        • China
        • Japan
        • South Korea
      • By Product Type
      • By Animal Type
      • By Applications
      • By End User
    • Market Attractiveness Analysis
      • By Country
      • By Product Type
      • By Animal Type
      • By Applications
      • By End User
    • Key Takeaways
  16. South Asia & Pacific Market Analysis 2020 to 2024 and Forecast 2025 to 2035, By Country
    • Historical Market Size Value (USD Million) & Volume (Million Units) Trend Analysis By Market Taxonomy, 2020 to 2024
    • Market Size Value (USD Million) & Volume (Million Units) Forecast By Market Taxonomy, 2025 to 2035
      • By Country
        • India
        • Australia & New Zealand
        • ASEAN
        • Rest of SAP
      • By Product Type
      • By Animal Type
      • By Applications
      • By End User
    • Market Attractiveness Analysis
      • By Country
      • By Product Type
      • By Animal Type
      • By Applications
      • By End User
    • Key Takeaways
  17. Middle East and Africa Market Analysis 2020 to 2024 and Forecast 2025 to 2035, By Country
    • Historical Market Size Value (USD Million) & Volume (Million Units) Trend Analysis By Market Taxonomy, 2020 to 2024
    • Market Size Value (USD Million) & Volume (Million Units) Forecast By Market Taxonomy, 2025 to 2035
      • By Country
        • GCC Countries
        • Northern Africa
        • South Africa
        • Turkiye
        • Rest of MEA
      • By Product Type
      • By Animal Type
      • By Applications
      • By End User
    • Market Attractiveness Analysis
      • By Country
      • By Product Type
      • By Animal Type
      • By Applications
      • By End User
    • Key Takeaways
  18. Key Countries Market Analysis
    • USA
      • Pricing Analysis
      • Market Share Analysis, 2024
        • By Product Type
        • By Animal Type
        • By Applications
        • By End User
    • Canada
      • Pricing Analysis
      • Market Share Analysis, 2024
        • By Product Type
        • By Animal Type
        • By Applications
        • By End User
    • Brazil
      • Pricing Analysis
      • Market Share Analysis, 2024
        • By Product Type
        • By Animal Type
        • By Applications
        • By End User
    • Mexico
      • Pricing Analysis
      • Market Share Analysis, 2024
        • By Product Type
        • By Animal Type
        • By Applications
        • By End User
    • Argentina
      • Pricing Analysis
      • Market Share Analysis, 2024
        • By Product Type
        • By Animal Type
        • By Applications
        • By End User
  19. Market Structure Analysis
    • Competition Dashboard
    • Competition Benchmarking
    • Market Share Analysis of Top Players
      • By Regional
      • By Product Type
      • By Animal Type
      • By Applications
      • By End User
  20. Competition Analysis
    • Competition Deep Dive
      • Biogal - Galed Laboratories
        • Overview
        • Product Portfolio
        • Profitability by Market Segments (Product/Age /Sales Channel/Region)
        • Sales Footprint
        • Strategy Overview
          • Marketing Strategy
          • Product Strategy
          • Channel Strategy
      • IDEXX Laboratories
        • Overview
        • Product Portfolio
        • Profitability by Market Segments (Product/Age /Sales Channel/Region)
        • Sales Footprint
        • Strategy Overview
          • Marketing Strategy
          • Product Strategy
          • Channel Strategy
      • Getein Animal Medical Technology
        • Overview
        • Product Portfolio
        • Profitability by Market Segments (Product/Age /Sales Channel/Region)
        • Sales Footprint
        • Strategy Overview
          • Marketing Strategy
          • Product Strategy
          • Channel Strategy
      • Guangzhou Wondfo Biotech Co., Ltd.
        • Overview
        • Product Portfolio
        • Profitability by Market Segments (Product/Age /Sales Channel/Region)
        • Sales Footprint
        • Strategy Overview
          • Marketing Strategy
          • Product Strategy
          • Channel Strategy
      • TestLine Clinical Diagnostics
        • Overview
        • Product Portfolio
        • Profitability by Market Segments (Product/Age /Sales Channel/Region)
        • Sales Footprint
        • Strategy Overview
          • Marketing Strategy
          • Product Strategy
          • Channel Strategy
      • Wuhan J.H. Bio‑Tech Co., Ltd.
        • Overview
        • Product Portfolio
        • Profitability by Market Segments (Product/Age /Sales Channel/Region)
        • Sales Footprint
        • Strategy Overview
          • Marketing Strategy
          • Product Strategy
          • Channel Strategy
      • Rohi Biotechnology Co., Ltd.
        • Overview
        • Product Portfolio
        • Profitability by Market Segments (Product/Age /Sales Channel/Region)
        • Sales Footprint
        • Strategy Overview
          • Marketing Strategy
          • Product Strategy
          • Channel Strategy
      • Randox Laboratories
        • Overview
        • Product Portfolio
        • Profitability by Market Segments (Product/Age /Sales Channel/Region)
        • Sales Footprint
        • Strategy Overview
          • Marketing Strategy
          • Product Strategy
          • Channel Strategy
      • DRG Instruments GmbH
        • Overview
        • Product Portfolio
        • Profitability by Market Segments (Product/Age /Sales Channel/Region)
        • Sales Footprint
        • Strategy Overview
          • Marketing Strategy
          • Product Strategy
          • Channel Strategy
      • ALPCO
        • Overview
        • Product Portfolio
        • Profitability by Market Segments (Product/Age /Sales Channel/Region)
        • Sales Footprint
        • Strategy Overview
          • Marketing Strategy
          • Product Strategy
          • Channel Strategy
  21. Assumptions & Acronyms Used
  22. Research Methodology

List of Tables

  • Table 1: Global Market Value (USD Million) Forecast by Region, 2020 to 2035
  • Table 2: Global Market Volume (Million Units) Forecast by Region, 2020 to 2035
  • Table 3: Global Market Value (USD Million) Forecast by Product Type, 2020 to 2035
  • Table 4: Global Market Volume (Million Units) Forecast by Product Type, 2020 to 2035
  • Table 5: Global Market Value (USD Million) Forecast by Animal Type, 2020 to 2035
  • Table 6: Global Market Volume (Million Units) Forecast by Animal Type, 2020 to 2035
  • Table 7: Global Market Value (USD Million) Forecast by Applications, 2020 to 2035
  • Table 8: Global Market Volume (Million Units) Forecast by Applications, 2020 to 2035
  • Table 9: Global Market Value (USD Million) Forecast by End User, 2020 to 2035
  • Table 10: Global Market Volume (Million Units) Forecast by End User, 2020 to 2035
  • Table 11: North America Market Value (USD Million) Forecast by Country, 2020 to 2035
  • Table 12: North America Market Volume (Million Units) Forecast by Country, 2020 to 2035
  • Table 13: North America Market Value (USD Million) Forecast by Product Type, 2020 to 2035
  • Table 14: North America Market Volume (Million Units) Forecast by Product Type, 2020 to 2035
  • Table 15: North America Market Value (USD Million) Forecast by Animal Type, 2020 to 2035
  • Table 16: North America Market Volume (Million Units) Forecast by Animal Type, 2020 to 2035
  • Table 17: North America Market Value (USD Million) Forecast by Applications, 2020 to 2035
  • Table 18: North America Market Volume (Million Units) Forecast by Applications, 2020 to 2035
  • Table 19: North America Market Value (USD Million) Forecast by End User, 2020 to 2035
  • Table 20: North America Market Volume (Million Units) Forecast by End User, 2020 to 2035
  • Table 21: Latin America Market Value (USD Million) Forecast by Country, 2020 to 2035
  • Table 22: Latin America Market Volume (Million Units) Forecast by Country, 2020 to 2035
  • Table 23: Latin America Market Value (USD Million) Forecast by Product Type, 2020 to 2035
  • Table 24: Latin America Market Volume (Million Units) Forecast by Product Type, 2020 to 2035
  • Table 25: Latin America Market Value (USD Million) Forecast by Animal Type, 2020 to 2035
  • Table 26: Latin America Market Volume (Million Units) Forecast by Animal Type, 2020 to 2035
  • Table 27: Latin America Market Value (USD Million) Forecast by Applications, 2020 to 2035
  • Table 28: Latin America Market Volume (Million Units) Forecast by Applications, 2020 to 2035
  • Table 29: Latin America Market Value (USD Million) Forecast by End User, 2020 to 2035
  • Table 30: Latin America Market Volume (Million Units) Forecast by End User, 2020 to 2035
  • Table 31: Western Europe Market Value (USD Million) Forecast by Country, 2020 to 2035
  • Table 32: Western Europe Market Volume (Million Units) Forecast by Country, 2020 to 2035
  • Table 33: Western Europe Market Value (USD Million) Forecast by Product Type, 2020 to 2035
  • Table 34: Western Europe Market Volume (Million Units) Forecast by Product Type, 2020 to 2035
  • Table 35: Western Europe Market Value (USD Million) Forecast by Animal Type, 2020 to 2035
  • Table 36: Western Europe Market Volume (Million Units) Forecast by Animal Type, 2020 to 2035
  • Table 37: Western Europe Market Value (USD Million) Forecast by Applications, 2020 to 2035
  • Table 38: Western Europe Market Volume (Million Units) Forecast by Applications, 2020 to 2035
  • Table 39: Western Europe Market Value (USD Million) Forecast by End User, 2020 to 2035
  • Table 40: Western Europe Market Volume (Million Units) Forecast by End User, 2020 to 2035
  • Table 41: Eastern Europe Market Value (USD Million) Forecast by Country, 2020 to 2035
  • Table 42: Eastern Europe Market Volume (Million Units) Forecast by Country, 2020 to 2035
  • Table 43: Eastern Europe Market Value (USD Million) Forecast by Product Type, 2020 to 2035
  • Table 44: Eastern Europe Market Volume (Million Units) Forecast by Product Type, 2020 to 2035
  • Table 45: Eastern Europe Market Value (USD Million) Forecast by Animal Type, 2020 to 2035
  • Table 46: Eastern Europe Market Volume (Million Units) Forecast by Animal Type, 2020 to 2035
  • Table 47: Eastern Europe Market Value (USD Million) Forecast by Applications, 2020 to 2035
  • Table 48: Eastern Europe Market Volume (Million Units) Forecast by Applications, 2020 to 2035
  • Table 49: Eastern Europe Market Value (USD Million) Forecast by End User, 2020 to 2035
  • Table 50: Eastern Europe Market Volume (Million Units) Forecast by End User, 2020 to 2035
  • Table 51: East Asia Market Value (USD Million) Forecast by Country, 2020 to 2035
  • Table 52: East Asia Market Volume (Million Units) Forecast by Country, 2020 to 2035
  • Table 53: East Asia Market Value (USD Million) Forecast by Product Type, 2020 to 2035
  • Table 54: East Asia Market Volume (Million Units) Forecast by Product Type, 2020 to 2035
  • Table 55: East Asia Market Value (USD Million) Forecast by Animal Type, 2020 to 2035
  • Table 56: East Asia Market Volume (Million Units) Forecast by Animal Type, 2020 to 2035
  • Table 57: East Asia Market Value (USD Million) Forecast by Applications, 2020 to 2035
  • Table 58: East Asia Market Volume (Million Units) Forecast by Applications, 2020 to 2035
  • Table 59: East Asia Market Value (USD Million) Forecast by End User, 2020 to 2035
  • Table 60: East Asia Market Volume (Million Units) Forecast by End User, 2020 to 2035
  • Table 61: South Asia & Pacific Market Value (USD Million) Forecast by Country, 2020 to 2035
  • Table 62: South Asia & Pacific Market Volume (Million Units) Forecast by Country, 2020 to 2035
  • Table 63: South Asia & Pacific Market Value (USD Million) Forecast by Product Type, 2020 to 2035
  • Table 64: South Asia & Pacific Market Volume (Million Units) Forecast by Product Type, 2020 to 2035
  • Table 65: South Asia & Pacific Market Value (USD Million) Forecast by Animal Type, 2020 to 2035
  • Table 66: South Asia & Pacific Market Volume (Million Units) Forecast by Animal Type, 2020 to 2035
  • Table 67: South Asia & Pacific Market Value (USD Million) Forecast by Applications, 2020 to 2035
  • Table 68: South Asia & Pacific Market Volume (Million Units) Forecast by Applications, 2020 to 2035
  • Table 69: South Asia & Pacific Market Value (USD Million) Forecast by End User, 2020 to 2035
  • Table 70: South Asia & Pacific Market Volume (Million Units) Forecast by End User, 2020 to 2035
  • Table 71: Middle East and Africa Market Value (USD Million) Forecast by Country, 2020 to 2035
  • Table 72: Middle East and Africa Market Volume (Million Units) Forecast by Country, 2020 to 2035
  • Table 73: Middle East and Africa Market Value (USD Million) Forecast by Product Type, 2020 to 2035
  • Table 74: Middle East and Africa Market Volume (Million Units) Forecast by Product Type, 2020 to 2035
  • Table 75: Middle East and Africa Market Value (USD Million) Forecast by Animal Type, 2020 to 2035
  • Table 76: Middle East and Africa Market Volume (Million Units) Forecast by Animal Type, 2020 to 2035
  • Table 77: Middle East and Africa Market Value (USD Million) Forecast by Applications, 2020 to 2035
  • Table 78: Middle East and Africa Market Volume (Million Units) Forecast by Applications, 2020 to 2035
  • Table 79: Middle East and Africa Market Value (USD Million) Forecast by End User, 2020 to 2035
  • Table 80: Middle East and Africa Market Volume (Million Units) Forecast by End User, 2020 to 2035

List of Figures

  • Figure 1: Global Market Volume (Million Units) Forecast 2020 to 2035
  • Figure 2: Global Market Pricing Analysis
  • Figure 3: Global Market Value (USD Million) Forecast 2020 to 2035
  • Figure 4: Global Market Value Share and BPS Analysis by Product Type, 2025 and 2035
  • Figure 5: Global Market Y-o-Y Growth Comparison by Product Type, 2025 to 2035
  • Figure 6: Global Market Attractiveness Analysis by Product Type
  • Figure 7: Global Market Value Share and BPS Analysis by Animal Type, 2025 and 2035
  • Figure 8: Global Market Y-o-Y Growth Comparison by Animal Type, 2025 to 2035
  • Figure 9: Global Market Attractiveness Analysis by Animal Type
  • Figure 10: Global Market Value Share and BPS Analysis by Applications, 2025 and 2035
  • Figure 11: Global Market Y-o-Y Growth Comparison by Applications, 2025 to 2035
  • Figure 12: Global Market Attractiveness Analysis by Applications
  • Figure 13: Global Market Value Share and BPS Analysis by End User, 2025 and 2035
  • Figure 14: Global Market Y-o-Y Growth Comparison by End User, 2025 to 2035
  • Figure 15: Global Market Attractiveness Analysis by End User
  • Figure 16: Global Market Value (USD Million) Share and BPS Analysis by Region, 2025 and 2035
  • Figure 17: Global Market Y-o-Y Growth Comparison by Region, 2025 to 2035
  • Figure 18: Global Market Attractiveness Analysis by Region
  • Figure 19: North America Market Incremental $ Opportunity, 2025 to 2035
  • Figure 20: Latin America Market Incremental $ Opportunity, 2025 to 2035
  • Figure 21: Western Europe Market Incremental $ Opportunity, 2025 to 2035
  • Figure 22: Eastern Europe Market Incremental $ Opportunity, 2025 to 2035
  • Figure 23: East Asia Market Incremental $ Opportunity, 2025 to 2035
  • Figure 24: South Asia & Pacific Market Incremental $ Opportunity, 2025 to 2035
  • Figure 25: Middle East and Africa Market Incremental $ Opportunity, 2025 to 2035
  • Figure 26: North America Market Value Share and BPS Analysis by Country, 2025 and 2035
  • Figure 27: North America Market Value Share and BPS Analysis by Product Type, 2025 and 2035
  • Figure 28: North America Market Y-o-Y Growth Comparison by Product Type, 2025 to 2035
  • Figure 29: North America Market Attractiveness Analysis by Product Type
  • Figure 30: North America Market Value Share and BPS Analysis by Animal Type, 2025 and 2035
  • Figure 31: North America Market Y-o-Y Growth Comparison by Animal Type, 2025 to 2035
  • Figure 32: North America Market Attractiveness Analysis by Animal Type
  • Figure 33: North America Market Value Share and BPS Analysis by Applications, 2025 and 2035
  • Figure 34: North America Market Y-o-Y Growth Comparison by Applications, 2025 to 2035
  • Figure 35: North America Market Attractiveness Analysis by Applications
  • Figure 36: North America Market Value Share and BPS Analysis by End User, 2025 and 2035
  • Figure 37: North America Market Y-o-Y Growth Comparison by End User, 2025 to 2035
  • Figure 38: North America Market Attractiveness Analysis by End User
  • Figure 39: Latin America Market Value Share and BPS Analysis by Country, 2025 and 2035
  • Figure 40: Latin America Market Value Share and BPS Analysis by Product Type, 2025 and 2035
  • Figure 41: Latin America Market Y-o-Y Growth Comparison by Product Type, 2025 to 2035
  • Figure 42: Latin America Market Attractiveness Analysis by Product Type
  • Figure 43: Latin America Market Value Share and BPS Analysis by Animal Type, 2025 and 2035
  • Figure 44: Latin America Market Y-o-Y Growth Comparison by Animal Type, 2025 to 2035
  • Figure 45: Latin America Market Attractiveness Analysis by Animal Type
  • Figure 46: Latin America Market Value Share and BPS Analysis by Applications, 2025 and 2035
  • Figure 47: Latin America Market Y-o-Y Growth Comparison by Applications, 2025 to 2035
  • Figure 48: Latin America Market Attractiveness Analysis by Applications
  • Figure 49: Latin America Market Value Share and BPS Analysis by End User, 2025 and 2035
  • Figure 50: Latin America Market Y-o-Y Growth Comparison by End User, 2025 to 2035
  • Figure 51: Latin America Market Attractiveness Analysis by End User
  • Figure 52: Western Europe Market Value Share and BPS Analysis by Country, 2025 and 2035
  • Figure 53: Western Europe Market Value Share and BPS Analysis by Product Type, 2025 and 2035
  • Figure 54: Western Europe Market Y-o-Y Growth Comparison by Product Type, 2025 to 2035
  • Figure 55: Western Europe Market Attractiveness Analysis by Product Type
  • Figure 56: Western Europe Market Value Share and BPS Analysis by Animal Type, 2025 and 2035
  • Figure 57: Western Europe Market Y-o-Y Growth Comparison by Animal Type, 2025 to 2035
  • Figure 58: Western Europe Market Attractiveness Analysis by Animal Type
  • Figure 59: Western Europe Market Value Share and BPS Analysis by Applications, 2025 and 2035
  • Figure 60: Western Europe Market Y-o-Y Growth Comparison by Applications, 2025 to 2035
  • Figure 61: Western Europe Market Attractiveness Analysis by Applications
  • Figure 62: Western Europe Market Value Share and BPS Analysis by End User, 2025 and 2035
  • Figure 63: Western Europe Market Y-o-Y Growth Comparison by End User, 2025 to 2035
  • Figure 64: Western Europe Market Attractiveness Analysis by End User
  • Figure 65: Eastern Europe Market Value Share and BPS Analysis by Country, 2025 and 2035
  • Figure 66: Eastern Europe Market Value Share and BPS Analysis by Product Type, 2025 and 2035
  • Figure 67: Eastern Europe Market Y-o-Y Growth Comparison by Product Type, 2025 to 2035
  • Figure 68: Eastern Europe Market Attractiveness Analysis by Product Type
  • Figure 69: Eastern Europe Market Value Share and BPS Analysis by Animal Type, 2025 and 2035
  • Figure 70: Eastern Europe Market Y-o-Y Growth Comparison by Animal Type, 2025 to 2035
  • Figure 71: Eastern Europe Market Attractiveness Analysis by Animal Type
  • Figure 72: Eastern Europe Market Value Share and BPS Analysis by Applications, 2025 and 2035
  • Figure 73: Eastern Europe Market Y-o-Y Growth Comparison by Applications, 2025 to 2035
  • Figure 74: Eastern Europe Market Attractiveness Analysis by Applications
  • Figure 75: Eastern Europe Market Value Share and BPS Analysis by End User, 2025 and 2035
  • Figure 76: Eastern Europe Market Y-o-Y Growth Comparison by End User, 2025 to 2035
  • Figure 77: Eastern Europe Market Attractiveness Analysis by End User
  • Figure 78: East Asia Market Value Share and BPS Analysis by Country, 2025 and 2035
  • Figure 79: East Asia Market Value Share and BPS Analysis by Product Type, 2025 and 2035
  • Figure 80: East Asia Market Y-o-Y Growth Comparison by Product Type, 2025 to 2035
  • Figure 81: East Asia Market Attractiveness Analysis by Product Type
  • Figure 82: East Asia Market Value Share and BPS Analysis by Animal Type, 2025 and 2035
  • Figure 83: East Asia Market Y-o-Y Growth Comparison by Animal Type, 2025 to 2035
  • Figure 84: East Asia Market Attractiveness Analysis by Animal Type
  • Figure 85: East Asia Market Value Share and BPS Analysis by Applications, 2025 and 2035
  • Figure 86: East Asia Market Y-o-Y Growth Comparison by Applications, 2025 to 2035
  • Figure 87: East Asia Market Attractiveness Analysis by Applications
  • Figure 88: East Asia Market Value Share and BPS Analysis by End User, 2025 and 2035
  • Figure 89: East Asia Market Y-o-Y Growth Comparison by End User, 2025 to 2035
  • Figure 90: East Asia Market Attractiveness Analysis by End User
  • Figure 91: South Asia & Pacific Market Value Share and BPS Analysis by Country, 2025 and 2035
  • Figure 92: South Asia & Pacific Market Value Share and BPS Analysis by Product Type, 2025 and 2035
  • Figure 93: South Asia & Pacific Market Y-o-Y Growth Comparison by Product Type, 2025 to 2035
  • Figure 94: South Asia & Pacific Market Attractiveness Analysis by Product Type
  • Figure 95: South Asia & Pacific Market Value Share and BPS Analysis by Animal Type, 2025 and 2035
  • Figure 96: South Asia & Pacific Market Y-o-Y Growth Comparison by Animal Type, 2025 to 2035
  • Figure 97: South Asia & Pacific Market Attractiveness Analysis by Animal Type
  • Figure 98: South Asia & Pacific Market Value Share and BPS Analysis by Applications, 2025 and 2035
  • Figure 99: South Asia & Pacific Market Y-o-Y Growth Comparison by Applications, 2025 to 2035
  • Figure 100: South Asia & Pacific Market Attractiveness Analysis by Applications
  • Figure 101: South Asia & Pacific Market Value Share and BPS Analysis by End User, 2025 and 2035
  • Figure 102: South Asia & Pacific Market Y-o-Y Growth Comparison by End User, 2025 to 2035
  • Figure 103: South Asia & Pacific Market Attractiveness Analysis by End User
  • Figure 104: Middle East and Africa Market Value Share and BPS Analysis by Country, 2025 and 2035
  • Figure 105: Middle East and Africa Market Value Share and BPS Analysis by Product Type, 2025 and 2035
  • Figure 106: Middle East and Africa Market Y-o-Y Growth Comparison by Product Type, 2025 to 2035
  • Figure 107: Middle East and Africa Market Attractiveness Analysis by Product Type
  • Figure 108: Middle East and Africa Market Value Share and BPS Analysis by Animal Type, 2025 and 2035
  • Figure 109: Middle East and Africa Market Y-o-Y Growth Comparison by Animal Type, 2025 to 2035
  • Figure 110: Middle East and Africa Market Attractiveness Analysis by Animal Type
  • Figure 111: Middle East and Africa Market Value Share and BPS Analysis by Applications, 2025 and 2035
  • Figure 112: Middle East and Africa Market Y-o-Y Growth Comparison by Applications, 2025 to 2035
  • Figure 113: Middle East and Africa Market Attractiveness Analysis by Applications
  • Figure 114: Middle East and Africa Market Value Share and BPS Analysis by End User, 2025 and 2035
  • Figure 115: Middle East and Africa Market Y-o-Y Growth Comparison by End User, 2025 to 2035
  • Figure 116: Middle East and Africa Market Attractiveness Analysis by End User
  • Figure 117: Global Market - Tier Structure Analysis
  • Figure 118: Global Market - Company Share Analysis

Frequently Asked Questions

What is the size of the pet antibody testing market in 2025?

The projected industry size in 2025 is USD 534.7 million.

What is the projected value of the pet antibody testing market in 2035 and its CAGR?

The forecasted industry value in 2035 is projected to reach USD 879.3 million, with a CAGR of 5.1%.

What is the leading segment in the pet antibody testing market?

Companion animals capture the majority of the animal type segment in the industry with an 86% industry share.

Which country will lead the pet antibody testing market?

India will lead the industry with an 8.9% CAGR from 2025 to 2035.

Who is the leading company in the pet antibody testing market?

IDEXX Laboratories, Inc. is the leading company in the industry with a 30% industry share.

Explore Similar Insights

Future Market Insights

Pet Antibody Testing Market