Pet Probiotics Supplements Market Outlook and Forecast 2025 to 2035 

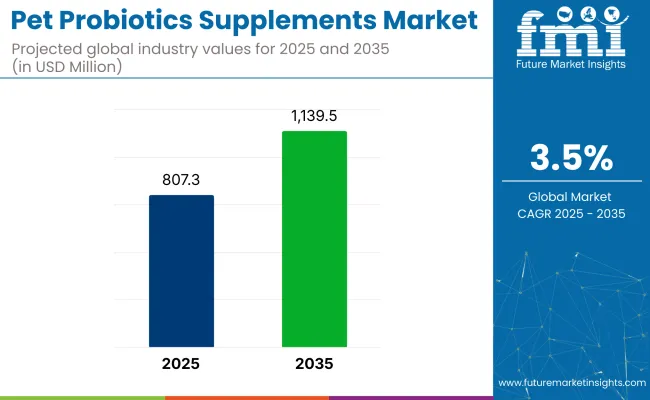
The global pet probiotics supplements market is valued at USD 807.3 million in 2025 and is slated to reach USD 1,139.5 million by 2035, reflecting a CAGR of 3.5%. Growth is being driven by increasing pet ownership, rising health consciousness among pet parents, and continuous product innovations by market leaders. Additionally, the expansion of premium pet food and supplement portfolios, particularly those infused with functional probiotic strains, is contributing to the market’s expansion.
Quick Stats Of Pet Probiotics Supplements Market

  • Market Value (2025): USD 807.3 million
  • Forecast Value (2035): USD 1,139.5 million
  • Forecast CAGR: 3.5%
  • Species Segment Leader in 2025: Dogs (65% Market Share)
  • Top Sales Channel Segment: Offline Sales (58% Market Share in 2025)
  • Key Growth Region: Europe (UK is the fastest-growing market with 7.5% CAGR)

Pet Probiotics Supplements

Metric Value
Market Value (2025) USD 807.3 million
Market Value (2035) USD 1,139.5 million
CAGR (2025 to 2035) 3.5%

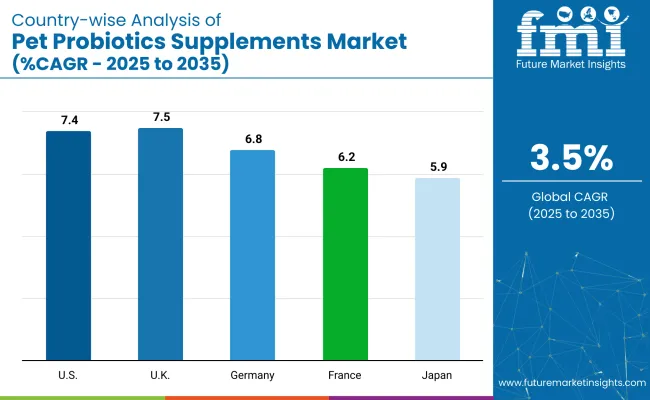
The UK records the highest CAGR of 7.5% from 2025 to 2035, driven by rising demand for premium supplement adoption. USA follows with a CAGR of 7.4%, supported by increasing premium pet supplement adoption, while Germany grows at 6.8% CAGR, driven by increasing awareness of pet health and nutrition.

Dogs lead the species segment with a dominant 65% market share, driven by high supplement consumption and targeted formulations. Additionally, the offline sales channel leads sales channel with a 58% market share, supported by the convenience of e-commerce platforms and growing direct-to-consumer subscription models for pet probiotics supplements.

Governments enforce strict regulations to ensure the safety and quality of pet probiotics supplements, with the US FDA and EFSA requiring clear labeling of strains and CFU counts. Companies are adopting advanced microencapsulation techniques to improve probiotic stability and effectiveness.

Manufacturers develop soil-based strains like Bacillus for better viability in dry forms. Brands launch multi-functional products combining probiotics with prebiotics, enzymes, and vitamins. Precision fermentation is used to produce targeted strains with higher CFU counts and longer shelf life, driving market innovation.

The market accounts for a small yet growing share within its parent markets. It holds approximately 2-3% of the overall pet care market and around 4-5% of the pet nutrition market. Within the broader pet food market, its share remains close to 1-2%, as mainstream pet food dominates overall revenues.

In the animal health supplements market, pet probiotics contribute about 6-8% due to their rising popularity for digestive and immunity benefits. Compared to the animal feed additives market, the share is marginal, less than 1%, since that market is driven mainly by livestock feed additives rather than pet supplements.

Pet Probiotics Supplements Market by Top Investment Segments

The pet probiotics supplements market is segmented by form, species, claim, functionality, sales channel, and region. By form, the market includes powder, soft chews, capsules, and liquid. Based on species, it is segmented into dogs, cats, birds, and reptiles.

By claim, the market is categorized into no artificial additives, no artificial flavours, no artificial preservatives, non-GMO, allergen-free, 100% vegan, grain-free, soil-based, and all-natural. Based on functionalities, the market includes gut health, immunity booster, allergy support, digestive health, coat quality, and itching skin.

By sales channel, it is segmented into online (company website, ecommerce, third party websites) and offline (distributors, supermarkets, pet food shops, veterinary clinics). Regionally, the market is segmented into North America, Latin America, Western Europe, Eastern Europe, Balkans & Baltic, Russia & Belarus, Central Asia, East Asia, South Asia & Pacific, and the Middle East & Africa.

Soft Chews to Lead the Form Segment with 27% Market Share in 2025

Soft chews hold a 27% market share in 2025, making them the most lucrative segment under form.

  • Their popularity comes from high palatability, treat-like texture, and ease of administration.
  • Pet owners choose soft chews because pets consume them willingly without resistance, ensuring consistent probiotic intake.

Dogs to Lead the Species Segment with 65% Market Share in 2025

Dogs remain the most lucrative species segment, holding a 65% market share in 2025.
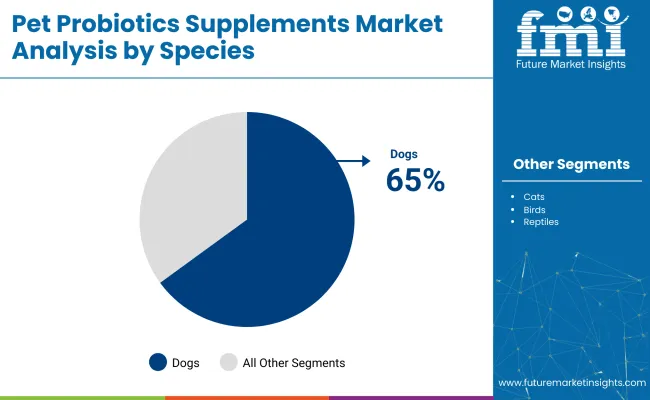
  • Cats account for a smaller share as probiotic adoption for feline health is still emerging, while birds and reptiles hold minimal shares due to limited specialized formulations and lower pet ownership rates.
  • Companies are focusing on expanding dog probiotics portfolios with breed-specific and age-focused formulations to strengthen market presence and cater to growing health-conscious dog owner demands globally.

Pet Probiotics Supplements By Spieces

All-Natural to Lead the Claim Segment with 22% Market Share in 2025

The all-natural claim emerges as the most lucrative segment, holding a 22% market share in 2025.

  • Non-GMO and grain-free claims also attract significant demand due to increasing awareness of allergies and digestive sensitivities in pets.
  • Companies are leveraging these claims in branding to strengthen market trust, differentiate products, and cater to health-conscious pet owners seeking premium probiotic solutions.

Gut Health to Lead the Functionalities Segment with 19.5% Market Share in 2025

Gut health remains the most lucrative functionality segment, holding a 19.5% market share in 2025.

  • Digestive health and immunity booster segments also see growing demand as pet owners prioritize preventive care to reduce illness and medication reliance.
  • Allergy support, coat quality, and itching skin functionalities cater to niche health concerns but hold smaller shares.

Offline to Lead the Sales Channel Segment with 58% Market Share in 2025

Offline sales channels account for 58% of the total pet probiotics supplements market share in 2025.
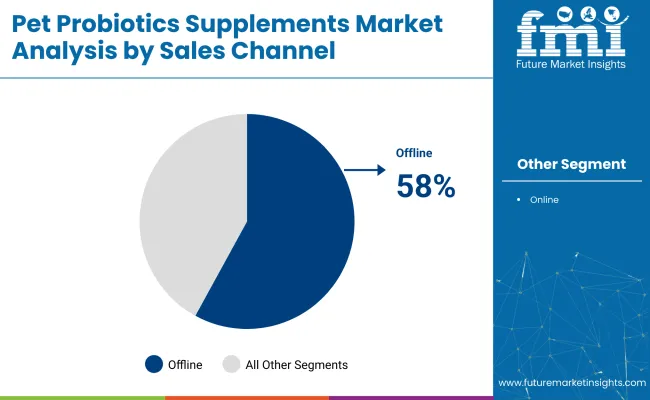
  • Veterinary clinics play a major role within offline sales, as pet owners rely on professional advice for selecting effective probiotic supplements for digestive and immune health.
  • Pet food shops further strengthen offline sales by offering specialized products and personalized buying experiences.

Pet Probiotics Supplements Sales Channel

Top Pet Probiotics Supplements Market Dynamics

The global pet probiotics supplements market is growing steadily, driven by increasing pet ownership, rising awareness of pet digestive and immune health, and advancements in probiotic strain development and functional supplement formulations.

Recent Trends in the Pet Probiotics Supplements Market
  • Companies are launching multi-functional probiotic supplements combining prebiotics, enzymes, and vitamins.
  • Brands are introducing breed-specific and age-targeted probiotic formulations for dogs and cats.
  • E-commerce platforms are expanding probiotic product portfolios with subscription-based models.
  • Clean-label, all-natural, and non-GMO claims are gaining strong traction among health-conscious pet owners.

Key Challenges in the Pet Probiotics Supplements Market

  • High production costs of premium probiotic strains limit affordability for mass markets.
  • Limited clinical studies for species-specific efficacy hinder wider veterinarian endorsements.
  • Palatability issues in powders and capsules reduce acceptance among picky pets.
  • Intense competition from established players makes market penetration difficult for new entrants.

Analyzing Top Countries Producing and Supplying Pet Probiotics Supplements

Pet Probiotics Supplements Country Wise

Among the top countries, the USA leads with the CAGR of 7.4% from 2025 to 2035, driven by strong demand for digestive and immune health supplements. The UK closely follows with the highest CAGR of 7.5%, supported by premium product adoption and pet humanization trends.

Germany grows at 6.8%, driven by increasing pet health awareness. France records a CAGR of 6.2%, supported by the probiotic powders and chews demand. Japan shows moderate growth with a CAGR of 5.9%, driven by targeted probiotics for small-breed dogs and urban pet owners.

The report covers in-depth analysis of 40+ countries; five top-performing OECD countries are highlighted below.

USA Pet Probiotics Supplements Market Analysis

The USA pet probiotics supplements market is projected to grow at a CAGR of 7.4% from 2025 to 2035, driven by its large pet population and strong focus on pet digestive and immune health.

  • High demand for multi-functional probiotics targeting gut health.
  • Veterinary endorsements boost consumer trust and adoption.
  • Nestle Purina leads distribution and product innovation.
  • Microencapsulation technology improves strain viability and shelf life.

Pet Probiotics Supplements Demand Analysis in the UK

The UK pet probiotics supplements revenue is projected to grow at a CAGR of 7.5% between 2025 and 2035, supported by rising premium supplement adoption and pet humanization trends.

  • Strong demand for grain-free probiotic chews for dogs and cats.
  • Veterinary clinics recommend probiotics for preventive health.
  • Nutramax and Bacterfield lead market innovation and trust.
  • Online retail channels record significant growth in sales.
  • Urban consumers prioritize premium soft chew formulations.

Germany Pet Probiotics Supplements Market Analysis

Sales of pet probiotics supplements in Germany are expected to grow at a CAGR of 6.8% from 2025 to 2035, driven by increasing awareness of pet health and nutrition.

  • Demand increases for probiotics with digestive enzymes and prebiotics.
  • Strict regulatory standards ensure product quality and safety.
  • Offline retail remains significant alongside rising online adoption.
  • Companies invest in R&D for advanced probiotic strain development.

Pet Probiotics Supplements Demand Analysis in France

Sales of pet probiotics supplements in France are expected to grow at a CAGR of 6.2% from 2025 to 2035, supported by the rising popularity of probiotic powders and chews.

  • Multi-functional probiotic claims attract health-conscious pet owners.
  • Allergen-free and clean-label products remain highly preferred.
  • Veterinary endorsements improve market credibility and sales.
  • Online platforms expand product accessibility to wider regions.

Japan Pet Probiotics Supplements Market Analysis

Japan pet probiotics supplements revenue is projected to grow at a CAGR of 5.9% between 2025 and 2035, driven by rising urban pet ownership and awareness of digestive health.

  • Gut health-focused probiotics dominate consumer preferences.
  • Leading brands invest in proprietary strain innovations.
  • Premium soft chews gain traction among urban pet owners.
  • Grain-free and clean-label claims influence purchase decisions.

Leading Pet Probiotics Supplements Manufacturers and Suppliers 

The pet probiotics supplements market is relatively fragmented, with a mix of global giants and strong regional players competing across segments. Top companies focus on innovation, partnerships, and product diversification to strengthen their positions, while smaller brands target niche categories and local markets.

Chr. Hansen, Nestle Purina, and ADM Protexin dominate the market through investments in probiotic strain development, advanced manufacturing technologies, and strategic acquisitions. Chr. Hansen focuses on natural probiotic solutions tailored for age-specific pet needs, while Nestle Purina leads with strong distribution networks and R&D-backed formulations targeting digestive and immune health.

  • In April 2024, General Mills acquired Edgard & Cooper, a leading European premium pet food brand, to expand its pet food portfolio and strengthen its presence in the European market.
  • In January 2024, Chr. Hansen merged with Novozymes to form Novonesis, creating a global biosolutions leader with expertise spanning over 30 industries.

Pet Probiotics Supplements Market Report Scope

Report Attributes Details
Current Total Market Size (2025) USD 807.3 million
Projected Market Size (2035) USD 1,139.5 million
CAGR (2025 to 2035) 3.5%
Base Year for Estimation 2024
Historical Period 2020 to 2024
Projections Period 2025 to 2035
Market Analysis Parameters Revenue in USD million /Volume ( Metric Tons)
By Form Powder, Soft Chews, Capsules, and Liquid
By Species Dogs, Cats, Birds, and Reptiles
By Claim No Artificial Additives, No Artificial Flavours, No Artificial Preservatives, Non-GMO, Allergen Free, 100% Vegan, Grain Free, Soil Based, and All Natural
By Functionalities Gut Health, Immunity Booster, Allergy Support, Digestive Health, Coat Quality, and Itch ing Skin
By Sales Channel Online (Company Website, E-commerce, and Third Party Websites), Offline (Distributor, Supermarket, Pet Food Shops, Veterinary Clinics)
Regions Covered North America, Latin America, Western Europe, Eastern Europe, East Asia, South Asia & Pacific, Middle East & Africa
Countries Covered United States, Canada, United Kingdom, Germany, France, China, Japan, South Korea, Brazil, Australia
Key Players Chr. Hansen, Nestle Purina, ADM Protexin, Bacterfield, Unique Biotech, Nutramax, Mars Petcare Inc., NaturVet, Canine India, Pet360, Probioway, Vital Planet
Additional Attributes Dollar sales by value, market share analysis by region, and country-wise analysis

Top Segments Studied in the Pet Probiotics Supplements Market Report

By Form:

As per form, the industry has been categorized into Powders, Soft Chews, Capsules and Liquid.

By Species:

As per species, the industry has been categorized into Dogs, Cats, Birds and Reptiles.

By Claim:

Based on product claims, the industry has been categorized into No Artificial Additives, No Artificial Flavours, No Artificial Preservatives, Non-GMO, Allergen Free, 100% Vegan, Grain Free, Soil Based and All Natural.

By Functionalities:

As per product functionalities, the industry has been categorized into Gut Health, Immunity Booster, Allergy Support, Digestive Health, Coat Quality and Itching Skin.

By Sales Channel:

This segment is further categorized into Online (Company Website, Ecommerce and Third Party Websites) and Offline (Distributor, Supermarket, Pet Food Shops and Veterinary Clinics).

By Region:

Industry analysis has been carried out by Regions which is segmented into North America, Latin America, Europe, East Asia, South Asia, Oceania, and the Middle East & Africa.

Table of Content

  1. Executive Summary
    • Global Market Outlook
    • Demand-side Trends
    • Supply-side Trends
    • Technology Roadmap Analysis
    • Analysis and Recommendations
  2. Market Overview
    • Market Coverage / Taxonomy
    • Market Definition / Scope / Limitations
  3. Market Background
    • Market Dynamics
      • Drivers
      • Restraints
      • Opportunity
      • Trends
    • Scenario Forecast
      • Demand in Optimistic Scenario
      • Demand in Likely Scenario
      • Demand in Conservative Scenario
    • Opportunity Map Analysis
    • Product Life Cycle Analysis
    • Supply Chain Analysis
      • Supply Side Participants and their Roles
        • Producers
        • Mid-Level Participants (Traders/ Agents/ Brokers)
        • Wholesalers and Distributors
      • Value Added and Value Created at Node in the Supply Chain
      • List of Raw Material Suppliers
      • List of Existing and Potential Buyer’s
    • Investment Feasibility Matrix
    • Value Chain Analysis
      • Profit Margin Analysis
      • Wholesalers and Distributors
      • Retailers
    • PESTLE and Porter’s Analysis
    • Regulatory Landscape
      • By Key Regions
      • By Key Countries
    • Regional Parent Market Outlook
    • Production and Consumption Statistics
    • Import and Export Statistics
  4. Global Market Analysis 2020 to 2024 and Forecast, 2025 to 2035
    • Historical Market Size Value (USD Million) & Volume (Metric Tons) Analysis, 2020 to 2024
    • Current and Future Market Size Value (USD Million) & Volume (Metric Tons) Projections, 2025 to 2035
      • Y-o-Y Growth Trend Analysis
      • Absolute $ Opportunity Analysis
  5. Global Market Pricing Analysis 2020 to 2024 and Forecast 2025 to 2035
  6. Global Market Analysis 2020 to 2024 and Forecast 2025 to 2035, By Form
    • Introduction / Key Findings
    • Historical Market Size Value (USD Million) & Volume (Metric Tons) Analysis By Form, 2020 to 2024
    • Current and Future Market Size Value (USD Million) & Volume (Metric Tons) Analysis and Forecast By Form, 2025 to 2035
      • Powder
      • Soft Chews
      • Capsules
      • Liquid
    • Y-o-Y Growth Trend Analysis By Form, 2020 to 2024
    • Absolute $ Opportunity Analysis By Form, 2025 to 2035
  7. Global Market Analysis 2020 to 2024 and Forecast 2025 to 2035, By Species
    • Introduction / Key Findings
    • Historical Market Size Value (USD Million) & Volume (Metric Tons) Analysis By Species, 2020 to 2024
    • Current and Future Market Size Value (USD Million) & Volume (Metric Tons) Analysis and Forecast By Species, 2025 to 2035
      • Dogs
      • Cats
      • Birds
      • Reptiles
    • Y-o-Y Growth Trend Analysis By Species, 2020 to 2024
    • Absolute $ Opportunity Analysis By Species, 2025 to 2035
  8. Global Market Analysis 2020 to 2024 and Forecast 2025 to 2035, By Claim
    • Introduction / Key Findings
    • Historical Market Size Value (USD Million) & Volume (Metric Tons) Analysis By Claim, 2020 to 2024
    • Current and Future Market Size Value (USD Million) & Volume (Metric Tons) Analysis and Forecast By Claim, 2025 to 2035
      • No Artificial Additives
      • No Artificial Flavours
      • No Artificial Preservatives
      • Non GMO
      • Allergen Free
      • 100% Vegan
      • Grain Free
      • Soil Based
      • All Natural
    • Y-o-Y Growth Trend Analysis By Claim, 2020 to 2024
    • Absolute $ Opportunity Analysis By Claim, 2025 to 2035
  9. Global Market Analysis 2020 to 2024 and Forecast 2025 to 2035, By Functionalities
    • Introduction / Key Findings
    • Historical Market Size Value (USD Million) & Volume (Metric Tons) Analysis By Functionalities, 2020 to 2024
    • Current and Future Market Size Value (USD Million) & Volume (Metric Tons) Analysis and Forecast By Functionalities, 2025 to 2035
      • Gut Health
      • Immunity Booster
      • Allergy Support
      • Digestive Health
      • Coat Quality
      • Itching Skin
    • Y-o-Y Growth Trend Analysis By Functionalities, 2020 to 2024
    • Absolute $ Opportunity Analysis By Functionalities, 2025 to 2035
  10. Global Market Analysis 2020 to 2024 and Forecast 2025 to 2035, By Sales Channel
    • Introduction / Key Findings
    • Historical Market Size Value (USD Million) & Volume (Metric Tons) Analysis By Sales Channel, 2020 to 2024
    • Current and Future Market Size Value (USD Million) & Volume (Metric Tons) Analysis and Forecast By Sales Channel, 2025 to 2035
      • Online
        • Company Website
        • Ecommerce
        • Third Party Websites
      • Offline
        • Distributor
        • Supermarket
        • Pet Food Shops
        • Veterinary Clinics
    • Y-o-Y Growth Trend Analysis By Sales Channel, 2020 to 2024
    • Absolute $ Opportunity Analysis By Sales Channel, 2025 to 2035
  11. Global Market Analysis 2020 to 2024 and Forecast 2025 to 2035, By Region
    • Introduction
    • Historical Market Size Value (USD Million) & Volume (Metric Tons) Analysis By Region, 2020 to 2024
    • Current Market Size Value (USD Million) & Volume (Metric Tons) Analysis and Forecast By Region, 2025 to 2035
      • USA
      • Latin America
      • Western Europe
      • Eastern Europe
      • East Asia
      • South Asia & Pacific
      • Middle East and Africa
    • Market Attractiveness Analysis By Region
  12. USA Market Analysis 2020 to 2024 and Forecast 2025 to 2035, By Country
    • Historical Market Size Value (USD Million) & Volume (Metric Tons) Trend Analysis By Market Taxonomy, 2020 to 2024
    • Market Size Value (USD Million) & Volume (Metric Tons) Forecast By Market Taxonomy, 2025 to 2035
      • By Country
        • Canada
        • Brazil
        • Mexico
        • Argentina
      • By Form
      • By Species
      • By Claim
      • By Functionalities
      • By Sales Channel
    • Market Attractiveness Analysis
      • By Country
      • By Form
      • By Species
      • By Claim
      • By Functionalities
      • By Sales Channel
    • Key Takeaways
  13. Latin America Market Analysis 2020 to 2024 and Forecast 2025 to 2035, By Country
    • Historical Market Size Value (USD Million) & Volume (Metric Tons) Trend Analysis By Market Taxonomy, 2020 to 2024
    • Market Size Value (USD Million) & Volume (Metric Tons) Forecast By Market Taxonomy, 2025 to 2035
      • By Country
        • Brazil
        • Argentina
        • Rest of LATAM
      • By Form
      • By Species
      • By Claim
      • By Functionalities
      • By Sales Channel
    • Market Attractiveness Analysis
      • By Country
      • By Form
      • By Species
      • By Claim
      • By Functionalities
      • By Sales Channel
    • Key Takeaways
  14. Western Europe Market Analysis 2020 to 2024 and Forecast 2025 to 2035, By Country
    • Historical Market Size Value (USD Million) & Volume (Metric Tons) Trend Analysis By Market Taxonomy, 2020 to 2024
    • Market Size Value (USD Million) & Volume (Metric Tons) Forecast By Market Taxonomy, 2025 to 2035
      • By Country
        • Germany
        • Italy
        • France
        • UK
        • Spain
        • BENELUX
        • Nordic
        • Rest of W.Europe
      • By Form
      • By Species
      • By Claim
      • By Functionalities
      • By Sales Channel
    • Market Attractiveness Analysis
      • By Country
      • By Form
      • By Species
      • By Claim
      • By Functionalities
      • By Sales Channel
    • Key Takeaways
  15. Eastern Europe Market Analysis 2020 to 2024 and Forecast 2025 to 2035, By Country
    • Historical Market Size Value (USD Million) & Volume (Metric Tons) Trend Analysis By Market Taxonomy, 2020 to 2024
    • Market Size Value (USD Million) & Volume (Metric Tons) Forecast By Market Taxonomy, 2025 to 2035
      • By Country
        • Russia
        • Hungary
        • Poland
        • Balkan & Baltics
        • Rest of E. Europe
      • By Form
      • By Species
      • By Claim
      • By Functionalities
      • By Sales Channel
    • Market Attractiveness Analysis
      • By Country
      • By Form
      • By Species
      • By Claim
      • By Functionalities
      • By Sales Channel
    • Key Takeaways
  16. East Asia Market Analysis 2020 to 2024 and Forecast 2025 to 2035, By Country
    • Historical Market Size Value (USD Million) & Volume (Metric Tons) Trend Analysis By Market Taxonomy, 2020 to 2024
    • Market Size Value (USD Million) & Volume (Metric Tons) Forecast By Market Taxonomy, 2025 to 2035
      • By Country
        • China
        • Japan
        • South Korea
      • By Form
      • By Species
      • By Claim
      • By Functionalities
      • By Sales Channel
    • Market Attractiveness Analysis
      • By Country
      • By Form
      • By Species
      • By Claim
      • By Functionalities
      • By Sales Channel
    • Key Takeaways
  17. South Asia & Pacific Market Analysis 2020 to 2024 and Forecast 2025 to 2035, By Country
    • Historical Market Size Value (USD Million) & Volume (Metric Tons) Trend Analysis By Market Taxonomy, 2020 to 2024
    • Market Size Value (USD Million) & Volume (Metric Tons) Forecast By Market Taxonomy, 2025 to 2035
      • By Country
        • India
        • Australia & New Zealand
        • ASEAN
        • Rest of SAP
      • By Form
      • By Species
      • By Claim
      • By Functionalities
      • By Sales Channel
    • Market Attractiveness Analysis
      • By Country
      • By Form
      • By Species
      • By Claim
      • By Functionalities
      • By Sales Channel
    • Key Takeaways
  18. Middle East and Africa Market Analysis 2020 to 2024 and Forecast 2025 to 2035, By Country
    • Historical Market Size Value (USD Million) & Volume (Metric Tons) Trend Analysis By Market Taxonomy, 2020 to 2024
    • Market Size Value (USD Million) & Volume (Metric Tons) Forecast By Market Taxonomy, 2025 to 2035
      • By Country
        • GCC Countries
        • Northern Africa
        • South Africa
        • Turkiye
        • Rest of MEA
      • By Form
      • By Species
      • By Claim
      • By Functionalities
      • By Sales Channel
    • Market Attractiveness Analysis
      • By Country
      • By Form
      • By Species
      • By Claim
      • By Functionalities
      • By Sales Channel
    • Key Takeaways
  19. Key Countries Market Analysis
    • USA
      • Pricing Analysis
      • Market Share Analysis, 2024
        • By Form
        • By Species
        • By Claim
        • By Functionalities
        • By Sales Channel
    • Canada
      • Pricing Analysis
      • Market Share Analysis, 2024
        • By Form
        • By Species
        • By Claim
        • By Functionalities
        • By Sales Channel
    • Brazil
      • Pricing Analysis
      • Market Share Analysis, 2024
        • By Form
        • By Species
        • By Claim
        • By Functionalities
        • By Sales Channel
    • Mexico
      • Pricing Analysis
      • Market Share Analysis, 2024
        • By Form
        • By Species
        • By Claim
        • By Functionalities
        • By Sales Channel
    • Argentina
      • Pricing Analysis
      • Market Share Analysis, 2024
        • By Form
        • By Species
        • By Claim
        • By Functionalities
        • By Sales Channel
  20. Market Structure Analysis
    • Competition Dashboard
    • Competition Benchmarking
    • Market Share Analysis of Top Players
      • By Regional
      • By Form
      • By Species
      • By Claim
      • By Functionalities
      • By Sales Channel
  21. Competition Analysis
    • Competition Deep Dive
      • Chr. Hansen
        • Overview
        • Product Portfolio
        • Profitability by Market Segments (Product/Age /Sales Channel/Region)
        • Sales Footprint
        • Strategy Overview
          • Marketing Strategy
          • Product Strategy
          • Channel Strategy
      • Nestle Purina
        • Overview
        • Product Portfolio
        • Profitability by Market Segments (Product/Age /Sales Channel/Region)
        • Sales Footprint
        • Strategy Overview
          • Marketing Strategy
          • Product Strategy
          • Channel Strategy
      • ADM Protexin
        • Overview
        • Product Portfolio
        • Profitability by Market Segments (Product/Age /Sales Channel/Region)
        • Sales Footprint
        • Strategy Overview
          • Marketing Strategy
          • Product Strategy
          • Channel Strategy
      • Bacterfiled
        • Overview
        • Product Portfolio
        • Profitability by Market Segments (Product/Age /Sales Channel/Region)
        • Sales Footprint
        • Strategy Overview
          • Marketing Strategy
          • Product Strategy
          • Channel Strategy
      • Unique Biotech
        • Overview
        • Product Portfolio
        • Profitability by Market Segments (Product/Age /Sales Channel/Region)
        • Sales Footprint
        • Strategy Overview
          • Marketing Strategy
          • Product Strategy
          • Channel Strategy
      • Nutramax
        • Overview
        • Product Portfolio
        • Profitability by Market Segments (Product/Age /Sales Channel/Region)
        • Sales Footprint
        • Strategy Overview
          • Marketing Strategy
          • Product Strategy
          • Channel Strategy
      • Mars Petcare Inc
        • Overview
        • Product Portfolio
        • Profitability by Market Segments (Product/Age /Sales Channel/Region)
        • Sales Footprint
        • Strategy Overview
          • Marketing Strategy
          • Product Strategy
          • Channel Strategy
      • NaturVet
        • Overview
        • Product Portfolio
        • Profitability by Market Segments (Product/Age /Sales Channel/Region)
        • Sales Footprint
        • Strategy Overview
          • Marketing Strategy
          • Product Strategy
          • Channel Strategy
      • Canine India
        • Overview
        • Product Portfolio
        • Profitability by Market Segments (Product/Age /Sales Channel/Region)
        • Sales Footprint
        • Strategy Overview
          • Marketing Strategy
          • Product Strategy
          • Channel Strategy
      • Pet360
        • Overview
        • Product Portfolio
        • Profitability by Market Segments (Product/Age /Sales Channel/Region)
        • Sales Footprint
        • Strategy Overview
          • Marketing Strategy
          • Product Strategy
          • Channel Strategy
      • Probioway
        • Overview
        • Product Portfolio
        • Profitability by Market Segments (Product/Age /Sales Channel/Region)
        • Sales Footprint
        • Strategy Overview
          • Marketing Strategy
          • Product Strategy
          • Channel Strategy
      • Vital Planet
        • Overview
        • Product Portfolio
        • Profitability by Market Segments (Product/Age /Sales Channel/Region)
        • Sales Footprint
        • Strategy Overview
          • Marketing Strategy
          • Product Strategy
          • Channel Strategy
      • Others
        • Overview
        • Product Portfolio
        • Profitability by Market Segments (Product/Age /Sales Channel/Region)
        • Sales Footprint
        • Strategy Overview
          • Marketing Strategy
          • Product Strategy
          • Channel Strategy
  22. Assumptions & Acronyms Used
  23. Research Methodology

List of Tables

  • Table 1: Global Market Value (USD Million) Forecast by Region, 2020 to 2035
  • Table 2: Global Market Volume (Metric Tons) Forecast by Region, 2020 to 2035
  • Table 3: Global Market Value (USD Million) Forecast by Form, 2020 to 2035
  • Table 4: Global Market Volume (Metric Tons) Forecast by Form, 2020 to 2035
  • Table 5: Global Market Value (USD Million) Forecast by Species, 2020 to 2035
  • Table 6: Global Market Volume (Metric Tons) Forecast by Species, 2020 to 2035
  • Table 7: Global Market Value (USD Million) Forecast by Claim, 2020 to 2035
  • Table 8: Global Market Volume (Metric Tons) Forecast by Claim, 2020 to 2035
  • Table 9: Global Market Value (USD Million) Forecast by Functionalities, 2020 to 2035
  • Table 10: Global Market Volume (Metric Tons) Forecast by Functionalities, 2020 to 2035
  • Table 11: Global Market Value (USD Million) Forecast by Sales Channel, 2020 to 2035
  • Table 12: Global Market Volume (Metric Tons) Forecast by Sales Channel, 2020 to 2035
  • Table 13: USA Market Value (USD Million) Forecast by Country, 2020 to 2035
  • Table 14: USA Market Volume (Metric Tons) Forecast by Country, 2020 to 2035
  • Table 15: USA Market Value (USD Million) Forecast by Form, 2020 to 2035
  • Table 16: USA Market Volume (Metric Tons) Forecast by Form, 2020 to 2035
  • Table 17: USA Market Value (USD Million) Forecast by Species, 2020 to 2035
  • Table 18: USA Market Volume (Metric Tons) Forecast by Species, 2020 to 2035
  • Table 19: USA Market Value (USD Million) Forecast by Claim, 2020 to 2035
  • Table 20: USA Market Volume (Metric Tons) Forecast by Claim, 2020 to 2035
  • Table 21: USA Market Value (USD Million) Forecast by Functionalities, 2020 to 2035
  • Table 22: USA Market Volume (Metric Tons) Forecast by Functionalities, 2020 to 2035
  • Table 23: USA Market Value (USD Million) Forecast by Sales Channel, 2020 to 2035
  • Table 24: USA Market Volume (Metric Tons) Forecast by Sales Channel, 2020 to 2035
  • Table 25: Latin America Market Value (USD Million) Forecast by Country, 2020 to 2035
  • Table 26: Latin America Market Volume (Metric Tons) Forecast by Country, 2020 to 2035
  • Table 27: Latin America Market Value (USD Million) Forecast by Form, 2020 to 2035
  • Table 28: Latin America Market Volume (Metric Tons) Forecast by Form, 2020 to 2035
  • Table 29: Latin America Market Value (USD Million) Forecast by Species, 2020 to 2035
  • Table 30: Latin America Market Volume (Metric Tons) Forecast by Species, 2020 to 2035
  • Table 31: Latin America Market Value (USD Million) Forecast by Claim, 2020 to 2035
  • Table 32: Latin America Market Volume (Metric Tons) Forecast by Claim, 2020 to 2035
  • Table 33: Latin America Market Value (USD Million) Forecast by Functionalities, 2020 to 2035
  • Table 34: Latin America Market Volume (Metric Tons) Forecast by Functionalities, 2020 to 2035
  • Table 35: Latin America Market Value (USD Million) Forecast by Sales Channel, 2020 to 2035
  • Table 36: Latin America Market Volume (Metric Tons) Forecast by Sales Channel, 2020 to 2035
  • Table 37: Western Europe Market Value (USD Million) Forecast by Country, 2020 to 2035
  • Table 38: Western Europe Market Volume (Metric Tons) Forecast by Country, 2020 to 2035
  • Table 39: Western Europe Market Value (USD Million) Forecast by Form, 2020 to 2035
  • Table 40: Western Europe Market Volume (Metric Tons) Forecast by Form, 2020 to 2035
  • Table 41: Western Europe Market Value (USD Million) Forecast by Species, 2020 to 2035
  • Table 42: Western Europe Market Volume (Metric Tons) Forecast by Species, 2020 to 2035
  • Table 43: Western Europe Market Value (USD Million) Forecast by Claim, 2020 to 2035
  • Table 44: Western Europe Market Volume (Metric Tons) Forecast by Claim, 2020 to 2035
  • Table 45: Western Europe Market Value (USD Million) Forecast by Functionalities, 2020 to 2035
  • Table 46: Western Europe Market Volume (Metric Tons) Forecast by Functionalities, 2020 to 2035
  • Table 47: Western Europe Market Value (USD Million) Forecast by Sales Channel, 2020 to 2035
  • Table 48: Western Europe Market Volume (Metric Tons) Forecast by Sales Channel, 2020 to 2035
  • Table 49: Eastern Europe Market Value (USD Million) Forecast by Country, 2020 to 2035
  • Table 50: Eastern Europe Market Volume (Metric Tons) Forecast by Country, 2020 to 2035
  • Table 51: Eastern Europe Market Value (USD Million) Forecast by Form, 2020 to 2035
  • Table 52: Eastern Europe Market Volume (Metric Tons) Forecast by Form, 2020 to 2035
  • Table 53: Eastern Europe Market Value (USD Million) Forecast by Species, 2020 to 2035
  • Table 54: Eastern Europe Market Volume (Metric Tons) Forecast by Species, 2020 to 2035
  • Table 55: Eastern Europe Market Value (USD Million) Forecast by Claim, 2020 to 2035
  • Table 56: Eastern Europe Market Volume (Metric Tons) Forecast by Claim, 2020 to 2035
  • Table 57: Eastern Europe Market Value (USD Million) Forecast by Functionalities, 2020 to 2035
  • Table 58: Eastern Europe Market Volume (Metric Tons) Forecast by Functionalities, 2020 to 2035
  • Table 59: Eastern Europe Market Value (USD Million) Forecast by Sales Channel, 2020 to 2035
  • Table 60: Eastern Europe Market Volume (Metric Tons) Forecast by Sales Channel, 2020 to 2035
  • Table 61: East Asia Market Value (USD Million) Forecast by Country, 2020 to 2035
  • Table 62: East Asia Market Volume (Metric Tons) Forecast by Country, 2020 to 2035
  • Table 63: East Asia Market Value (USD Million) Forecast by Form, 2020 to 2035
  • Table 64: East Asia Market Volume (Metric Tons) Forecast by Form, 2020 to 2035
  • Table 65: East Asia Market Value (USD Million) Forecast by Species, 2020 to 2035
  • Table 66: East Asia Market Volume (Metric Tons) Forecast by Species, 2020 to 2035
  • Table 67: East Asia Market Value (USD Million) Forecast by Claim, 2020 to 2035
  • Table 68: East Asia Market Volume (Metric Tons) Forecast by Claim, 2020 to 2035
  • Table 69: East Asia Market Value (USD Million) Forecast by Functionalities, 2020 to 2035
  • Table 70: East Asia Market Volume (Metric Tons) Forecast by Functionalities, 2020 to 2035
  • Table 71: East Asia Market Value (USD Million) Forecast by Sales Channel, 2020 to 2035
  • Table 72: East Asia Market Volume (Metric Tons) Forecast by Sales Channel, 2020 to 2035
  • Table 73: South Asia & Pacific Market Value (USD Million) Forecast by Country, 2020 to 2035
  • Table 74: South Asia & Pacific Market Volume (Metric Tons) Forecast by Country, 2020 to 2035
  • Table 75: South Asia & Pacific Market Value (USD Million) Forecast by Form, 2020 to 2035
  • Table 76: South Asia & Pacific Market Volume (Metric Tons) Forecast by Form, 2020 to 2035
  • Table 77: South Asia & Pacific Market Value (USD Million) Forecast by Species, 2020 to 2035
  • Table 78: South Asia & Pacific Market Volume (Metric Tons) Forecast by Species, 2020 to 2035
  • Table 79: South Asia & Pacific Market Value (USD Million) Forecast by Claim, 2020 to 2035
  • Table 80: South Asia & Pacific Market Volume (Metric Tons) Forecast by Claim, 2020 to 2035
  • Table 81: South Asia & Pacific Market Value (USD Million) Forecast by Functionalities, 2020 to 2035
  • Table 82: South Asia & Pacific Market Volume (Metric Tons) Forecast by Functionalities, 2020 to 2035
  • Table 83: South Asia & Pacific Market Value (USD Million) Forecast by Sales Channel, 2020 to 2035
  • Table 84: South Asia & Pacific Market Volume (Metric Tons) Forecast by Sales Channel, 2020 to 2035
  • Table 85: Middle East and Africa Market Value (USD Million) Forecast by Country, 2020 to 2035
  • Table 86: Middle East and Africa Market Volume (Metric Tons) Forecast by Country, 2020 to 2035
  • Table 87: Middle East and Africa Market Value (USD Million) Forecast by Form, 2020 to 2035
  • Table 88: Middle East and Africa Market Volume (Metric Tons) Forecast by Form, 2020 to 2035
  • Table 89: Middle East and Africa Market Value (USD Million) Forecast by Species, 2020 to 2035
  • Table 90: Middle East and Africa Market Volume (Metric Tons) Forecast by Species, 2020 to 2035
  • Table 91: Middle East and Africa Market Value (USD Million) Forecast by Claim, 2020 to 2035
  • Table 92: Middle East and Africa Market Volume (Metric Tons) Forecast by Claim, 2020 to 2035
  • Table 93: Middle East and Africa Market Value (USD Million) Forecast by Functionalities, 2020 to 2035
  • Table 94: Middle East and Africa Market Volume (Metric Tons) Forecast by Functionalities, 2020 to 2035
  • Table 95: Middle East and Africa Market Value (USD Million) Forecast by Sales Channel, 2020 to 2035
  • Table 96: Middle East and Africa Market Volume (Metric Tons) Forecast by Sales Channel, 2020 to 2035

List of Figures

  • Figure 1: Global Market Volume (Metric Tons) Forecast 2020 to 2035
  • Figure 2: Global Market Pricing Analysis
  • Figure 3: Global Market Value (USD Million) Forecast 2020 to 2035
  • Figure 4: Global Market Value Share and BPS Analysis by Form, 2025 and 2035
  • Figure 5: Global Market Y-o-Y Growth Comparison by Form, 2025 to 2035
  • Figure 6: Global Market Attractiveness Analysis by Form
  • Figure 7: Global Market Value Share and BPS Analysis by Species, 2025 and 2035
  • Figure 8: Global Market Y-o-Y Growth Comparison by Species, 2025 to 2035
  • Figure 9: Global Market Attractiveness Analysis by Species
  • Figure 10: Global Market Value Share and BPS Analysis by Claim, 2025 and 2035
  • Figure 11: Global Market Y-o-Y Growth Comparison by Claim, 2025 to 2035
  • Figure 12: Global Market Attractiveness Analysis by Claim
  • Figure 13: Global Market Value Share and BPS Analysis by Functionalities, 2025 and 2035
  • Figure 14: Global Market Y-o-Y Growth Comparison by Functionalities, 2025 to 2035
  • Figure 15: Global Market Attractiveness Analysis by Functionalities
  • Figure 16: Global Market Value Share and BPS Analysis by Sales Channel, 2025 and 2035
  • Figure 17: Global Market Y-o-Y Growth Comparison by Sales Channel, 2025 to 2035
  • Figure 18: Global Market Attractiveness Analysis by Sales Channel
  • Figure 19: Global Market Value (USD Million) Share and BPS Analysis by Region, 2025 and 2035
  • Figure 20: Global Market Y-o-Y Growth Comparison by Region, 2025 to 2035
  • Figure 21: Global Market Attractiveness Analysis by Region
  • Figure 22: USA Market Incremental $ Opportunity, 2025 to 2035
  • Figure 23: Latin America Market Incremental $ Opportunity, 2025 to 2035
  • Figure 24: Western Europe Market Incremental $ Opportunity, 2025 to 2035
  • Figure 25: Eastern Europe Market Incremental $ Opportunity, 2025 to 2035
  • Figure 26: East Asia Market Incremental $ Opportunity, 2025 to 2035
  • Figure 27: South Asia & Pacific Market Incremental $ Opportunity, 2025 to 2035
  • Figure 28: Middle East and Africa Market Incremental $ Opportunity, 2025 to 2035
  • Figure 29: USA Market Value Share and BPS Analysis by Country, 2025 and 2035
  • Figure 30: USA Market Value Share and BPS Analysis by Form, 2025 and 2035
  • Figure 31: USA Market Y-o-Y Growth Comparison by Form, 2025 to 2035
  • Figure 32: USA Market Attractiveness Analysis by Form
  • Figure 33: USA Market Value Share and BPS Analysis by Species, 2025 and 2035
  • Figure 34: USA Market Y-o-Y Growth Comparison by Species, 2025 to 2035
  • Figure 35: USA Market Attractiveness Analysis by Species
  • Figure 36: USA Market Value Share and BPS Analysis by Claim, 2025 and 2035
  • Figure 37: USA Market Y-o-Y Growth Comparison by Claim, 2025 to 2035
  • Figure 38: USA Market Attractiveness Analysis by Claim
  • Figure 39: USA Market Value Share and BPS Analysis by Functionalities, 2025 and 2035
  • Figure 40: USA Market Y-o-Y Growth Comparison by Functionalities, 2025 to 2035
  • Figure 41: USA Market Attractiveness Analysis by Functionalities
  • Figure 42: USA Market Value Share and BPS Analysis by Sales Channel, 2025 and 2035
  • Figure 43: USA Market Y-o-Y Growth Comparison by Sales Channel, 2025 to 2035
  • Figure 44: USA Market Attractiveness Analysis by Sales Channel
  • Figure 45: Latin America Market Value Share and BPS Analysis by Country, 2025 and 2035
  • Figure 46: Latin America Market Value Share and BPS Analysis by Form, 2025 and 2035
  • Figure 47: Latin America Market Y-o-Y Growth Comparison by Form, 2025 to 2035
  • Figure 48: Latin America Market Attractiveness Analysis by Form
  • Figure 49: Latin America Market Value Share and BPS Analysis by Species, 2025 and 2035
  • Figure 50: Latin America Market Y-o-Y Growth Comparison by Species, 2025 to 2035
  • Figure 51: Latin America Market Attractiveness Analysis by Species
  • Figure 52: Latin America Market Value Share and BPS Analysis by Claim, 2025 and 2035
  • Figure 53: Latin America Market Y-o-Y Growth Comparison by Claim, 2025 to 2035
  • Figure 54: Latin America Market Attractiveness Analysis by Claim
  • Figure 55: Latin America Market Value Share and BPS Analysis by Functionalities, 2025 and 2035
  • Figure 56: Latin America Market Y-o-Y Growth Comparison by Functionalities, 2025 to 2035
  • Figure 57: Latin America Market Attractiveness Analysis by Functionalities
  • Figure 58: Latin America Market Value Share and BPS Analysis by Sales Channel, 2025 and 2035
  • Figure 59: Latin America Market Y-o-Y Growth Comparison by Sales Channel, 2025 to 2035
  • Figure 60: Latin America Market Attractiveness Analysis by Sales Channel
  • Figure 61: Western Europe Market Value Share and BPS Analysis by Country, 2025 and 2035
  • Figure 62: Western Europe Market Value Share and BPS Analysis by Form, 2025 and 2035
  • Figure 63: Western Europe Market Y-o-Y Growth Comparison by Form, 2025 to 2035
  • Figure 64: Western Europe Market Attractiveness Analysis by Form
  • Figure 65: Western Europe Market Value Share and BPS Analysis by Species, 2025 and 2035
  • Figure 66: Western Europe Market Y-o-Y Growth Comparison by Species, 2025 to 2035
  • Figure 67: Western Europe Market Attractiveness Analysis by Species
  • Figure 68: Western Europe Market Value Share and BPS Analysis by Claim, 2025 and 2035
  • Figure 69: Western Europe Market Y-o-Y Growth Comparison by Claim, 2025 to 2035
  • Figure 70: Western Europe Market Attractiveness Analysis by Claim
  • Figure 71: Western Europe Market Value Share and BPS Analysis by Functionalities, 2025 and 2035
  • Figure 72: Western Europe Market Y-o-Y Growth Comparison by Functionalities, 2025 to 2035
  • Figure 73: Western Europe Market Attractiveness Analysis by Functionalities
  • Figure 74: Western Europe Market Value Share and BPS Analysis by Sales Channel, 2025 and 2035
  • Figure 75: Western Europe Market Y-o-Y Growth Comparison by Sales Channel, 2025 to 2035
  • Figure 76: Western Europe Market Attractiveness Analysis by Sales Channel
  • Figure 77: Eastern Europe Market Value Share and BPS Analysis by Country, 2025 and 2035
  • Figure 78: Eastern Europe Market Value Share and BPS Analysis by Form, 2025 and 2035
  • Figure 79: Eastern Europe Market Y-o-Y Growth Comparison by Form, 2025 to 2035
  • Figure 80: Eastern Europe Market Attractiveness Analysis by Form
  • Figure 81: Eastern Europe Market Value Share and BPS Analysis by Species, 2025 and 2035
  • Figure 82: Eastern Europe Market Y-o-Y Growth Comparison by Species, 2025 to 2035
  • Figure 83: Eastern Europe Market Attractiveness Analysis by Species
  • Figure 84: Eastern Europe Market Value Share and BPS Analysis by Claim, 2025 and 2035
  • Figure 85: Eastern Europe Market Y-o-Y Growth Comparison by Claim, 2025 to 2035
  • Figure 86: Eastern Europe Market Attractiveness Analysis by Claim
  • Figure 87: Eastern Europe Market Value Share and BPS Analysis by Functionalities, 2025 and 2035
  • Figure 88: Eastern Europe Market Y-o-Y Growth Comparison by Functionalities, 2025 to 2035
  • Figure 89: Eastern Europe Market Attractiveness Analysis by Functionalities
  • Figure 90: Eastern Europe Market Value Share and BPS Analysis by Sales Channel, 2025 and 2035
  • Figure 91: Eastern Europe Market Y-o-Y Growth Comparison by Sales Channel, 2025 to 2035
  • Figure 92: Eastern Europe Market Attractiveness Analysis by Sales Channel
  • Figure 93: East Asia Market Value Share and BPS Analysis by Country, 2025 and 2035
  • Figure 94: East Asia Market Value Share and BPS Analysis by Form, 2025 and 2035
  • Figure 95: East Asia Market Y-o-Y Growth Comparison by Form, 2025 to 2035
  • Figure 96: East Asia Market Attractiveness Analysis by Form
  • Figure 97: East Asia Market Value Share and BPS Analysis by Species, 2025 and 2035
  • Figure 98: East Asia Market Y-o-Y Growth Comparison by Species, 2025 to 2035
  • Figure 99: East Asia Market Attractiveness Analysis by Species
  • Figure 100: East Asia Market Value Share and BPS Analysis by Claim, 2025 and 2035
  • Figure 101: East Asia Market Y-o-Y Growth Comparison by Claim, 2025 to 2035
  • Figure 102: East Asia Market Attractiveness Analysis by Claim
  • Figure 103: East Asia Market Value Share and BPS Analysis by Functionalities, 2025 and 2035
  • Figure 104: East Asia Market Y-o-Y Growth Comparison by Functionalities, 2025 to 2035
  • Figure 105: East Asia Market Attractiveness Analysis by Functionalities
  • Figure 106: East Asia Market Value Share and BPS Analysis by Sales Channel, 2025 and 2035
  • Figure 107: East Asia Market Y-o-Y Growth Comparison by Sales Channel, 2025 to 2035
  • Figure 108: East Asia Market Attractiveness Analysis by Sales Channel
  • Figure 109: South Asia & Pacific Market Value Share and BPS Analysis by Country, 2025 and 2035
  • Figure 110: South Asia & Pacific Market Value Share and BPS Analysis by Form, 2025 and 2035
  • Figure 111: South Asia & Pacific Market Y-o-Y Growth Comparison by Form, 2025 to 2035
  • Figure 112: South Asia & Pacific Market Attractiveness Analysis by Form
  • Figure 113: South Asia & Pacific Market Value Share and BPS Analysis by Species, 2025 and 2035
  • Figure 114: South Asia & Pacific Market Y-o-Y Growth Comparison by Species, 2025 to 2035
  • Figure 115: South Asia & Pacific Market Attractiveness Analysis by Species
  • Figure 116: South Asia & Pacific Market Value Share and BPS Analysis by Claim, 2025 and 2035
  • Figure 117: South Asia & Pacific Market Y-o-Y Growth Comparison by Claim, 2025 to 2035
  • Figure 118: South Asia & Pacific Market Attractiveness Analysis by Claim
  • Figure 119: South Asia & Pacific Market Value Share and BPS Analysis by Functionalities, 2025 and 2035
  • Figure 120: South Asia & Pacific Market Y-o-Y Growth Comparison by Functionalities, 2025 to 2035
  • Figure 121: South Asia & Pacific Market Attractiveness Analysis by Functionalities
  • Figure 122: South Asia & Pacific Market Value Share and BPS Analysis by Sales Channel, 2025 and 2035
  • Figure 123: South Asia & Pacific Market Y-o-Y Growth Comparison by Sales Channel, 2025 to 2035
  • Figure 124: South Asia & Pacific Market Attractiveness Analysis by Sales Channel
  • Figure 125: Middle East and Africa Market Value Share and BPS Analysis by Country, 2025 and 2035
  • Figure 126: Middle East and Africa Market Value Share and BPS Analysis by Form, 2025 and 2035
  • Figure 127: Middle East and Africa Market Y-o-Y Growth Comparison by Form, 2025 to 2035
  • Figure 128: Middle East and Africa Market Attractiveness Analysis by Form
  • Figure 129: Middle East and Africa Market Value Share and BPS Analysis by Species, 2025 and 2035
  • Figure 130: Middle East and Africa Market Y-o-Y Growth Comparison by Species, 2025 to 2035
  • Figure 131: Middle East and Africa Market Attractiveness Analysis by Species
  • Figure 132: Middle East and Africa Market Value Share and BPS Analysis by Claim, 2025 and 2035
  • Figure 133: Middle East and Africa Market Y-o-Y Growth Comparison by Claim, 2025 to 2035
  • Figure 134: Middle East and Africa Market Attractiveness Analysis by Claim
  • Figure 135: Middle East and Africa Market Value Share and BPS Analysis by Functionalities, 2025 and 2035
  • Figure 136: Middle East and Africa Market Y-o-Y Growth Comparison by Functionalities, 2025 to 2035
  • Figure 137: Middle East and Africa Market Attractiveness Analysis by Functionalities
  • Figure 138: Middle East and Africa Market Value Share and BPS Analysis by Sales Channel, 2025 and 2035
  • Figure 139: Middle East and Africa Market Y-o-Y Growth Comparison by Sales Channel, 2025 to 2035
  • Figure 140: Middle East and Africa Market Attractiveness Analysis by Sales Channel
  • Figure 141: Global Market - Tier Structure Analysis
  • Figure 142: Global Market - Company Share Analysis

Frequently Asked Questions

What is the current value of the pet probiotics supplements market?

The market is valued at USD 807.3 million in 2025.

What is the projected size of the pet probiotics supplements market by 2035?

The market is expected to reach USD 1,139.5 million by 2035.

What is the forecast CAGR for 2025 to 2035 in the pet probiotics supplements market?

The market will grow at a CAGR of 3.5% during 2025 to 2035.

Which segment leads the pet probiotics supplements market by form?

Soft chews lead with a 27% market share in 2025.

Which country is the fastest-growing in this pet probiotics supplements market?

The UK is the fastest-growing country with a 7.5% CAGR through 2035.

Explore Similar Insights

Future Market Insights

Pet Probiotics Supplements Market