Pet OTC Medication Market Outlook for 2023 to 2033

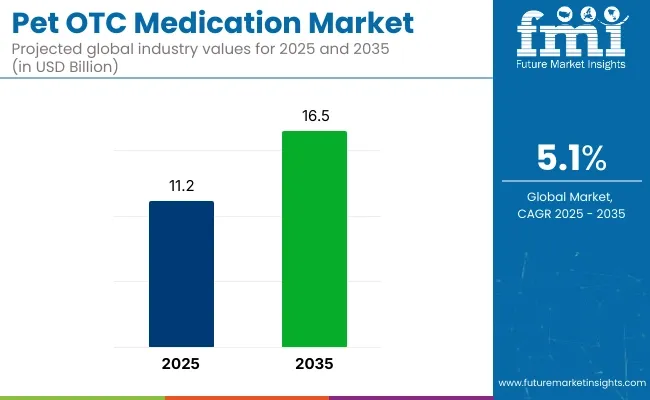
The global market for pet OTC medication is poised for substantial growth, with an estimated valuation of US$ 9,170 million in 2023. This market exhibits a robust trend, characterized by a CAGR of 4.5% expected to persist until 2033

Steadfast growth projections suggest that the global share of the pet OTC medication market is on track to reach an impressive valuation of US$ 14,210.2 million by the year 2033.

Key Market Trends and Highlights

  • The global pet OTC medication market is anticipated to experience consistent growth throughout the assessment period. One of the primary drivers of this growth is the increasing trend of pet adoption.
  • Pet owners are becoming more aware of the importance of pet healthcare. This heightened awareness is contributing significantly to the growth of the pet OTC medication market as pet owners seek accessible and effective healthcare solutions for their beloved companions.
  • The market also presents promising opportunities for expansion in emerging economies, particularly in low and middle-income countries. As the pet ownership trend spreads to these regions, the demand for pet OTC medications is likely to surge, opening up new avenues for market growth.
  • A growing preference for herbal topical medications for treating common pet ailments such as fleas and allergies has been developed. The shift toward herbal and natural remedies aligns with the broad consumer trend favoring organic and sustainable products.
Attributes Key Insights
Pet OTC Medication Market Value in 2023 US$ 9,170 million
Projected Market Value in 2033 US$ 14,210.2 million
Value-based CAGR from 2023 to 2033 4.5%

Don't pay for what you don't need

Customize your report by selecting specific countries or regions and save 30%!

2018 to 2022 Historical Analysis vs. 2023 to 2033 Market Forecast Projections

The scope for global pet OTC medication market insights rose at a 3.46% CAGR between 2018 and 2022. The global market for global pet OTC medication value is anticipated to develop at a moderate CAGR of 4.5% over the forecast period from 2023 to 2033.

Report Attributes Details
Market Value in 2018 US$ 7,720 million
Market Value in 2022 US$ 8,845.7 million
CAGR from 2018 to 2022 3.46%

The global pet OTC medication market exhibited steady growth from 2018 to 2022. This period witnessed a gradual expansion in the market, driven primarily by the rising number of pet adoptions and a growing awareness about pet health among consumers worldwide.

Key market players predominantly focused their efforts on established markets in Europe and North America, capitalizing on the high demand for pet medicines in countries such as the United States, Canada, the United Kingdom, Germany, and Italy. Pet OTC medications became widely available in these regions during this period and consumers became increasingly informed about these products, driving market growth.

Market players strategically positioned themselves to cater to the growing demand for pet healthcare products in these well-established markets. The market is further expected to maintain its growth trajectory from 2023 to 2033.

The global pet OTC medication market is projected to continue expanding steadily, with key determinants of revenue growth including

  • The significant growth of the pet-care market.
  • A sustained increase in the number of pet adoptions.
  • The growing awareness of pet health.

There is an increasing focus on exploring untapped opportunities in emerging markets across Asia, the Middle East, and Africa as the market reaches maturity in established regions. Emerging firms are eyeing these regions as potential growth areas, seeking to establish a brand presence while these markets are still in the developing phase.

The pet OTC medication market witnessed stable growth from 2018 to 2022, driven by factors such as pet adoption trends and increased awareness of pet health. The market is expected to continue its positive trajectory from 2023 to 2033, with opportunities for expansion in emerging markets as the industry evolves.

Pet OTC Medicines Market Shaping Drivers

  • The global pet OTC medication market is witnessing a transformation driven by several key drivers that reflect evolving consumer attitudes and preferences toward pet healthcare.
  • One of the prominent drivers is the humanization of pets, where pets are increasingly considered part of the family. The shift in mindset has led pet owners to seek high-quality healthcare solutions for their furry companions, including over-the-counter medications, experiencing a surge in demand for pet OTC medicines as their pet owners prioritize the health and well-being of their animals.
  • The growing awareness of pet health among consumers. The increased awareness has led to a proactive approach to pet healthcare, with pet owners seeking preventive and therapeutic solutions to address common ailments.
  • The rise of natural pet OTC medications is a compelling driver within the market. Pet owners are increasingly inclined toward natural and holistic healthcare solutions for their pets.
  • Natural OTC medications, often formulated with natural ingredients resonate well with pet owners seeking safer and gentler alternatives for their animals. This trend aligns with the broader consumer preference for natural and organic products, further fueling the demand for natural pet OTC medications.
  • The humanization of pets, increased pet health awareness, the popularity of natural pet OTC medications, and improved accessibility to these products are the key drivers propelling the global pet OTC medication market forward.
Sudip Saha
Sudip Saha

Principal Consultant

Talk to Analyst

Find your sweet spots for generating winning opportunities in this market.

Comparative View of Adjacent Pet OTC Medications Market

Future Market Insights analysts have compared two other markets, namely the pet care market and the pet toys market with the pet OTC medications market. The comparison showcases that the pet OTC medications industry is set to dominate out of these three markets over the forecast period from 2023 to 2033.

Pet OTC Medications Market:

CAGR from 2023 to 2033 4.5%
Market Value in 2033 US$ 14,210.2 million
Key Trends
  • Rapid growth in the pet-care market is estimated to have a positive impact on the global pet OTC medication market.
  • Growing number of pet adoptions and increasing awareness regarding pet health will be determinants of revenue growth.
Opportunity
  • The increasing popularity of natural pet OTC medications, crafted from safe and natural ingredients with minimal side effects, presents a significant growth opportunity in the global market.
  • The widespread availability and accessibility of pet OTC medicines worldwide contribute to market growth.

Pet Care Market:

CAGR from 2023 to 2033 4.1%
Market Value in 2033 US$ 12,200 million
Key Trends
  • The rising popularity of premium service dog and cat toys among animal owners is likely to boost the demand for pet dog and cat toys.
  • Rising demand for high-quality animal hygiene products is expected to fuel market expansion over the coming years.
Opportunity
  • Developing pet care store infrastructure in several countries throughout the world is projected to enhance the consumption rate of pet-related products. It consequently increases the opportunities.
  • The rise of specialized online platforms that provide curated pet care products and subscription-based services presents an opportunity. This opportunity enhances convenience and accessibility in the pet care industry.

Pet Toys Market:

CAGR from 2023 to 2033 3.4%
Market Value in 2033 US$ 9,967.2 million
Key Trends
  • The emergence of private label brands is the new retail revolution that is reshaping industry trends.
  • A large range of dog toys is now available from numerous online retailers making the dog toy market expand significantly.
Opportunity
  • Increasing penetration of regional and local players is further likely to drive the opportunity to adopt DTC distribution channels.
  • The expansion of the digital ecosystem has played an important role in facilitating the manufacturers to directly connect with their consumers.

Country-wise Insights

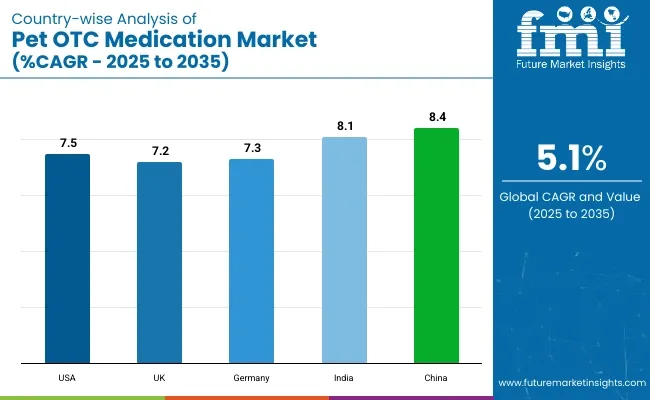
The below table showcases revenues in terms of the five countries, spearheaded by the United States, China, the United Kingdom, Japan, and India. Out of these 5 countries, the United States is leading followed by China.

Expected Market Values in 2033

The United States US$ 11,210 million
India US$ 4,821.2 million
France US$ 7,120 million
China US$ 9,688.9 million
Germany US$ 6,145 million

The United States Pet Insurance Drives Demand for Dog OTC Pain Medicines

The pet OTC medication market in the United States stands as one of the most prosperous segments globally, with a current valuation of US$ 11,210 million and a steady sales growth rate at a market share of 49.3% by 2033.

The financial robustness can be attributed to the country's well-established and mature customer base, known for its significant expenditures on pet care products, accessories, toys, and, notably, medications. The United States pet owners' dedication to their pets' health and well-being has translated into a consistently growing demand for over-the-counter pet medications.

One noteworthy factor further propelling the market's growth is the surge in pet insurance offerings within the United States. The increasing adoption of pet insurance plans makes OTC medications accessible to a broad spectrum of consumers.

The financial burden of pet healthcare diminishes, prompting them to seek and invest in a wider range of pet health products, including OTC medications as pet owners opt for insurance coverage. This trend is expected to be a significant driver in augmenting the market's growth trajectory, catering to a diverse consumer base, and fostering increased sales of pet OTC medications.

Leading Pharmaceutical Firms in France and their Impact on the Pet OTC Medication Market

France is anticipated to reach US$ 7,120 million by 2033 and expand at a market share of 3.7% by 2033.

The strong presence of France in the global pharmaceutical industry positions it as a significant player in the pet OTC medication market. The country's reputation for innovation and research excellence has attracted leading pharmaceutical firms, turning it into a hub for launching new pet healthcare products. With a focus on pet health and well-being, the pet OTC medication market in France is expected to thrive.

Key market players, including Vetoquinol SA and Virbac SA Co, are headquartered in France, further solidifying the nation's importance in the industry. These renowned pharmaceutical companies have a global presence and leverage their expertise to develop high-quality pet medications.

The presence of renowned companies in France not only supports the local market but also contributes to the growth of the pet OTC medicine sector in Europe. With innovation at its core, France is poised to play a pivotal role in shaping the future of pet healthcare and driving market expansion.

Expanding Pet Ownership and Healthcare Awareness Drive the Market in India

The pet OTC medication market in India is experiencing significant growth, with a current valuation of US$ 4,821.2 million and a projected market share of 1.6%.

The growth is primarily driven by the increasing adoption of pets across the country and the growing awareness among consumers regarding pet healthcare. As many Indian households welcome pets into their homes, the demand for over-the-counter medications to ensure the well-being of these animals is on the rise.

The rise in pet adoption can be attributed to various factors, including changing lifestyles, increased disposable income, and a cultural shift toward pet ownership. This trend is particularly prominent in urban areas, where the concept of pet companionship is gaining traction. As many people in India embrace pets as part of their families, the need for accessible and effective pet OTC medications is becoming paramount.

The market presents a significant opportunity for both established and emerging players in the pet OTC medication market in India to cater to the evolving demands of pet owners and contribute to the overall growth of the industry.

Pet Supplement Market Set for Strong Growth in China

The pet supplement market is poised for substantial growth in the coming years, with a projected market share of 5.1% with a valuation of US$ 9,688.9 million by 2033. One of the key drivers fueling this growth is the changing perception among pet owners who increasingly recognize that standard pet food may not fully meet their pets' health needs.

The shift in mindset is creating a favorable environment for pet supplements, which are seen as a means to address any nutritional deficiencies in pets' daily diets effectively. Also, the growing population of domesticated animals, including dogs, fish, birds, and cats, particularly in regions like China, is expected to drive robust demand for pet supplements.

Pet owners are becoming conscious of their pets' health and well-being as pet ownership continues to rise. Consequently, this drives the demand for supplements that can support their pets' overall health, vitality, and longevity. This trend is expected to be a significant factor in the continued expansion of the pet supplement market in the coming years.

Growing OTC Veterinary Drug Market in Germany

OTC veterinary drug market in Germany registered a market share of 4.5% with a valuation of US$ 6,145 million by 2033.

The rising rate of pet adoption and the trend of pet humanization is one of the primary drivers of market expansion. Pet owners are increasingly considering their pets as family members, leading to a surge in demand for high-quality pet care products, including OTC veterinary drugs. The heightened pet adoption is not only boosting the sales of OTC veterinary drugs but also enhancing the overall market dynamics.

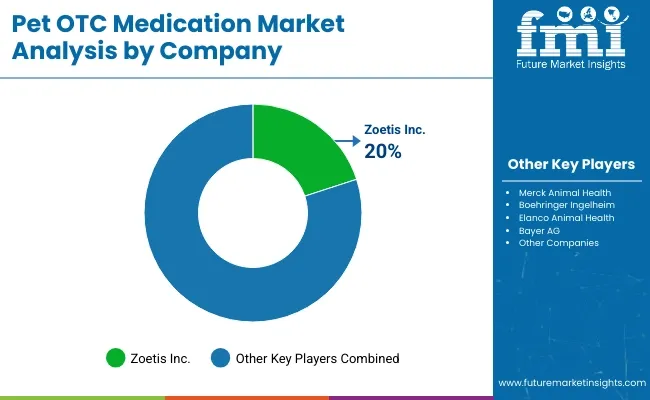
The region benefits from the presence of leading OTC veterinary drug producers, such as Merck Animal Health, Boehringer Ingelheim, and Virbac S.A. These industry leaders contribute to the high availability of veterinary drug products within the country.

The robust presence of the key players is bolstering market growth and ensuring a wide range of OTC veterinary drugs for pet owners, veterinarians, and the broader pet care industry.

Get the data you need at a Fraction of the cost

Personalize your report by choosing insights you need
and save 40%!

Category-wise Insights

The below table highlights how dogs and fleas and ticks are projected to lead the pet OTC medication market expanding at a market share of 35% and 43.1% through 2033 respectively. The table further continues with the details about how the chewables & tablets are likely to spearhead sales based on source and are anticipated to witness a market share of 30% through 2033.

Category Market Share by 2033
Dogs 35%
Fleas & Ticks 43.1%
Chewables & Tablets 30%

Rising Pet Adoption Cultivates Robust Sales of Dog OTC Medications

The dog OTC medication category currently claims a substantial 35% share of the overall market, translating to a market value of US$ 3,400 million.

A notable surge in pet adoption was primarily driven by the emergence of a pet-parent culture in developed nations. This cultural shift toward considering pets as cherished family members has significantly impacted the pet care industry. Among the various segments within the market, dog over-the-counter (OTC) medications have emerged as the top-selling category, accounting for the lion's share of sales.

The dominance can be attributed to the growing number of dog owners who prioritize their pets' health and well-being. As pet parents increasingly seek accessible and effective healthcare solutions for their canine companions, the demand for OTC medications tailored for dogs has soared. This trend reflects the significant influence of the pet-parent culture on consumer behavior and purchasing decisions in the pet care industry.

Rising Demand for Flea and Tick Control Solutions

Fleas & ticks claim a substantial 43.1% share of the overall market, translating to a market value of US$ 1,580 million.

The pet OTC medication market is experiencing a significant boost in growth, primarily fueled by rising pet adoption rates and pet owners' willingness to invest in the health and well-being of their furry companions. As many households welcome pets into their families, the demand for pet care products, including flea and tick treatments, is on the rise.

Pet owners are increasingly conscious of the importance of protecting their pets from common parasites like fleas and ticks, which can cause discomfort and health issues. This heightened awareness is driving pet owners to seek over-the-counter medications that provide effective and convenient solutions for parasite control.

The growing awareness about pet parasitism is playing a pivotal role in the market's expansion. Pet owners are proactively seeking information about the risks associated with parasites and are keen on preventing infestations. The shift toward preventive care aligns with the broad trend of pet humanization, where pets are regarded as cherished family members deserving of the best possible care.

The Ease of Administration Makes Chewables & Tablets Preferred Choice

Based on form, the chewables & tablets are anticipated to dominate the industry with a market share of 30% by 2033.

Administering medications to pets can often be a challenging task for pet owners. Recognizing this common struggle, many manufacturers have shifted their focus toward offering over-the-counter (OTC) pet medications in convenient forms such as chews and tablets.

The transformation is driven by the desire to simplify the medication process, making it accessible and enjoyable for both pets and their owners. Chewables and tablets have gained popularity, emerging as preferred choices for pet owners seeking effective and hassle-free ways to care for their furry companions.

Chewable medications, resembling treats in appearance and taste, have emerged as a favored option among pet owners. These chewables not only make the administration of medicines manageable but also transform it into a rewarding experience for pets. The innovative approach ensures that pets willingly accept their medication, addressing a significant challenge that pet owners frequently encounter.

Competitive Landscape

Prices for raw materials are predicted to fluctuate, and new techniques followed by competitors will present a big challenge for established businesses. They are spending money on research and development, and innovation to keep reinforce their position in the pet OTC medication market.

Key players rely on mergers, acquisitions, and joint ventures to protect their position and lower system costs. To suit the demands of innovative design, they offer structural design and construction services. Some market entrants are discussed below.

  • In June 2023, Bayer announced its Crop Science Division. It is estimated to capitalize on opportunities presented by the shift to regenerative agriculture to grow in adjacent markets to its core business of seeds, traits, crop protection, and digital.
  • In February 2023, Bayer warned operating earnings would decline as the agriculture and healthcare company is hit by high costs and the reversal of last year's price boost for its weedkillers.
  • In April 2023, Merck, known as MSD outside the United States and Canada, and Prometheus Biosciences, Inc. announced that the companies have entered into a definitive agreement. Merck, through a subsidiary, has agreed to acquire Prometheus for US$ 200.00 per share in cash for a total equity value of around US$ 10.8 billion.

Scope of Report

Attributes Details
Estimated Market Size in 2023 US$ 9,170 million
Projected Market Valuation in 2033 US$ 14,210.2 million
CAGR Share from 2023 to 2033 4.5%
Forecast Period 2023 to 2033
Historical Data Available for 2018 to 2022
Market Analysis Value in US$ million
Key Regions Covered North America; Latin America; Western Europe; Eastern Europe; South Asia and Pacific; East Asia; The Middle East & Africa
Key Market Segments Covered Pet Type, Application, Form, Sales Channel, Region
Key Countries Profiled The United States, Canada, Brazil, Mexico, Germany, The United Kingdom, France, Spain, Italy, Russia, Poland, Czech Republic, Romania, India, Bangladesh, Australia, New Zealand, China, Japan, South Korea, GCC countries, South Africa, Israel
Key Companies Profiled Ceva Santé Animale Co.; Elanco Animal Health Inc.; Boehringer Ingelheim International GmbH; Zoetis Inc.; Merck & Co., Inc.; Virbac SA Co.; Bayer AG; IDEXX Laboratories Co.; Covetrus Inc.; Dechra Pharmaceuticals PLC; Vetoquinol SA; Phibro Animal Health Co.; Kyoritsuseiyaku Co.; Krka, d. d., Novo Mesto; Sequent Scientific Ltd.; Heska Co.; Eco Animal Health Group

Pet OTC Medication Market by Category

Pet Type:

  • Dogs
  • Cats
  • Birds
  • Fish and Reptiles
  • Small Pets
  • Others

By Application:

  • Fleas & Ticks
  • Allergies
  • Pain Relief & Arthritis
  • De-wormers
  • Others

By Form:

  • Chewables & Tablets
  • Capsules & Ointment
  • Sprays
  • Others

By Sales Channel:

  • Pet Specialty Stores
  • Veterinary Clinics
  • Drug & Pharmacy Stores
  • Online Retail
  • Others

By Region:

  • North America
  • Latin America
  • Europe
  • East Asia
  • South Asia
  • Oceania
  • The Middle East and Africa

Frequently Asked Questions

What is the Expected Worth of the Pet OTC Medication Market in 2023?

The pet OTC medication market is expected to reach US$ 9,170 million in 2023.

What is the Projected CAGR for the Pet OTC Medication Market until 2033?

The pet OTC medication market is set to expand by a CAGR of 4.5% by 2033.

How much Valuation is Projected for the Pet OTC Medication Market in 2033?

The pet OTC medication industry is forecast to reach US$ 14,210.2 million by 2033.

Which Country is Likely to be at the Pinnacle of the Pet OTC Medication Market?

The United States is likely to be the top-performing market, accounting for US$ 11,210 million by 2033.

Which is the Leading Application in the Pet OTC Medication Domain?

Fleas & ticks are preferred and are expected to rise at a market share of 43.1% through 2033.

Table of Content
1. Executive Summary

    1.1. Global Market Outlook

    1.2. Demand-side Trends

    1.3. Supply-side Trends

    1.4. Technology Roadmap Analysis

    1.5. Analysis and Recommendations

2. Market Overview

    2.1. Market Coverage / Taxonomy

    2.2. Market Definition / Scope / Limitations

3. Market Background

    3.1. Market Dynamics

        3.1.1. Drivers

        3.1.2. Restraints

        3.1.3. Opportunity

        3.1.4. Trends

    3.2. Scenario Forecast

        3.2.1. Demand in Optimistic Scenario

        3.2.2. Demand in Likely Scenario

        3.2.3. Demand in Conservative Scenario

    3.3. Opportunity Map Analysis

    3.4. Product Life Cycle Analysis

    3.5. Supply Chain Analysis

        3.5.1. Supply Side Participants and their Roles

            3.5.1.1. Producers

            3.5.1.2. Mid-Level Participants (Traders/ Agents/ Brokers)

            3.5.1.3. Wholesalers and Distributors

        3.5.2. Value Added and Value Created at Node in the Supply Chain

        3.5.3. List of Raw Material Suppliers

        3.5.4. List of Existing and Potential Buyer’s

    3.6. Investment Feasibility Matrix

    3.7. Value Chain Analysis

        3.7.1. Profit Margin Analysis

        3.7.2. Wholesalers and Distributors

        3.7.3. Retailers

    3.8. PESTLE and Porter’s Analysis

    3.9. Regulatory Landscape

        3.9.1. By Key Regions

        3.9.2. By Key Countries

    3.10. Regional Parent Market Outlook

    3.11. Production and Consumption Statistics

    3.12. Import and Export Statistics

4. Global Market Analysis 2018 to 2022 and Forecast, 2023 to 2033

    4.1. Historical Market Size Value (US$ Million) & Volume (Units) Analysis, 2018 to 2022

    4.2. Current and Future Market Size Value (US$ Million) & Volume (Units) Projections, 2023 to 2033

        4.2.1. Y-o-Y Growth Trend Analysis

        4.2.2. Absolute $ Opportunity Analysis

5. Global Market Analysis 2018 to 2022 and Forecast 2023 to 2033, By Pet Type

    5.1. Introduction / Key Findings

    5.2. Historical Market Size Value (US$ Million) & Volume (Units) Analysis By Pet Type, 2018 to 2022

    5.3. Current and Future Market Size Value (US$ Million) & Volume (Units) Analysis and Forecast By Pet Type, 2023 to 2033

        5.3.1. Dogs

        5.3.2. Cats

        5.3.3. Birds

        5.3.4. Fish and Reptiles

        5.3.5. Small Pets

        5.3.6. Others

    5.4. Y-o-Y Growth Trend Analysis By Pet Type, 2018 to 2022

    5.5. Absolute $ Opportunity Analysis By Pet Type, 2023 to 2033

6. Global Market Analysis 2018 to 2022 and Forecast 2023 to 2033, By Application

    6.1. Introduction / Key Findings

    6.2. Historical Market Size Value (US$ Million) & Volume (Units) Analysis By Application, 2018 to 2022

    6.3. Current and Future Market Size Value (US$ Million) & Volume (Units) Analysis and Forecast By Application, 2023 to 2033

        6.3.1. Fleas & Ticks

        6.3.2. Allergies

        6.3.3. Pain Relief & Arthritis

        6.3.4. De-wormers

        6.3.5. Others

    6.4. Y-o-Y Growth Trend Analysis By Application, 2018 to 2022

    6.5. Absolute $ Opportunity Analysis By Application, 2023 to 2033

7. Global Market Analysis 2018 to 2022 and Forecast 2023 to 2033, By Form

    7.1. Introduction / Key Findings

    7.2. Historical Market Size Value (US$ Million) & Volume (Units) Analysis By Form, 2018 to 2022

    7.3. Current and Future Market Size Value (US$ Million) & Volume (Units) Analysis and Forecast By Form, 2023 to 2033

        7.3.1. Chewables & Tablets

        7.3.2. Capsules & Ointment

        7.3.3. Sprays

        7.3.4. Others

    7.4. Y-o-Y Growth Trend Analysis By Form, 2018 to 2022

    7.5. Absolute $ Opportunity Analysis By Form, 2023 to 2033

8. Global Market Analysis 2018 to 2022 and Forecast 2023 to 2033, By Sales Channel

    8.1. Introduction / Key Findings

    8.2. Historical Market Size Value (US$ Million) & Volume (Units) Analysis By Sales Channel, 2018 to 2022

    8.3. Current and Future Market Size Value (US$ Million) & Volume (Units) Analysis and Forecast By Sales Channel, 2023 to 2033

        8.3.1. Pet Specialty Stores

        8.3.2. Veterinary Clinics

        8.3.3. Drug & Pharmacy Stores

        8.3.4. Online Retail

        8.3.5. Others

    8.4. Y-o-Y Growth Trend Analysis By Sales Channel, 2018 to 2022

    8.5. Absolute $ Opportunity Analysis By Sales Channel, 2023 to 2033

9. Global Market Analysis 2018 to 2022 and Forecast 2023 to 2033, By Region

    9.1. Introduction

    9.2. Historical Market Size Value (US$ Million) & Volume (Units) Analysis By Region, 2018 to 2022

    9.3. Current Market Size Value (US$ Million) & Volume (Units) Analysis and Forecast By Region, 2023 to 2033

        9.3.1. North America

        9.3.2. Latin America

        9.3.3. Western Europe

        9.3.4. Eastern Europe

        9.3.5. South Asia and Pacific

        9.3.6. East Asia

        9.3.7. Middle East and Africa

    9.4. Market Attractiveness Analysis By Region

10. North America Market Analysis 2018 to 2022 and Forecast 2023 to 2033, By Country

    10.1. Historical Market Size Value (US$ Million) & Volume (Units) Trend Analysis By Market Taxonomy, 2018 to 2022

    10.2. Market Size Value (US$ Million) & Volume (Units) Forecast By Market Taxonomy, 2023 to 2033

        10.2.1. By Country

            10.2.1.1. The USA

            10.2.1.2. Canada

        10.2.2. By Pet Type

        10.2.3. By Application

        10.2.4. By Form

        10.2.5. By Sales Channel

    10.3. Market Attractiveness Analysis

        10.3.1. By Country

        10.3.2. By Pet Type

        10.3.3. By Application

        10.3.4. By Form

        10.3.5. By Sales Channel

    10.4. Key Takeaways

11. Latin America Market Analysis 2018 to 2022 and Forecast 2023 to 2033, By Country

    11.1. Historical Market Size Value (US$ Million) & Volume (Units) Trend Analysis By Market Taxonomy, 2018 to 2022

    11.2. Market Size Value (US$ Million) & Volume (Units) Forecast By Market Taxonomy, 2023 to 2033

        11.2.1. By Country

            11.2.1.1. Brazil

            11.2.1.2. Mexico

            11.2.1.3. Rest of Latin America

        11.2.2. By Pet Type

        11.2.3. By Application

        11.2.4. By Form

        11.2.5. By Sales Channel

    11.3. Market Attractiveness Analysis

        11.3.1. By Country

        11.3.2. By Pet Type

        11.3.3. By Application

        11.3.4. By Form

        11.3.5. By Sales Channel

    11.4. Key Takeaways

12. Western Europe Market Analysis 2018 to 2022 and Forecast 2023 to 2033, By Country

    12.1. Historical Market Size Value (US$ Million) & Volume (Units) Trend Analysis By Market Taxonomy, 2018 to 2022

    12.2. Market Size Value (US$ Million) & Volume (Units) Forecast By Market Taxonomy, 2023 to 2033

        12.2.1. By Country

            12.2.1.1. Germany

            12.2.1.2. United Kingdom

            12.2.1.3. France

            12.2.1.4. Spain

            12.2.1.5. Italy

            12.2.1.6. Rest of Western Europe

        12.2.2. By Pet Type

        12.2.3. By Application

        12.2.4. By Form

        12.2.5. By Sales Channel

    12.3. Market Attractiveness Analysis

        12.3.1. By Country

        12.3.2. By Pet Type

        12.3.3. By Application

        12.3.4. By Form

        12.3.5. By Sales Channel

    12.4. Key Takeaways

13. Eastern Europe Market Analysis 2018 to 2022 and Forecast 2023 to 2033, By Country

    13.1. Historical Market Size Value (US$ Million) & Volume (Units) Trend Analysis By Market Taxonomy, 2018 to 2022

    13.2. Market Size Value (US$ Million) & Volume (Units) Forecast By Market Taxonomy, 2023 to 2033

        13.2.1. By Country

            13.2.1.1. Poland

            13.2.1.2. Russia

            13.2.1.3. Czech Republic

            13.2.1.4. Romania

            13.2.1.5. Rest of Eastern Europe

        13.2.2. By Pet Type

        13.2.3. By Application

        13.2.4. By Form

        13.2.5. By Sales Channel

    13.3. Market Attractiveness Analysis

        13.3.1. By Country

        13.3.2. By Pet Type

        13.3.3. By Application

        13.3.4. By Form

        13.3.5. By Sales Channel

    13.4. Key Takeaways

14. South Asia and Pacific Market Analysis 2018 to 2022 and Forecast 2023 to 2033, By Country

    14.1. Historical Market Size Value (US$ Million) & Volume (Units) Trend Analysis By Market Taxonomy, 2018 to 2022

    14.2. Market Size Value (US$ Million) & Volume (Units) Forecast By Market Taxonomy, 2023 to 2033

        14.2.1. By Country

            14.2.1.1. India

            14.2.1.2. Bangladesh

            14.2.1.3. Australia

            14.2.1.4. New Zealand

            14.2.1.5. Rest of South Asia and Pacific

        14.2.2. By Pet Type

        14.2.3. By Application

        14.2.4. By Form

        14.2.5. By Sales Channel

    14.3. Market Attractiveness Analysis

        14.3.1. By Country

        14.3.2. By Pet Type

        14.3.3. By Application

        14.3.4. By Form

        14.3.5. By Sales Channel

    14.4. Key Takeaways

15. East Asia Market Analysis 2018 to 2022 and Forecast 2023 to 2033, By Country

    15.1. Historical Market Size Value (US$ Million) & Volume (Units) Trend Analysis By Market Taxonomy, 2018 to 2022

    15.2. Market Size Value (US$ Million) & Volume (Units) Forecast By Market Taxonomy, 2023 to 2033

        15.2.1. By Country

            15.2.1.1. China

            15.2.1.2. Japan

            15.2.1.3. South Korea

        15.2.2. By Pet Type

        15.2.3. By Application

        15.2.4. By Form

        15.2.5. By Sales Channel

    15.3. Market Attractiveness Analysis

        15.3.1. By Country

        15.3.2. By Pet Type

        15.3.3. By Application

        15.3.4. By Form

        15.3.5. By Sales Channel

    15.4. Key Takeaways

16. Middle East and Africa Market Analysis 2018 to 2022 and Forecast 2023 to 2033, By Country

    16.1. Historical Market Size Value (US$ Million) & Volume (Units) Trend Analysis By Market Taxonomy, 2018 to 2022

    16.2. Market Size Value (US$ Million) & Volume (Units) Forecast By Market Taxonomy, 2023 to 2033

        16.2.1. By Country

            16.2.1.1. GCC Countries

            16.2.1.2. South Africa

            16.2.1.3. Israel

            16.2.1.4. Rest of MEA

        16.2.2. By Pet Type

        16.2.3. By Application

        16.2.4. By Form

        16.2.5. By Sales Channel

    16.3. Market Attractiveness Analysis

        16.3.1. By Country

        16.3.2. By Pet Type

        16.3.3. By Application

        16.3.4. By Form

        16.3.5. By Sales Channel

    16.4. Key Takeaways

17. Key Countries Market Analysis

    17.1. USA

        17.1.1. Pricing Analysis

        17.1.2. Market Share Analysis, 2022

            17.1.2.1. By Pet Type

            17.1.2.2. By Application

            17.1.2.3. By Form

            17.1.2.4. By Sales Channel

    17.2. Canada

        17.2.1. Pricing Analysis

        17.2.2. Market Share Analysis, 2022

            17.2.2.1. By Pet Type

            17.2.2.2. By Application

            17.2.2.3. By Form

            17.2.2.4. By Sales Channel

    17.3. Brazil

        17.3.1. Pricing Analysis

        17.3.2. Market Share Analysis, 2022

            17.3.2.1. By Pet Type

            17.3.2.2. By Application

            17.3.2.3. By Form

            17.3.2.4. By Sales Channel

    17.4. Mexico

        17.4.1. Pricing Analysis

        17.4.2. Market Share Analysis, 2022

            17.4.2.1. By Pet Type

            17.4.2.2. By Application

            17.4.2.3. By Form

            17.4.2.4. By Sales Channel

    17.5. Germany

        17.5.1. Pricing Analysis

        17.5.2. Market Share Analysis, 2022

            17.5.2.1. By Pet Type

            17.5.2.2. By Application

            17.5.2.3. By Form

            17.5.2.4. By Sales Channel

    17.6. United Kingdom

        17.6.1. Pricing Analysis

        17.6.2. Market Share Analysis, 2022

            17.6.2.1. By Pet Type

            17.6.2.2. By Application

            17.6.2.3. By Form

            17.6.2.4. By Sales Channel

    17.7. France

        17.7.1. Pricing Analysis

        17.7.2. Market Share Analysis, 2022

            17.7.2.1. By Pet Type

            17.7.2.2. By Application

            17.7.2.3. By Form

            17.7.2.4. By Sales Channel

    17.8. Spain

        17.8.1. Pricing Analysis

        17.8.2. Market Share Analysis, 2022

            17.8.2.1. By Pet Type

            17.8.2.2. By Application

            17.8.2.3. By Form

            17.8.2.4. By Sales Channel

    17.9. Italy

        17.9.1. Pricing Analysis

        17.9.2. Market Share Analysis, 2022

            17.9.2.1. By Pet Type

            17.9.2.2. By Application

            17.9.2.3. By Form

            17.9.2.4. By Sales Channel

    17.10. Poland

        17.10.1. Pricing Analysis

        17.10.2. Market Share Analysis, 2022

            17.10.2.1. By Pet Type

            17.10.2.2. By Application

            17.10.2.3. By Form

            17.10.2.4. By Sales Channel

    17.11. Russia

        17.11.1. Pricing Analysis

        17.11.2. Market Share Analysis, 2022

            17.11.2.1. By Pet Type

            17.11.2.2. By Application

            17.11.2.3. By Form

            17.11.2.4. By Sales Channel

    17.12. Czech Republic

        17.12.1. Pricing Analysis

        17.12.2. Market Share Analysis, 2022

            17.12.2.1. By Pet Type

            17.12.2.2. By Application

            17.12.2.3. By Form

            17.12.2.4. By Sales Channel

    17.13. Romania

        17.13.1. Pricing Analysis

        17.13.2. Market Share Analysis, 2022

            17.13.2.1. By Pet Type

            17.13.2.2. By Application

            17.13.2.3. By Form

            17.13.2.4. By Sales Channel

    17.14. India

        17.14.1. Pricing Analysis

        17.14.2. Market Share Analysis, 2022

            17.14.2.1. By Pet Type

            17.14.2.2. By Application

            17.14.2.3. By Form

            17.14.2.4. By Sales Channel

    17.15. Bangladesh

        17.15.1. Pricing Analysis

        17.15.2. Market Share Analysis, 2022

            17.15.2.1. By Pet Type

            17.15.2.2. By Application

            17.15.2.3. By Form

            17.15.2.4. By Sales Channel

    17.16. Australia

        17.16.1. Pricing Analysis

        17.16.2. Market Share Analysis, 2022

            17.16.2.1. By Pet Type

            17.16.2.2. By Application

            17.16.2.3. By Form

            17.16.2.4. By Sales Channel

    17.17. New Zealand

        17.17.1. Pricing Analysis

        17.17.2. Market Share Analysis, 2022

            17.17.2.1. By Pet Type

            17.17.2.2. By Application

            17.17.2.3. By Form

            17.17.2.4. By Sales Channel

    17.18. China

        17.18.1. Pricing Analysis

        17.18.2. Market Share Analysis, 2022

            17.18.2.1. By Pet Type

            17.18.2.2. By Application

            17.18.2.3. By Form

            17.18.2.4. By Sales Channel

    17.19. Japan

        17.19.1. Pricing Analysis

        17.19.2. Market Share Analysis, 2022

            17.19.2.1. By Pet Type

            17.19.2.2. By Application

            17.19.2.3. By Form

            17.19.2.4. By Sales Channel

    17.20. South Korea

        17.20.1. Pricing Analysis

        17.20.2. Market Share Analysis, 2022

            17.20.2.1. By Pet Type

            17.20.2.2. By Application

            17.20.2.3. By Form

            17.20.2.4. By Sales Channel

    17.21. GCC Countries

        17.21.1. Pricing Analysis

        17.21.2. Market Share Analysis, 2022

            17.21.2.1. By Pet Type

            17.21.2.2. By Application

            17.21.2.3. By Form

            17.21.2.4. By Sales Channel

    17.22. South Africa

        17.22.1. Pricing Analysis

        17.22.2. Market Share Analysis, 2022

            17.22.2.1. By Pet Type

            17.22.2.2. By Application

            17.22.2.3. By Form

            17.22.2.4. By Sales Channel

    17.23. Israel

        17.23.1. Pricing Analysis

        17.23.2. Market Share Analysis, 2022

            17.23.2.1. By Pet Type

            17.23.2.2. By Application

            17.23.2.3. By Form

            17.23.2.4. By Sales Channel

18. Market Structure Analysis

    18.1. Competition Dashboard

    18.2. Competition Benchmarking

    18.3. Market Share Analysis of Top Players

        18.3.1. By Regional

        18.3.2. By Pet Type

        18.3.3. By Application

        18.3.4. By Form

        18.3.5. By Sales Channel

19. Competition Analysis

    19.1. Competition Deep Dive

        19.1.1. Ceva Santé Animale Co.

            19.1.1.1. Overview

            19.1.1.2. Product Portfolio

            19.1.1.3. Profitability by Market Segments

            19.1.1.4. Sales Footprint

            19.1.1.5. Strategy Overview

                19.1.1.5.1. Marketing Strategy

                19.1.1.5.2. Product Strategy

                19.1.1.5.3. Channel Strategy

        19.1.2. Elanco Animal Health Inc.

            19.1.2.1. Overview

            19.1.2.2. Product Portfolio

            19.1.2.3. Profitability by Market Segments

            19.1.2.4. Sales Footprint

            19.1.2.5. Strategy Overview

                19.1.2.5.1. Marketing Strategy

                19.1.2.5.2. Product Strategy

                19.1.2.5.3. Channel Strategy

        19.1.3. Boehringer Ingelheim International GmbH

            19.1.3.1. Overview

            19.1.3.2. Product Portfolio

            19.1.3.3. Profitability by Market Segments

            19.1.3.4. Sales Footprint

            19.1.3.5. Strategy Overview

                19.1.3.5.1. Marketing Strategy

                19.1.3.5.2. Product Strategy

                19.1.3.5.3. Channel Strategy

        19.1.4. Zoetis Inc.

            19.1.4.1. Overview

            19.1.4.2. Product Portfolio

            19.1.4.3. Profitability by Market Segments

            19.1.4.4. Sales Footprint

            19.1.4.5. Strategy Overview

                19.1.4.5.1. Marketing Strategy

                19.1.4.5.2. Product Strategy

                19.1.4.5.3. Channel Strategy

        19.1.5. Merck & Co., Inc.

            19.1.5.1. Overview

            19.1.5.2. Product Portfolio

            19.1.5.3. Profitability by Market Segments

            19.1.5.4. Sales Footprint

            19.1.5.5. Strategy Overview

                19.1.5.5.1. Marketing Strategy

                19.1.5.5.2. Product Strategy

                19.1.5.5.3. Channel Strategy

        19.1.6. Virbac SA Co.

            19.1.6.1. Overview

            19.1.6.2. Product Portfolio

            19.1.6.3. Profitability by Market Segments

            19.1.6.4. Sales Footprint

            19.1.6.5. Strategy Overview

                19.1.6.5.1. Marketing Strategy

                19.1.6.5.2. Product Strategy

                19.1.6.5.3. Channel Strategy

        19.1.7. Bayer AG

            19.1.7.1. Overview

            19.1.7.2. Product Portfolio

            19.1.7.3. Profitability by Market Segments

            19.1.7.4. Sales Footprint

            19.1.7.5. Strategy Overview

                19.1.7.5.1. Marketing Strategy

                19.1.7.5.2. Product Strategy

                19.1.7.5.3. Channel Strategy

        19.1.8. IDEXX Laboratories Co.

            19.1.8.1. Overview

            19.1.8.2. Product Portfolio

            19.1.8.3. Profitability by Market Segments

            19.1.8.4. Sales Footprint

            19.1.8.5. Strategy Overview

                19.1.8.5.1. Marketing Strategy

                19.1.8.5.2. Product Strategy

                19.1.8.5.3. Channel Strategy

        19.1.9. Covetrus Inc.

            19.1.9.1. Overview

            19.1.9.2. Product Portfolio

            19.1.9.3. Profitability by Market Segments

            19.1.9.4. Sales Footprint

            19.1.9.5. Strategy Overview

                19.1.9.5.1. Marketing Strategy

                19.1.9.5.2. Product Strategy

                19.1.9.5.3. Channel Strategy

        19.1.10. Dechra Pharmaceuticals PLC

            19.1.10.1. Overview

            19.1.10.2. Product Portfolio

            19.1.10.3. Profitability by Market Segments

            19.1.10.4. Sales Footprint

            19.1.10.5. Strategy Overview

                19.1.10.5.1. Marketing Strategy

                19.1.10.5.2. Product Strategy

                19.1.10.5.3. Channel Strategy

        19.1.11. Vetoquinol SA

            19.1.11.1. Overview

            19.1.11.2. Product Portfolio

            19.1.11.3. Profitability by Market Segments

            19.1.11.4. Sales Footprint

            19.1.11.5. Strategy Overview

                19.1.11.5.1. Marketing Strategy

                19.1.11.5.2. Product Strategy

                19.1.11.5.3. Channel Strategy

        19.1.12. Phibro Animal Health Co.

            19.1.12.1. Overview

            19.1.12.2. Product Portfolio

            19.1.12.3. Profitability by Market Segments

            19.1.12.4. Sales Footprint

            19.1.12.5. Strategy Overview

                19.1.12.5.1. Marketing Strategy

                19.1.12.5.2. Product Strategy

                19.1.12.5.3. Channel Strategy

        19.1.13. Kyoritsuseiyaku Co.

            19.1.13.1. Overview

            19.1.13.2. Product Portfolio

            19.1.13.3. Profitability by Market Segments

            19.1.13.4. Sales Footprint

            19.1.13.5. Strategy Overview

                19.1.13.5.1. Marketing Strategy

                19.1.13.5.2. Product Strategy

                19.1.13.5.3. Channel Strategy

        19.1.14. Krka, d. d., Novo Mesto

            19.1.14.1. Overview

            19.1.14.2. Product Portfolio

            19.1.14.3. Profitability by Market Segments

            19.1.14.4. Sales Footprint

            19.1.14.5. Strategy Overview

                19.1.14.5.1. Marketing Strategy

                19.1.14.5.2. Product Strategy

                19.1.14.5.3. Channel Strategy

        19.1.15. Sequent Scientific Ltd.

            19.1.15.1. Overview

            19.1.15.2. Product Portfolio

            19.1.15.3. Profitability by Market Segments

            19.1.15.4. Sales Footprint

            19.1.15.5. Strategy Overview

                19.1.15.5.1. Marketing Strategy

                19.1.15.5.2. Product Strategy

                19.1.15.5.3. Channel Strategy

        19.1.16. Heska Co.

            19.1.16.1. Overview

            19.1.16.2. Product Portfolio

            19.1.16.3. Profitability by Market Segments

            19.1.16.4. Sales Footprint

            19.1.16.5. Strategy Overview

                19.1.16.5.1. Marketing Strategy

                19.1.16.5.2. Product Strategy

                19.1.16.5.3. Channel Strategy

        19.1.17. Eco Animal Health Group

            19.1.17.1. Overview

            19.1.17.2. Product Portfolio

            19.1.17.3. Profitability by Market Segments

            19.1.17.4. Sales Footprint

            19.1.17.5. Strategy Overview

                19.1.17.5.1. Marketing Strategy

                19.1.17.5.2. Product Strategy

                19.1.17.5.3. Channel Strategy

20. Assumptions & Acronyms Used

21. Research Methodology
Recommendations

Food and Beverage

Pet Dietary Supplement Market

February 2021

REP-GB-12069

October 2023

325 pages

Consumer Product

Pet Care Market

July 2021

REP-GB-11841

August 2023

300 pages

Consumer Product

Pet Bathing Supplies Market

September 2022

REP-GB-15632

July 2023

333 pages

Consumer Product

Pet Toys Market

March 2021

REP-GB-12550

February 2023

321 pages

Explore Consumer Product Insights

View Reports
Future Market Insights

Pet OTC Medication Market