Pet Prebiotics Market Forecast and Outlook 2025 to 2035

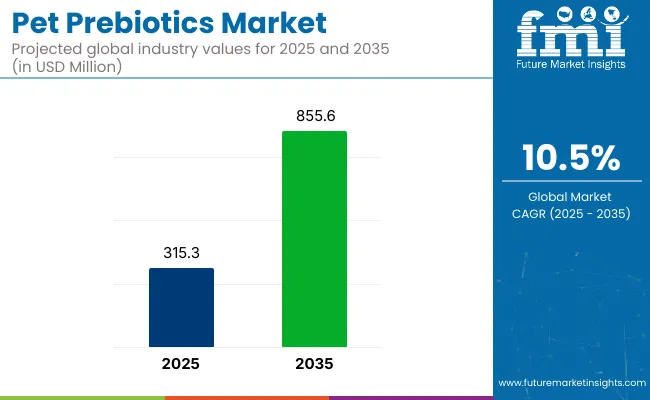
The global pet prebiotics market is valued at USD 315.3 million in 2025 and is expected to reach USD 855.6 million by 2035, reflecting a CAGR of 10.5%. Growth in this market is being driven by heightened consumer interest in digestive wellness, increased awareness around pet immunity, and the rising trend of pet humanization.
Quick Stats for Pet Prebiotics Market

  • Market Value (2025): USD 315.3 million
  • Forecast Value (2035): USD 855.6 million
  • Forecast CAGR: 10.5%
  • Form Leader in 2025: Chewables (38% Market Share)
  • Top Availability Segment: Over-the-Counter (OTC) (68% Market Share)
  • Key Growth Region: Asia-Pacific (fastest-growing market in Japan with 11.3% CAGR)

Pet Prebiotics Market

Metric Value Table

Attributes Description
Estimated Size (2025) USD 315.3 million
Projected Value (2035) USD 855.6 million
CAGR (2025 to 2035) 10.5%

Enhanced affordability, coupled with availability across a variety of formats, such as chewables, powders, and liquids, is encouraging adoption across diverse pet-owner demographics.

The USA is expected to retain the highest market share, growing at a CAGR of 10.2% from 2025 to 2035. Japan is set to be the fastest-growing country, expanding at a CAGR of 11.3%, followed closely by Germany at 9.7%. Chewables will remain the dominant form type due to their pet-friendly taste and convenience, projected to account for 38% of the market value by 2035. The over-the-counter (OTC) availability segment will maintain strong momentum with 68% of the market share.

The market holds a niche yet growing share within its parent segments. It accounts for approximately 8-10% of the pet supplements market, given its rising relevance in digestive health. Within the broader animal nutrition market, it holds around 3-4%, while contributing nearly 2% to the pet food market. Its share in the functional food ingredients market and digestive health ingredients market is under 1%, due to its pet-specific nature. As awareness of gut health increases, the pet prebiotics segment is expected to capture a larger portion, especially within pet supplements and companion animal health categories.

Pet Prebiotics Market Analysis by Top Investment Segments

The global market is segmented into pet type, form, availability, sales channel, nature, application, and region. By pet type, it includes dog and cat. By form, it is segmented into pills/tablets, chewables, powder, liquid/syrup, paste/gel, and others (includes sprinkles, wafers, & soft chews). By availability, it is divided into prescription-based and over-the-counter.

By sales channel, it is segmented into store-based retailing (hypermarkets/supermarkets, convenience stores, pet stores, discounters, independent grocery retailers, drugstores) and online retailers (company website, e-commerce platform, hyperlocal delivery).

By nature, it includes organic and conventional. By application, it is segmented into gastrointestinal health, immune system support, skin & coat health, stress & anxiety reduction, weight management, allergy management, dental health, and joint health. By region, it covers North America, Latin America, Western Europe, Eastern Europe, Balkans & Baltic, Russia & Belarus, Central Asia, East Asia, South Asia & Pacific, Middle East and Africa.

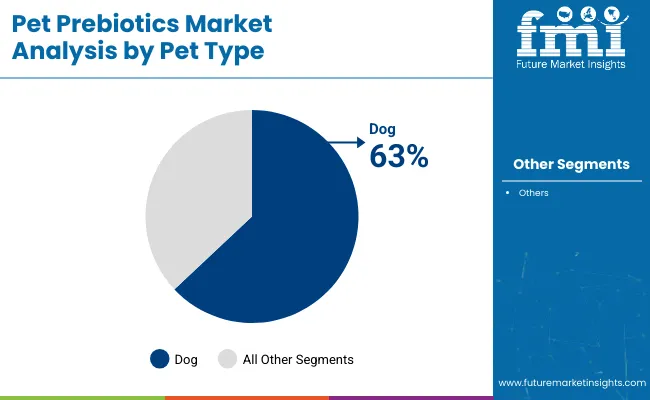
By Pet Type, Dog Segment Accounts for 63% of the Market Share

Dogs are expected to remain the most lucrative pet type in the global prebiotics market, driven by higher supplement adoption rates among dog owners. Digestive issues, immune health concerns, and proactive wellness routines are more commonly addressed in dogs, particularly in North America and Europe. By 2035, the dog segment is anticipated to hold over 63% of the total market share, bolstered by increased awareness and higher average spending per pet.
  • Dog owners are more inclined to use dietary supplements regularly
  • Premiumization trends in canine nutrition remain stronger than in feline nutrition

Pet Prebiotics Market Analysis By Pet Type

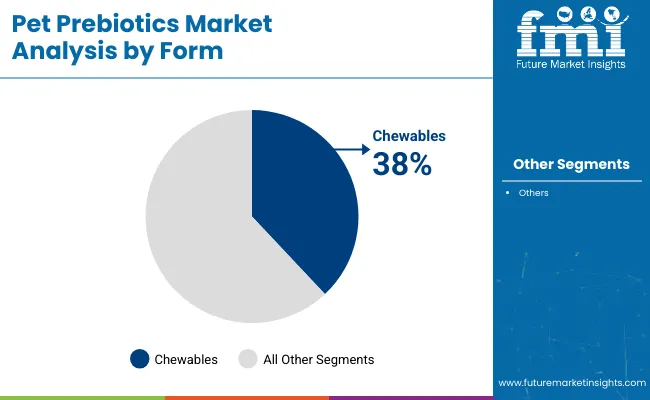
By Form, Chewables Account for 38% of the Market Share

Chewables are expected to maintain dominance in the form segment as they offer the highest convenience and compliance. Pets typically prefer tasty, treat-like formats, and owners find them easier to administer daily. By 2035, chewables are forecast to account for 38% of the market, outpacing other forms like powders and syrups due to their ease of use and formulation versatility.
  • Most suitable for picky eaters and small pets
  • Seen as functional treats rather than medication

Pet Prebiotics Market Analysis By Form

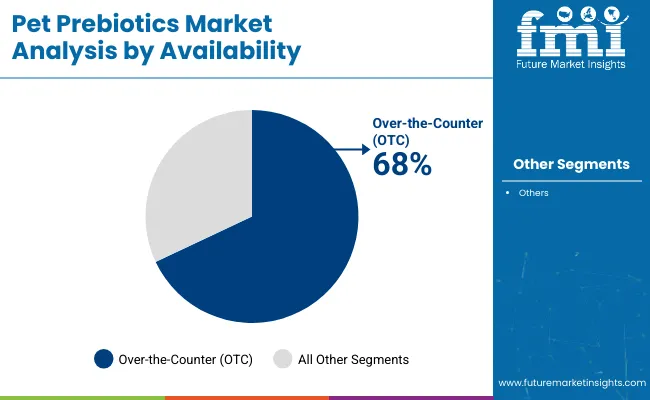
By Availability, the Over-the-Counter (OTC) Segment Accounts for 68% of the Market Share

Over-the-counter availability has significantly widened market access, enabling direct purchases from retail and online platforms without veterinary consultations. This channel is projected to capture 68% of total sales by 2035. Rising consumer autonomy in pet healthcare and digital retail expansion have made OTC formats more appealing for routine supplementation.
  • Enhances consumer control over pet health routines
  • Boosted by online subscription and auto-delivery models

Pet Prebiotics Market Analysis By Availability

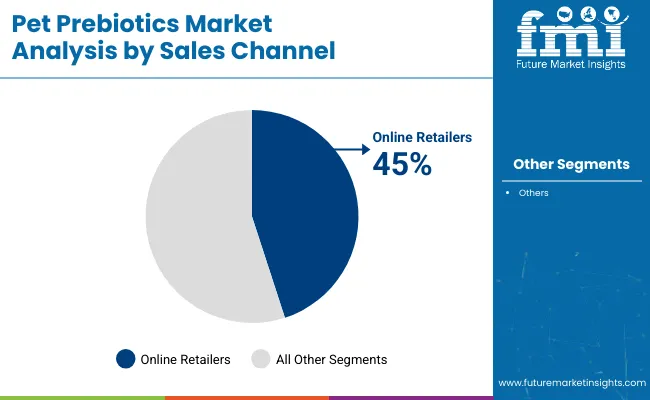
By Sales Channel, Online Retailers Account for 45% of the Market Share

Online retailing is witnessing exponential growth, fueled by e-commerce platforms and hyperlocal delivery services. With pet owners seeking convenience and product comparisons, digital channels are expected to outperform physical stores. By 2035, e-commerce is estimated to contribute over 45% of total sales.
  • Enables subscription models and bulk discounts
  • Convenient delivery drives loyalty and repeat purchase

Pet Prebiotics Market Analysis By Sales Channel

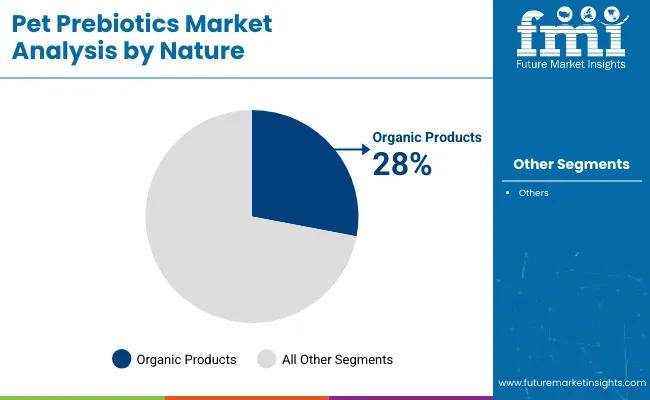
By Nature, Organic Products Account for 28% of the Market Share

While conventional prebiotics still dominate, organic variants are growing rapidly in response to consumer demand for clean-label and ethically sourced products. By 2035, organic prebiotics are expected to account for nearly 28% of the total market. Their appeal lies in the absence of additives and synthetic carriers.
  • Align with pet owners’ preference for natural wellness
  • Higher margins make them attractive for manufacturers

Pet Prebiotics Market Analysis By Nature

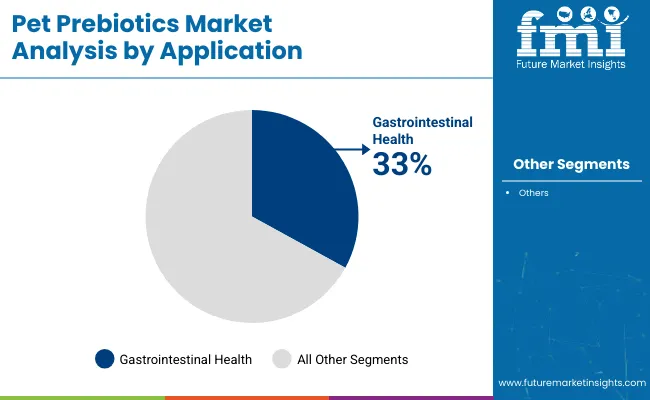
By Application, the Gastrointestinal Health Segment Accounts for 33% of the Market Share

Gastrointestinal health will continue to be the most common application of pet prebiotics, representing approximately 33% of total demand by 2035. With rising cases of digestive issues in pets and growing scientific validation of prebiotics’ efficacy, this segment is expected to experience significant growth.
  • Strong scientific backing encourages veterinary recommendations
  • Digestive support is seen as foundational to overall health

Pet Prebiotics Market Analysis By Application

Top Pet Prebiotics Market Dynamics

Recent Trends in the Pet Prebiotics Market

  • Increased adoption of chewable and flavored formats to improve compliance among pets.
  • Surge in e-commerce sales, driven by subscription models and doorstep delivery.

Key Challenges Restraining Pet Prebiotics Market Growth
  • Limited awareness among pet owners in developing regions about prebiotics.
  • High price sensitivity in low-income markets hampers premium product penetration.

Analyzing Top Countries Manufacturing and Supplying Pet Prebiotics

Pet Prebiotics Market Country Wise Analysis

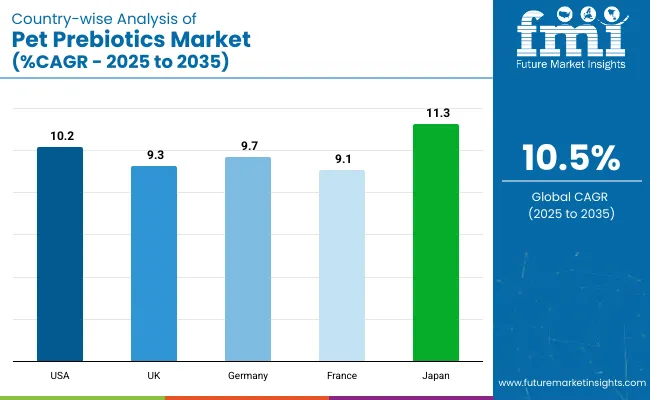
In the pet prebiotics market, Japan leads with the highest forecasted CAGR of 11.3% from 2025 to 2035, driven by the aging pet population and demand for premium, functional supplements. The USA follows closely with a 10.2% CAGR, backed by robust e-commerce and high consumer spending.

Germany is projected to grow at 9.7%, reflecting strong regulatory standards and clinical preference. The UK is anticipated to see growth at a 9.3% CAGR, shaped by demand for natural, cruelty-free products. France trails slightly at 9.1%, fueled by rising interest in plant-based and allergen-free supplements. All countries reflect strong trends toward wellness and preventive pet care.

The report covers an in-depth analysis of 40+ countries; five top-performing OECD countries are highlighted below.

United States Pet Prebiotics Market Analysis

The pet prebiotics revenue in the USA is projected to grow at a CAGR of 10.2% from 2025 to 2035, maintaining its position as the global leader with a forecasted 31.2% market share. This dominance is fueled by strong pet ownership rates, well-established veterinary infrastructure, and premiumization of pet wellness products.

  • High spending on pet supplements across all income brackets.
  • Dense retail and e-commerce infrastructure supports rapid product reach.
  • Innovation driven by aggressive R&D and brand diversification.

Pet Prebiotics Demand Analysis in the UK

In the UK, the pet prebiotics market is anticipated to expand at a CAGR of 9.3% through 2035, driven by a nationwide shift toward natural and additive-free pet supplements. British consumers are increasingly focusing on preventive care and overall wellness for pets.

  • Natural product awareness is shaping brand choices and loyalty.
  • Pet owners prefer cruelty-free and eco-labeled products.
  • Online sales growth is outpacing traditional retail channels.

Germany Pet Prebiotics Sales Analysis

The sales of pet prebiotics in Germany are forecasted to flourish at a CAGR of 9.7% from 2025 to 2035, supported by robust veterinary regulation and increasing pet adoption across urban households. German consumers are highly informed and prefer prebiotics with clinically backed efficacy.

  • Preference for certified, science-backed supplements.
  • High consumer trust in EU-compliant product standards.
  • Growing demand for gut health support in senior pets.

Pet Prebiotics Demand Analysis in France

The revenue from pet prebiotics in France is projected to rise at a CAGR of 9.1% between 2025 and 2035 in the pet prebiotics landscape. The country is witnessing a surge in demand for plant-based, allergen-free prebiotics as part of broader wellness trends in both human and animal nutrition.

  • Increasing preference for non-GMO, vegan-friendly pet supplements.
  • Expansion of urban pet clinics and holistic vet practices.
  • Rapid digitization in pet product retail following the pandemic.

Japan Pet Prebiotics Market Analysis

The pet prebiotics market in Japan is expected to exhibit the fastest growth at a CAGR of 11.3% from 2025 to 2035 in the global pet prebiotics market. The country’s aging pet population and rising incidence of chronic digestive issues have amplified interest in gut-focused supplements.

  • Aging pet demographics are driving digestive and immune health needs.
  • Strong consumer trust in Japan-made, high-purity formulations.
  • Rising adoption of subscription-based supplement services.

Leading Pet Prebiotics Suppliers

The market is moderately consolidated, with a few global leaders accounting for a significant share of revenues. Tier-one companies like Alltech, DSM Nutritional Products AG, Vetanco, Nestlé Purina PetCare, Mars Petcare, Hill’s Pet Nutrition, Blue Buffalo, Royal Canin, Chr. Hansen and Beneo are competing based on innovation, strategic partnerships, and expansion into emerging markets. These companies focus on enhancing product efficacy, expanding distribution channels, and investing in research and development to meet the growing demand for pet health supplements.

Recent Pet Prebiotics Industry News

  • In February 2025, Colgate-Palmolive Company unveiled to acquire Prime100 pet food brand. This move helped its Hill’s Pet Nutrition division enter fast-growing fresh pet food category.

Pet Prebiotics Market Report Scope

Report Attributes Details
Current Total Market Size (2025) USD 315.3 million
Projected Market Size (2035) USD 855.6 million
CAGR (2025 to 2035) 10.5%
Base Year for Estimation 2024
Historical Period 2020-2023
Projections Period 2025-2035
Market Analysis Parameters Revenue in USD millions/Volume in units
By Pet Type Dog, Cat
By Form Pills/Tablets, Chewables, Powder, Liquid/Syrup, Paste/Gel, Others
By Availability Prescription-based, Over-the-counter (OTC)
By Sales Channel Store-based Retailing, Online Retailers
By Nature Organic, Conventional
By Application Gastrointestinal Health, Immune System Support, Skin & Coat Health, Stress & Anxiety Reduction, Weight Management, Allergy Management, Dental Health, Joint Health
Regions Covered North America, Latin America, Western Europe, Eastern Europe, East Asia, South Asia & Pacific, Middle East & Africa
Countries Covered United States, Canada, United Kingdom, Germany, France, China, Japan, South Korea, Brazil, Australia
Key Players Alltech, Inc., DSM Nutritional Products AG, Vetanco, Nestlé Purina PetCare, Mars Petcare, Hill’s Pet Nutrition, Blue Buffalo, Royal Canin, Chr. Hansen, Beneo
Additional Attributes Dollar sales by value, market share analysis by region, and country-wise analysis

Top Investment Segments Studied in the Pet Prebiotics Market

By Pet Type:

As per Pet Type, the industry has been categorized into Dog & Cat.

By Form:

As per Form, the industry has been categorized into Pills / Tablets, Chewables, Powder, Liquid / Syrup, Paste / Gel and Others.

By Availability:

As per Availability, the industry has been categorized into Prescription-based and Over-the-counter (OTC).

By Sales Channel:

As per Sales Channel, the industry has been categorized into Store-based Retailing (Hypermarkets/Supermarkets, Convenience Stores, Pet Stores, Discounters, Independent Grocery Retailers, Drugstores) and Online Retailers (Company Website, E-commerce Platform, Hyperlocal Delivery).

By Nature:

As per Nature, the industry has been categorized into Organic and Conventional.

By Application:

As per Application, the industry has been categorized into Gastrointestinal Health, Immune System Support, Skin & Coat Health, Stress & Anxiety Reduction, Weight Management, Allergy Management, Dental Health and Joint Health.

By Region:

Industry analysis has been carried out in key countries of North America, Latin America, Western Europe Eastern Europe, Balkans & Baltic, Russia & Belarus, Central Asia, East Asia, South Asia & Pacific, and Middle East & Africa.

Table of Content

  1. Executive Summary
    • Global Market Outlook
    • Demand-side Trends
    • Supply-side Trends
    • Technology Roadmap Analysis
    • Analysis and Recommendations
  2. Market Overview
    • Market Coverage / Taxonomy
    • Market Definition / Scope / Limitations
  3. Market Background
    • Market Dynamics
      • Drivers
      • Restraints
      • Opportunity
      • Trends
    • Scenario Forecast
      • Demand in Optimistic Scenario
      • Demand in Likely Scenario
      • Demand in Conservative Scenario
    • Opportunity Map Analysis
    • Product Life Cycle Analysis
    • Supply Chain Analysis
      • Supply Side Participants and their Roles
        • Producers
        • Mid-Level Participants (Traders/ Agents/ Brokers)
        • Wholesalers and Distributors
      • Value Added and Value Created at Node in the Supply Chain
      • List of Raw Material Suppliers
      • List of Existing and Potential Buyer’s
    • Investment Feasibility Matrix
    • Value Chain Analysis
      • Profit Margin Analysis
      • Wholesalers and Distributors
      • Retailers
    • PESTLE and Porter’s Analysis
    • Regulatory Landscape
      • By Key Regions
      • By Key Countries
    • Regional Parent Market Outlook
    • Production and Consumption Statistics
    • Import and Export Statistics
  4. Global Market Analysis 2020 to 2024 and Forecast, 2025 to 2035
    • Historical Market Size Value (USD Million) & Volume (units) Analysis, 2020 to 2024
    • Current and Future Market Size Value (USD Million) & Volume (units) Projections, 2025 to 2035
      • Y-o-Y Growth Trend Analysis
      • Absolute $ Opportunity Analysis
  5. Global Market Pricing Analysis 2020 to 2024 and Forecast 2025 to 2035
  6. Global Market Analysis 2020 to 2024 and Forecast 2025 to 2035, By Pet Type
    • Introduction / Key Findings
    • Historical Market Size Value (USD Million) & Volume (units) Analysis By Pet Type, 2020 to 2024
    • Current and Future Market Size Value (USD Million) & Volume (units) Analysis and Forecast By Pet Type, 2025 to 2035
      • Dog
      • Cat
    • Y-o-Y Growth Trend Analysis By Pet Type, 2020 to 2024
    • Absolute $ Opportunity Analysis By Pet Type, 2025 to 2035
  7. Global Market Analysis 2020 to 2024 and Forecast 2025 to 2035, By Form
    • Introduction / Key Findings
    • Historical Market Size Value (USD Million) & Volume (units) Analysis By Form, 2020 to 2024
    • Current and Future Market Size Value (USD Million) & Volume (units) Analysis and Forecast By Form, 2025 to 2035
      • Pills/Tablets
      • Chewables
      • Powder
      • Liquid/Syrup
      • Paste/Gel
      • Others
    • Y-o-Y Growth Trend Analysis By Form, 2020 to 2024
    • Absolute $ Opportunity Analysis By Form, 2025 to 2035
  8. Global Market Analysis 2020 to 2024 and Forecast 2025 to 2035, By Availability
    • Introduction / Key Findings
    • Historical Market Size Value (USD Million) & Volume (units) Analysis By Availability, 2020 to 2024
    • Current and Future Market Size Value (USD Million) & Volume (units) Analysis and Forecast By Availability, 2025 to 2035
      • Prescription-Based
      • Over-the-counter (OTC)
    • Y-o-Y Growth Trend Analysis By Availability, 2020 to 2024
    • Absolute $ Opportunity Analysis By Availability, 2025 to 2035
  9. Global Market Analysis 2020 to 2024 and Forecast 2025 to 2035, By Sales Channel
    • Introduction / Key Findings
    • Historical Market Size Value (USD Million) & Volume (units) Analysis By Sales Channel, 2020 to 2024
    • Current and Future Market Size Value (USD Million) & Volume (units) Analysis and Forecast By Sales Channel, 2025 to 2035
      • Store-based Retailing
        • Hypermarkets/Supermarkets
        • Convenience Stores
        • Pet Stores
        • Discounters
        • Independent Grocery Retailers
        • Drugstores
      • Online Retailers
        • Company Website
        • E-commerce Platform
        • Hyperlocal Delivery
    • Y-o-Y Growth Trend Analysis By Sales Channel, 2020 to 2024
    • Absolute $ Opportunity Analysis By Sales Channel, 2025 to 2035
  10. Global Market Analysis 2020 to 2024 and Forecast 2025 to 2035, By Nature
    • Introduction / Key Findings
    • Historical Market Size Value (USD Million) & Volume (units) Analysis By Nature, 2020 to 2024
    • Current and Future Market Size Value (USD Million) & Volume (units) Analysis and Forecast By Nature, 2025 to 2035
      • Organic
      • Conventional
    • Y-o-Y Growth Trend Analysis By Nature, 2020 to 2024
    • Absolute $ Opportunity Analysis By Nature, 2025 to 2035
  11. Global Market Analysis 2020 to 2024 and Forecast 2025 to 2035, By Application
    • Introduction / Key Findings
    • Historical Market Size Value (USD Million) & Volume (units) Analysis By Application, 2020 to 2024
    • Current and Future Market Size Value (USD Million) & Volume (units) Analysis and Forecast By Application, 2025 to 2035
      • Gastrointestinal Health
      • Immune System Support
      • Skin & Coat Health
      • Stress & Anxiety Reduction
      • Weight Management
      • Allergy Management
      • Dental Health
      • Joint Health
    • Y-o-Y Growth Trend Analysis By Application, 2020 to 2024
    • Absolute $ Opportunity Analysis By Application, 2025 to 2035
  12. Global Market Analysis 2020 to 2024 and Forecast 2025 to 2035, By Region
    • Introduction
    • Historical Market Size Value (USD Million) & Volume (units) Analysis By Region, 2020 to 2024
    • Current Market Size Value (USD Million) & Volume (units) Analysis and Forecast By Region, 2025 to 2035
      • North America
      • Latin America
      • Western Europe
      • Eastern Europe
      • East Asia
      • South Asia & Pacific
      • Middle East and Africa
    • Market Attractiveness Analysis By Region
  13. North America Market Analysis 2020 to 2024 and Forecast 2025 to 2035, By Country
    • Historical Market Size Value (USD Million) & Volume (units) Trend Analysis By Market Taxonomy, 2020 to 2024
    • Market Size Value (USD Million) & Volume (units) Forecast By Market Taxonomy, 2025 to 2035
      • By Country
        • USA
        • Canada
        • Mexico
      • By Pet Type
      • By Form
      • By Availability
      • By Sales Channel
      • By Nature
      • By Application
    • Market Attractiveness Analysis
      • By Country
      • By Pet Type
      • By Form
      • By Availability
      • By Sales Channel
      • By Nature
      • By Application
    • Key Takeaways
  14. Latin America Market Analysis 2020 to 2024 and Forecast 2025 to 2035, By Country
    • Historical Market Size Value (USD Million) & Volume (units) Trend Analysis By Market Taxonomy, 2020 to 2024
    • Market Size Value (USD Million) & Volume (units) Forecast By Market Taxonomy, 2025 to 2035
      • By Country
        • Brazil
        • Argentina
        • Rest of LATAM
      • By Pet Type
      • By Form
      • By Availability
      • By Sales Channel
      • By Nature
      • By Application
    • Market Attractiveness Analysis
      • By Country
      • By Pet Type
      • By Form
      • By Availability
      • By Sales Channel
      • By Nature
      • By Application
    • Key Takeaways
  15. Western Europe Market Analysis 2020 to 2024 and Forecast 2025 to 2035, By Country
    • Historical Market Size Value (USD Million) & Volume (units) Trend Analysis By Market Taxonomy, 2020 to 2024
    • Market Size Value (USD Million) & Volume (units) Forecast By Market Taxonomy, 2025 to 2035
      • By Country
        • Germany
        • Italy
        • France
        • UK
        • Spain
        • BENELUX
        • Nordic
        • Rest of W.Europe
      • By Pet Type
      • By Form
      • By Availability
      • By Sales Channel
      • By Nature
      • By Application
    • Market Attractiveness Analysis
      • By Country
      • By Pet Type
      • By Form
      • By Availability
      • By Sales Channel
      • By Nature
      • By Application
    • Key Takeaways
  16. Eastern Europe Market Analysis 2020 to 2024 and Forecast 2025 to 2035, By Country
    • Historical Market Size Value (USD Million) & Volume (units) Trend Analysis By Market Taxonomy, 2020 to 2024
    • Market Size Value (USD Million) & Volume (units) Forecast By Market Taxonomy, 2025 to 2035
      • By Country
        • Russia
        • Hungary
        • Poland
        • Balkan & Baltics
        • Rest of E. Europe
      • By Pet Type
      • By Form
      • By Availability
      • By Sales Channel
      • By Nature
      • By Application
    • Market Attractiveness Analysis
      • By Country
      • By Pet Type
      • By Form
      • By Availability
      • By Sales Channel
      • By Nature
      • By Application
    • Key Takeaways
  17. East Asia Market Analysis 2020 to 2024 and Forecast 2025 to 2035, By Country
    • Historical Market Size Value (USD Million) & Volume (units) Trend Analysis By Market Taxonomy, 2020 to 2024
    • Market Size Value (USD Million) & Volume (units) Forecast By Market Taxonomy, 2025 to 2035
      • By Country
        • China
        • Japan
        • South Korea
      • By Pet Type
      • By Form
      • By Availability
      • By Sales Channel
      • By Nature
      • By Application
    • Market Attractiveness Analysis
      • By Country
      • By Pet Type
      • By Form
      • By Availability
      • By Sales Channel
      • By Nature
      • By Application
    • Key Takeaways
  18. South Asia & Pacific Market Analysis 2020 to 2024 and Forecast 2025 to 2035, By Country
    • Historical Market Size Value (USD Million) & Volume (units) Trend Analysis By Market Taxonomy, 2020 to 2024
    • Market Size Value (USD Million) & Volume (units) Forecast By Market Taxonomy, 2025 to 2035
      • By Country
        • India
        • Australia & New Zealand
        • ASEAN
        • Rest of SAP
      • By Pet Type
      • By Form
      • By Availability
      • By Sales Channel
      • By Nature
      • By Application
    • Market Attractiveness Analysis
      • By Country
      • By Pet Type
      • By Form
      • By Availability
      • By Sales Channel
      • By Nature
      • By Application
    • Key Takeaways
  19. Middle East and Africa Market Analysis 2020 to 2024 and Forecast 2025 to 2035, By Country
    • Historical Market Size Value (USD Million) & Volume (units) Trend Analysis By Market Taxonomy, 2020 to 2024
    • Market Size Value (USD Million) & Volume (units) Forecast By Market Taxonomy, 2025 to 2035
      • By Country
        • GCC Countries
        • Northern Africa
        • South Africa
        • Turkiye
        • Rest of MEA
      • By Pet Type
      • By Form
      • By Availability
      • By Sales Channel
      • By Nature
      • By Application
    • Market Attractiveness Analysis
      • By Country
      • By Pet Type
      • By Form
      • By Availability
      • By Sales Channel
      • By Nature
      • By Application
    • Key Takeaways
  20. Key Countries Market Analysis
    • USA
      • Pricing Analysis
      • Market Share Analysis, 2024
        • By Pet Type
        • By Form
        • By Availability
        • By Sales Channel
        • By Nature
        • By Application
    • Canada
      • Pricing Analysis
      • Market Share Analysis, 2024
        • By Pet Type
        • By Form
        • By Availability
        • By Sales Channel
        • By Nature
        • By Application
    • Brazil
      • Pricing Analysis
      • Market Share Analysis, 2024
        • By Pet Type
        • By Form
        • By Availability
        • By Sales Channel
        • By Nature
        • By Application
    • Mexico
      • Pricing Analysis
      • Market Share Analysis, 2024
        • By Pet Type
        • By Form
        • By Availability
        • By Sales Channel
        • By Nature
        • By Application
    • Argentina
      • Pricing Analysis
      • Market Share Analysis, 2024
        • By Pet Type
        • By Form
        • By Availability
        • By Sales Channel
        • By Nature
        • By Application
  21. Market Structure Analysis
    • Competition Dashboard
    • Competition Benchmarking
    • Market Share Analysis of Top Players
      • By Regional
      • By Pet Type
      • By Form
      • By Availability
      • By Sales Channel
      • By Nature
      • By Application
  22. Competition Analysis
    • Competition Deep Dive
      • Alltech, Inc
        • Overview
        • Product Portfolio
        • Profitability by Market Segments (Product/Age /Sales Channel/Region)
        • Sales Footprint
        • Strategy Overview
          • Marketing Strategy
          • Product Strategy
          • Channel Strategy
      • DSM Nutritional Products AG
        • Overview
        • Product Portfolio
        • Profitability by Market Segments (Product/Age /Sales Channel/Region)
        • Sales Footprint
        • Strategy Overview
          • Marketing Strategy
          • Product Strategy
          • Channel Strategy
      • Vetanco
        • Overview
        • Product Portfolio
        • Profitability by Market Segments (Product/Age /Sales Channel/Region)
        • Sales Footprint
        • Strategy Overview
          • Marketing Strategy
          • Product Strategy
          • Channel Strategy
      • Nestlé Purina PetCare
        • Overview
        • Product Portfolio
        • Profitability by Market Segments (Product/Age /Sales Channel/Region)
        • Sales Footprint
        • Strategy Overview
          • Marketing Strategy
          • Product Strategy
          • Channel Strategy
      • Mars Petcare
        • Overview
        • Product Portfolio
        • Profitability by Market Segments (Product/Age /Sales Channel/Region)
        • Sales Footprint
        • Strategy Overview
          • Marketing Strategy
          • Product Strategy
          • Channel Strategy
      • Hill’s Pet Nutrition
        • Overview
        • Product Portfolio
        • Profitability by Market Segments (Product/Age /Sales Channel/Region)
        • Sales Footprint
        • Strategy Overview
          • Marketing Strategy
          • Product Strategy
          • Channel Strategy
      • Blue Buffalo
        • Overview
        • Product Portfolio
        • Profitability by Market Segments (Product/Age /Sales Channel/Region)
        • Sales Footprint
        • Strategy Overview
          • Marketing Strategy
          • Product Strategy
          • Channel Strategy
      • Royal Canin
        • Overview
        • Product Portfolio
        • Profitability by Market Segments (Product/Age /Sales Channel/Region)
        • Sales Footprint
        • Strategy Overview
          • Marketing Strategy
          • Product Strategy
          • Channel Strategy
      • Chr. Hansen
        • Overview
        • Product Portfolio
        • Profitability by Market Segments (Product/Age /Sales Channel/Region)
        • Sales Footprint
        • Strategy Overview
          • Marketing Strategy
          • Product Strategy
          • Channel Strategy
      • Beneo
        • Overview
        • Product Portfolio
        • Profitability by Market Segments (Product/Age /Sales Channel/Region)
        • Sales Footprint
        • Strategy Overview
          • Marketing Strategy
          • Product Strategy
          • Channel Strategy
      • Others
        • Overview
        • Product Portfolio
        • Profitability by Market Segments (Product/Age /Sales Channel/Region)
        • Sales Footprint
        • Strategy Overview
          • Marketing Strategy
          • Product Strategy
          • Channel Strategy
  23. Assumptions & Acronyms Used
  24. Research Methodology

List of Tables

  • Table 1: Global Market Value (USD Million) Forecast by Region, 2020-2035
  • Table 2: Global Market Volume (units) Forecast by Region, 2020-2035
  • Table 3: Global Market Value (USD Million) Forecast by Pet Type, 2020-2035
  • Table 4: Global Market Volume (units) Forecast by Pet Type, 2020-2035
  • Table 5: Global Market Value (USD Million) Forecast by Form, 2020-2035
  • Table 6: Global Market Volume (units) Forecast by Form, 2020-2035
  • Table 7: Global Market Value (USD Million) Forecast by Availability, 2020-2035
  • Table 8: Global Market Volume (units) Forecast by Availability, 2020-2035
  • Table 9: Global Market Value (USD Million) Forecast by Sales Channel, 2020-2035
  • Table 10: Global Market Volume (units) Forecast by Sales Channel, 2020-2035
  • Table 11: Global Market Value (USD Million) Forecast by Nature, 2020-2035
  • Table 12: Global Market Volume (units) Forecast by Nature, 2020-2035
  • Table 13: Global Market Value (USD Million) Forecast by Application, 2020-2035
  • Table 14: Global Market Volume (units) Forecast by Application, 2020-2035
  • Table 15: North America Market Value (USD Million) Forecast by Country, 2020-2035
  • Table 16: North America Market Volume (units) Forecast by Country, 2020-2035
  • Table 17: North America Market Value (USD Million) Forecast by Pet Type, 2020-2035
  • Table 18: North America Market Volume (units) Forecast by Pet Type, 2020-2035
  • Table 19: North America Market Value (USD Million) Forecast by Form, 2020-2035
  • Table 20: North America Market Volume (units) Forecast by Form, 2020-2035
  • Table 21: North America Market Value (USD Million) Forecast by Availability, 2020-2035
  • Table 22: North America Market Volume (units) Forecast by Availability, 2020-2035
  • Table 23: North America Market Value (USD Million) Forecast by Sales Channel, 2020-2035
  • Table 24: North America Market Volume (units) Forecast by Sales Channel, 2020-2035
  • Table 25: North America Market Value (USD Million) Forecast by Nature, 2020-2035
  • Table 26: North America Market Volume (units) Forecast by Nature, 2020-2035
  • Table 27: North America Market Value (USD Million) Forecast by Application, 2020-2035
  • Table 28: North America Market Volume (units) Forecast by Application, 2020-2035
  • Table 29: Latin America Market Value (USD Million) Forecast by Country, 2020-2035
  • Table 30: Latin America Market Volume (units) Forecast by Country, 2020-2035
  • Table 31: Latin America Market Value (USD Million) Forecast by Pet Type, 2020-2035
  • Table 32: Latin America Market Volume (units) Forecast by Pet Type, 2020-2035
  • Table 33: Latin America Market Value (USD Million) Forecast by Form, 2020-2035
  • Table 34: Latin America Market Volume (units) Forecast by Form, 2020-2035
  • Table 35: Latin America Market Value (USD Million) Forecast by Availability, 2020-2035
  • Table 36: Latin America Market Volume (units) Forecast by Availability, 2020-2035
  • Table 37: Latin America Market Value (USD Million) Forecast by Sales Channel, 2020-2035
  • Table 38: Latin America Market Volume (units) Forecast by Sales Channel, 2020-2035
  • Table 39: Latin America Market Value (USD Million) Forecast by Nature, 2020-2035
  • Table 40: Latin America Market Volume (units) Forecast by Nature, 2020-2035
  • Table 41: Latin America Market Value (USD Million) Forecast by Application, 2020-2035
  • Table 42: Latin America Market Volume (units) Forecast by Application, 2020-2035
  • Table 43: Western Europe Market Value (USD Million) Forecast by Country, 2020-2035
  • Table 44: Western Europe Market Volume (units) Forecast by Country, 2020-2035
  • Table 45: Western Europe Market Value (USD Million) Forecast by Pet Type, 2020-2035
  • Table 46: Western Europe Market Volume (units) Forecast by Pet Type, 2020-2035
  • Table 47: Western Europe Market Value (USD Million) Forecast by Form, 2020-2035
  • Table 48: Western Europe Market Volume (units) Forecast by Form, 2020-2035
  • Table 49: Western Europe Market Value (USD Million) Forecast by Availability, 2020-2035
  • Table 50: Western Europe Market Volume (units) Forecast by Availability, 2020-2035
  • Table 51: Western Europe Market Value (USD Million) Forecast by Sales Channel, 2020-2035
  • Table 52: Western Europe Market Volume (units) Forecast by Sales Channel, 2020-2035
  • Table 53: Western Europe Market Value (USD Million) Forecast by Nature, 2020-2035
  • Table 54: Western Europe Market Volume (units) Forecast by Nature, 2020-2035
  • Table 55: Western Europe Market Value (USD Million) Forecast by Application, 2020-2035
  • Table 56: Western Europe Market Volume (units) Forecast by Application, 2020-2035
  • Table 57: Eastern Europe Market Value (USD Million) Forecast by Country, 2020-2035
  • Table 58: Eastern Europe Market Volume (units) Forecast by Country, 2020-2035
  • Table 59: Eastern Europe Market Value (USD Million) Forecast by Pet Type, 2020-2035
  • Table 60: Eastern Europe Market Volume (units) Forecast by Pet Type, 2020-2035
  • Table 61: Eastern Europe Market Value (USD Million) Forecast by Form, 2020-2035
  • Table 62: Eastern Europe Market Volume (units) Forecast by Form, 2020-2035
  • Table 63: Eastern Europe Market Value (USD Million) Forecast by Availability, 2020-2035
  • Table 64: Eastern Europe Market Volume (units) Forecast by Availability, 2020-2035
  • Table 65: Eastern Europe Market Value (USD Million) Forecast by Sales Channel, 2020-2035
  • Table 66: Eastern Europe Market Volume (units) Forecast by Sales Channel, 2020-2035
  • Table 67: Eastern Europe Market Value (USD Million) Forecast by Nature, 2020-2035
  • Table 68: Eastern Europe Market Volume (units) Forecast by Nature, 2020-2035
  • Table 69: Eastern Europe Market Value (USD Million) Forecast by Application, 2020-2035
  • Table 70: Eastern Europe Market Volume (units) Forecast by Application, 2020-2035
  • Table 71: East Asia Market Value (USD Million) Forecast by Country, 2020-2035
  • Table 72: East Asia Market Volume (units) Forecast by Country, 2020-2035
  • Table 73: East Asia Market Value (USD Million) Forecast by Pet Type, 2020-2035
  • Table 74: East Asia Market Volume (units) Forecast by Pet Type, 2020-2035
  • Table 75: East Asia Market Value (USD Million) Forecast by Form, 2020-2035
  • Table 76: East Asia Market Volume (units) Forecast by Form, 2020-2035
  • Table 77: East Asia Market Value (USD Million) Forecast by Availability, 2020-2035
  • Table 78: East Asia Market Volume (units) Forecast by Availability, 2020-2035
  • Table 79: East Asia Market Value (USD Million) Forecast by Sales Channel, 2020-2035
  • Table 80: East Asia Market Volume (units) Forecast by Sales Channel, 2020-2035
  • Table 81: East Asia Market Value (USD Million) Forecast by Nature, 2020-2035
  • Table 82: East Asia Market Volume (units) Forecast by Nature, 2020-2035
  • Table 83: East Asia Market Value (USD Million) Forecast by Application, 2020-2035
  • Table 84: East Asia Market Volume (units) Forecast by Application, 2020-2035
  • Table 85: South Asia & Pacific Market Value (USD Million) Forecast by Country, 2020-2035
  • Table 86: South Asia & Pacific Market Volume (units) Forecast by Country, 2020-2035
  • Table 87: South Asia & Pacific Market Value (USD Million) Forecast by Pet Type, 2020-2035
  • Table 88: South Asia & Pacific Market Volume (units) Forecast by Pet Type, 2020-2035
  • Table 89: South Asia & Pacific Market Value (USD Million) Forecast by Form, 2020-2035
  • Table 90: South Asia & Pacific Market Volume (units) Forecast by Form, 2020-2035
  • Table 91: South Asia & Pacific Market Value (USD Million) Forecast by Availability, 2020-2035
  • Table 92: South Asia & Pacific Market Volume (units) Forecast by Availability, 2020-2035
  • Table 93: South Asia & Pacific Market Value (USD Million) Forecast by Sales Channel, 2020-2035
  • Table 94: South Asia & Pacific Market Volume (units) Forecast by Sales Channel, 2020-2035
  • Table 95: South Asia & Pacific Market Value (USD Million) Forecast by Nature, 2020-2035
  • Table 96: South Asia & Pacific Market Volume (units) Forecast by Nature, 2020-2035
  • Table 97: South Asia & Pacific Market Value (USD Million) Forecast by Application, 2020-2035
  • Table 98: South Asia & Pacific Market Volume (units) Forecast by Application, 2020-2035
  • Table 99: Middle East and Africa Market Value (USD Million) Forecast by Country, 2020-2035
  • Table 100: Middle East and Africa Market Volume (units) Forecast by Country, 2020-2035
  • Table 101: Middle East and Africa Market Value (USD Million) Forecast by Pet Type, 2020-2035
  • Table 102: Middle East and Africa Market Volume (units) Forecast by Pet Type, 2020-2035
  • Table 103: Middle East and Africa Market Value (USD Million) Forecast by Form, 2020-2035
  • Table 104: Middle East and Africa Market Volume (units) Forecast by Form, 2020-2035
  • Table 105: Middle East and Africa Market Value (USD Million) Forecast by Availability, 2020-2035
  • Table 106: Middle East and Africa Market Volume (units) Forecast by Availability, 2020-2035
  • Table 107: Middle East and Africa Market Value (USD Million) Forecast by Sales Channel, 2020-2035
  • Table 108: Middle East and Africa Market Volume (units) Forecast by Sales Channel, 2020-2035
  • Table 109: Middle East and Africa Market Value (USD Million) Forecast by Nature, 2020-2035
  • Table 110: Middle East and Africa Market Volume (units) Forecast by Nature, 2020-2035
  • Table 111: Middle East and Africa Market Value (USD Million) Forecast by Application, 2020-2035
  • Table 112: Middle East and Africa Market Volume (units) Forecast by Application, 2020-2035

List of Figures

  • Figure 1: Global Market Volume (units) Forecast 2020-2035
  • Figure 2: Global Market Pricing Analysis
  • Figure 3: Global Market Value (USD Million) Forecast 2020-2035
  • Figure 4: Global Market Value Share and BPS Analysis by Pet Type, 2025 and 2035
  • Figure 5: Global Market Y-o-Y Growth Comparison by Pet Type, 2025-2035
  • Figure 6: Global Market Attractiveness Analysis by Pet Type
  • Figure 7: Global Market Value Share and BPS Analysis by Form, 2025 and 2035
  • Figure 8: Global Market Y-o-Y Growth Comparison by Form, 2025-2035
  • Figure 9: Global Market Attractiveness Analysis by Form
  • Figure 10: Global Market Value Share and BPS Analysis by Availability, 2025 and 2035
  • Figure 11: Global Market Y-o-Y Growth Comparison by Availability, 2025-2035
  • Figure 12: Global Market Attractiveness Analysis by Availability
  • Figure 13: Global Market Value Share and BPS Analysis by Sales Channel, 2025 and 2035
  • Figure 14: Global Market Y-o-Y Growth Comparison by Sales Channel, 2025-2035
  • Figure 15: Global Market Attractiveness Analysis by Sales Channel
  • Figure 16: Global Market Value Share and BPS Analysis by Nature, 2025 and 2035
  • Figure 17: Global Market Y-o-Y Growth Comparison by Nature, 2025-2035
  • Figure 18: Global Market Attractiveness Analysis by Nature
  • Figure 19: Global Market Value Share and BPS Analysis by Application, 2025 and 2035
  • Figure 20: Global Market Y-o-Y Growth Comparison by Application, 2025-2035
  • Figure 21: Global Market Attractiveness Analysis by Application
  • Figure 22: Global Market Value (USD Million) Share and BPS Analysis by Region, 2025 and 2035
  • Figure 23: Global Market Y-o-Y Growth Comparison by Region, 2025-2035
  • Figure 24: Global Market Attractiveness Analysis by Region
  • Figure 25: North America Market Incremental $ Opportunity, 2025-2035
  • Figure 26: Latin America Market Incremental $ Opportunity, 2025-2035
  • Figure 27: Western Europe Market Incremental $ Opportunity, 2025-2035
  • Figure 28: Eastern Europe Market Incremental $ Opportunity, 2025-2035
  • Figure 29: East Asia Market Incremental $ Opportunity, 2025-2035
  • Figure 30: South Asia & Pacific Market Incremental $ Opportunity, 2025-2035
  • Figure 31: Middle East and Africa Market Incremental $ Opportunity, 2025-2035
  • Figure 32: North America Market Value Share and BPS Analysis by Country, 2025 and 2035
  • Figure 33: North America Market Value Share and BPS Analysis by Pet Type, 2025 and 2035
  • Figure 34: North America Market Y-o-Y Growth Comparison by Pet Type, 2025-2035
  • Figure 35: North America Market Attractiveness Analysis by Pet Type
  • Figure 36: North America Market Value Share and BPS Analysis by Form, 2025 and 2035
  • Figure 37: North America Market Y-o-Y Growth Comparison by Form, 2025-2035
  • Figure 38: North America Market Attractiveness Analysis by Form
  • Figure 39: North America Market Value Share and BPS Analysis by Availability, 2025 and 2035
  • Figure 40: North America Market Y-o-Y Growth Comparison by Availability, 2025-2035
  • Figure 41: North America Market Attractiveness Analysis by Availability
  • Figure 42: North America Market Value Share and BPS Analysis by Sales Channel, 2025 and 2035
  • Figure 43: North America Market Y-o-Y Growth Comparison by Sales Channel, 2025-2035
  • Figure 44: North America Market Attractiveness Analysis by Sales Channel
  • Figure 45: North America Market Value Share and BPS Analysis by Nature, 2025 and 2035
  • Figure 46: North America Market Y-o-Y Growth Comparison by Nature, 2025-2035
  • Figure 47: North America Market Attractiveness Analysis by Nature
  • Figure 48: North America Market Value Share and BPS Analysis by Application, 2025 and 2035
  • Figure 49: North America Market Y-o-Y Growth Comparison by Application, 2025-2035
  • Figure 50: North America Market Attractiveness Analysis by Application
  • Figure 51: Latin America Market Value Share and BPS Analysis by Country, 2025 and 2035
  • Figure 52: Latin America Market Value Share and BPS Analysis by Pet Type, 2025 and 2035
  • Figure 53: Latin America Market Y-o-Y Growth Comparison by Pet Type, 2025-2035
  • Figure 54: Latin America Market Attractiveness Analysis by Pet Type
  • Figure 55: Latin America Market Value Share and BPS Analysis by Form, 2025 and 2035
  • Figure 56: Latin America Market Y-o-Y Growth Comparison by Form, 2025-2035
  • Figure 57: Latin America Market Attractiveness Analysis by Form
  • Figure 58: Latin America Market Value Share and BPS Analysis by Availability, 2025 and 2035
  • Figure 59: Latin America Market Y-o-Y Growth Comparison by Availability, 2025-2035
  • Figure 60: Latin America Market Attractiveness Analysis by Availability
  • Figure 61: Latin America Market Value Share and BPS Analysis by Sales Channel, 2025 and 2035
  • Figure 62: Latin America Market Y-o-Y Growth Comparison by Sales Channel, 2025-2035
  • Figure 63: Latin America Market Attractiveness Analysis by Sales Channel
  • Figure 64: Latin America Market Value Share and BPS Analysis by Nature, 2025 and 2035
  • Figure 65: Latin America Market Y-o-Y Growth Comparison by Nature, 2025-2035
  • Figure 66: Latin America Market Attractiveness Analysis by Nature
  • Figure 67: Latin America Market Value Share and BPS Analysis by Application, 2025 and 2035
  • Figure 68: Latin America Market Y-o-Y Growth Comparison by Application, 2025-2035
  • Figure 69: Latin America Market Attractiveness Analysis by Application
  • Figure 70: Western Europe Market Value Share and BPS Analysis by Country, 2025 and 2035
  • Figure 71: Western Europe Market Value Share and BPS Analysis by Pet Type, 2025 and 2035
  • Figure 72: Western Europe Market Y-o-Y Growth Comparison by Pet Type, 2025-2035
  • Figure 73: Western Europe Market Attractiveness Analysis by Pet Type
  • Figure 74: Western Europe Market Value Share and BPS Analysis by Form, 2025 and 2035
  • Figure 75: Western Europe Market Y-o-Y Growth Comparison by Form, 2025-2035
  • Figure 76: Western Europe Market Attractiveness Analysis by Form
  • Figure 77: Western Europe Market Value Share and BPS Analysis by Availability, 2025 and 2035
  • Figure 78: Western Europe Market Y-o-Y Growth Comparison by Availability, 2025-2035
  • Figure 79: Western Europe Market Attractiveness Analysis by Availability
  • Figure 80: Western Europe Market Value Share and BPS Analysis by Sales Channel, 2025 and 2035
  • Figure 81: Western Europe Market Y-o-Y Growth Comparison by Sales Channel, 2025-2035
  • Figure 82: Western Europe Market Attractiveness Analysis by Sales Channel
  • Figure 83: Western Europe Market Value Share and BPS Analysis by Nature, 2025 and 2035
  • Figure 84: Western Europe Market Y-o-Y Growth Comparison by Nature, 2025-2035
  • Figure 85: Western Europe Market Attractiveness Analysis by Nature
  • Figure 86: Western Europe Market Value Share and BPS Analysis by Application, 2025 and 2035
  • Figure 87: Western Europe Market Y-o-Y Growth Comparison by Application, 2025-2035
  • Figure 88: Western Europe Market Attractiveness Analysis by Application
  • Figure 89: Eastern Europe Market Value Share and BPS Analysis by Country, 2025 and 2035
  • Figure 90: Eastern Europe Market Value Share and BPS Analysis by Pet Type, 2025 and 2035
  • Figure 91: Eastern Europe Market Y-o-Y Growth Comparison by Pet Type, 2025-2035
  • Figure 92: Eastern Europe Market Attractiveness Analysis by Pet Type
  • Figure 93: Eastern Europe Market Value Share and BPS Analysis by Form, 2025 and 2035
  • Figure 94: Eastern Europe Market Y-o-Y Growth Comparison by Form, 2025-2035
  • Figure 95: Eastern Europe Market Attractiveness Analysis by Form
  • Figure 96: Eastern Europe Market Value Share and BPS Analysis by Availability, 2025 and 2035
  • Figure 97: Eastern Europe Market Y-o-Y Growth Comparison by Availability, 2025-2035
  • Figure 98: Eastern Europe Market Attractiveness Analysis by Availability
  • Figure 99: Eastern Europe Market Value Share and BPS Analysis by Sales Channel, 2025 and 2035
  • Figure 100: Eastern Europe Market Y-o-Y Growth Comparison by Sales Channel, 2025-2035
  • Figure 101: Eastern Europe Market Attractiveness Analysis by Sales Channel
  • Figure 102: Eastern Europe Market Value Share and BPS Analysis by Nature, 2025 and 2035
  • Figure 103: Eastern Europe Market Y-o-Y Growth Comparison by Nature, 2025-2035
  • Figure 104: Eastern Europe Market Attractiveness Analysis by Nature
  • Figure 105: Eastern Europe Market Value Share and BPS Analysis by Application, 2025 and 2035
  • Figure 106: Eastern Europe Market Y-o-Y Growth Comparison by Application, 2025-2035
  • Figure 107: Eastern Europe Market Attractiveness Analysis by Application
  • Figure 108: East Asia Market Value Share and BPS Analysis by Country, 2025 and 2035
  • Figure 109: East Asia Market Value Share and BPS Analysis by Pet Type, 2025 and 2035
  • Figure 110: East Asia Market Y-o-Y Growth Comparison by Pet Type, 2025-2035
  • Figure 111: East Asia Market Attractiveness Analysis by Pet Type
  • Figure 112: East Asia Market Value Share and BPS Analysis by Form, 2025 and 2035
  • Figure 113: East Asia Market Y-o-Y Growth Comparison by Form, 2025-2035
  • Figure 114: East Asia Market Attractiveness Analysis by Form
  • Figure 115: East Asia Market Value Share and BPS Analysis by Availability, 2025 and 2035
  • Figure 116: East Asia Market Y-o-Y Growth Comparison by Availability, 2025-2035
  • Figure 117: East Asia Market Attractiveness Analysis by Availability
  • Figure 118: East Asia Market Value Share and BPS Analysis by Sales Channel, 2025 and 2035
  • Figure 119: East Asia Market Y-o-Y Growth Comparison by Sales Channel, 2025-2035
  • Figure 120: East Asia Market Attractiveness Analysis by Sales Channel
  • Figure 121: East Asia Market Value Share and BPS Analysis by Nature, 2025 and 2035
  • Figure 122: East Asia Market Y-o-Y Growth Comparison by Nature, 2025-2035
  • Figure 123: East Asia Market Attractiveness Analysis by Nature
  • Figure 124: East Asia Market Value Share and BPS Analysis by Application, 2025 and 2035
  • Figure 125: East Asia Market Y-o-Y Growth Comparison by Application, 2025-2035
  • Figure 126: East Asia Market Attractiveness Analysis by Application
  • Figure 127: South Asia & Pacific Market Value Share and BPS Analysis by Country, 2025 and 2035
  • Figure 128: South Asia & Pacific Market Value Share and BPS Analysis by Pet Type, 2025 and 2035
  • Figure 129: South Asia & Pacific Market Y-o-Y Growth Comparison by Pet Type, 2025-2035
  • Figure 130: South Asia & Pacific Market Attractiveness Analysis by Pet Type
  • Figure 131: South Asia & Pacific Market Value Share and BPS Analysis by Form, 2025 and 2035
  • Figure 132: South Asia & Pacific Market Y-o-Y Growth Comparison by Form, 2025-2035
  • Figure 133: South Asia & Pacific Market Attractiveness Analysis by Form
  • Figure 134: South Asia & Pacific Market Value Share and BPS Analysis by Availability, 2025 and 2035
  • Figure 135: South Asia & Pacific Market Y-o-Y Growth Comparison by Availability, 2025-2035
  • Figure 136: South Asia & Pacific Market Attractiveness Analysis by Availability
  • Figure 137: South Asia & Pacific Market Value Share and BPS Analysis by Sales Channel, 2025 and 2035
  • Figure 138: South Asia & Pacific Market Y-o-Y Growth Comparison by Sales Channel, 2025-2035
  • Figure 139: South Asia & Pacific Market Attractiveness Analysis by Sales Channel
  • Figure 140: South Asia & Pacific Market Value Share and BPS Analysis by Nature, 2025 and 2035
  • Figure 141: South Asia & Pacific Market Y-o-Y Growth Comparison by Nature, 2025-2035
  • Figure 142: South Asia & Pacific Market Attractiveness Analysis by Nature
  • Figure 143: South Asia & Pacific Market Value Share and BPS Analysis by Application, 2025 and 2035
  • Figure 144: South Asia & Pacific Market Y-o-Y Growth Comparison by Application, 2025-2035
  • Figure 145: South Asia & Pacific Market Attractiveness Analysis by Application
  • Figure 146: Middle East and Africa Market Value Share and BPS Analysis by Country, 2025 and 2035
  • Figure 147: Middle East and Africa Market Value Share and BPS Analysis by Pet Type, 2025 and 2035
  • Figure 148: Middle East and Africa Market Y-o-Y Growth Comparison by Pet Type, 2025-2035
  • Figure 149: Middle East and Africa Market Attractiveness Analysis by Pet Type
  • Figure 150: Middle East and Africa Market Value Share and BPS Analysis by Form, 2025 and 2035
  • Figure 151: Middle East and Africa Market Y-o-Y Growth Comparison by Form, 2025-2035
  • Figure 152: Middle East and Africa Market Attractiveness Analysis by Form
  • Figure 153: Middle East and Africa Market Value Share and BPS Analysis by Availability, 2025 and 2035
  • Figure 154: Middle East and Africa Market Y-o-Y Growth Comparison by Availability, 2025-2035
  • Figure 155: Middle East and Africa Market Attractiveness Analysis by Availability
  • Figure 156: Middle East and Africa Market Value Share and BPS Analysis by Sales Channel, 2025 and 2035
  • Figure 157: Middle East and Africa Market Y-o-Y Growth Comparison by Sales Channel, 2025-2035
  • Figure 158: Middle East and Africa Market Attractiveness Analysis by Sales Channel
  • Figure 159: Middle East and Africa Market Value Share and BPS Analysis by Nature, 2025 and 2035
  • Figure 160: Middle East and Africa Market Y-o-Y Growth Comparison by Nature, 2025-2035
  • Figure 161: Middle East and Africa Market Attractiveness Analysis by Nature
  • Figure 162: Middle East and Africa Market Value Share and BPS Analysis by Application, 2025 and 2035
  • Figure 163: Middle East and Africa Market Y-o-Y Growth Comparison by Application, 2025-2035
  • Figure 164: Middle East and Africa Market Attractiveness Analysis by Application
  • Figure 165: Global Market - Tier Structure Analysis
  • Figure 166: Global Market - Company Share Analysis

Frequently Asked Questions

What is the projected size of the pet prebiotics market in 2025?

The market is valued at USD 315.3 million in 2025.

What is the outlook on pet prebiotics demand by 2035?

The market is forecasted to reach USD 855.6 million by 2035, reflecting a CAGR of 10.5%.

Which form type leads the pet prebiotics market in 2025?

Chewables are expected to lead the market with a 38% share in 2025.

What is the projected share of OTC products in the pet prebiotics market by 2035?

Over-the-counter (OTC) products are expected to hold a 68% market share by 2035.

Which country is projected to have the fastest-growing pet prebiotics market?

Japan is anticipated to be the fastest-growing market with a CAGR of 11.3% from 2025 to 2035.

Explore Similar Insights

Future Market Insights

Pet Prebiotics Market