Reports

- Global Locations -

Headquarters

Future Market Insights, Inc.

Christiana Corporate, 200
Continental Drive, Suite 401,
Newark, Delaware - 19713,
United States

T: +1-845-579-5705

Americas

Future Market Insights, Inc.

616 Corporate Way, Suite 2-9018,
Valley Cottage, NY 10989, United States

T: +1-347-918-3531

MEA

Future Market Insights

1602-6 Jumeirah Bay X2 Tower, Plot No: JLT-PH2-X2A,
Jumeirah Lakes Towers, Dubai,
United Arab Emirates

Europe

Future Market Insights

3rd Floor, 207 Regent Street,
W1B 3HH London
United Kingdom

T: + 44 (0) 20 8123 9659
D: +44 (0) 20 3287 4268

Asia Pacific

Future Market Insights

IndiaLand Global Tech Park, Unit UG-1, Behind Grand HighStreet, Phase 1, Hinjawadi, MH, Pune – 411057, India

Pet Tick and Flea Prevention Market Outlook (2022-2032)

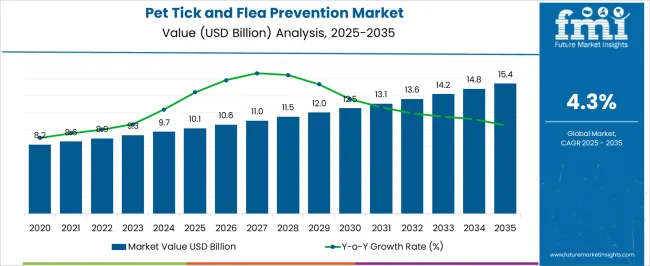
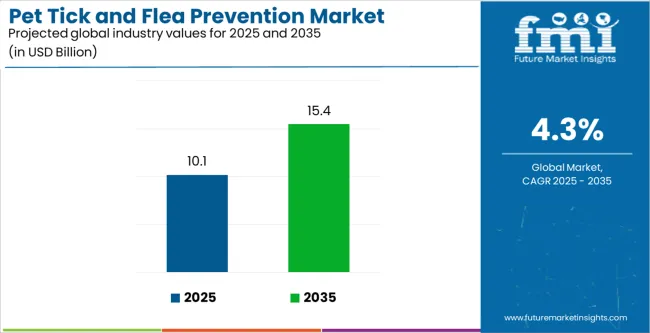
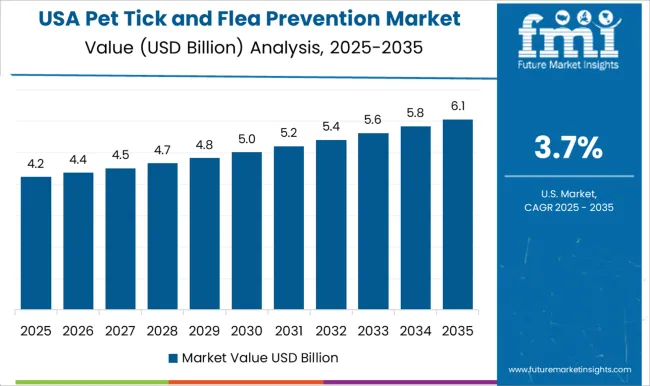
[312 Pages Report] According to Future Market Insights, the pet tick and flea prevention market is expected to reach US$ 13,150.0 Million by 2032, at a CAGR of 4.0% from 2022 to 2032. The market is estimated to be valued at US$ 8,886.2 Mn in 2022, supported by:

  • The market is growing largely due to an increase in pet adoption throughout the world as well as the rising use of flea, tick, and heartworm products for the prevention and treatment of FTH-transmitted illnesses in companion animals and the potential danger of transmission to humans.
  • Additionally, supporting government programs designed to raise public awareness of the need to avoid flea, tick, and heartworm infections has significantly contributed to the market's expansion.
  • The American Heartworm Society advises pet owners and veterinarians to prevent canine and feline heartworm disease year-round. They also offer instructions for canine and feline prevention.
  • The market is also expected to increase at a faster rate due to rising pet adoption, consumer willingness to spend money on their pets for flea, tick, and heartworm disease treatment, and rising public awareness of pet parasitism.
Attribute Details
Pet Tick and Flea Prevention Market Valuation (2022) US$ 8,886.2 Million
Pet Tick and Flea Prevention Market Projected Size (2032) US$ 13,150.0 Million
Pet Tick and Flea Prevention Market Expected CAGR (2022-2032) 4.0%

Don't pay for what you don't need

Customize your report by selecting specific countries or regions and save 30%!

North America Pet Tick and Flea Prevention Market

Due to growing public worries about pets and the treatment of them as family members, which in turn has fueled the flea and tick product market, North America has dominated this industry. In North America, increasing yearly veterinarian spending in families is very high, leading to the domination of the pet tick and flea prevention market.

Due to the severe laws and regulations of the United States Environmental Protection Agency and Food and Drug Administration, as well as the American Pet Product Association, the United States had a substantial portion of the flea and tick product industry in North America.

The growing popularity of pets among Europeans has driven the region's flea and tick product business. Furthermore, in recent years, individuals have begun to regard their dogs like people, resulting in a greater concern for their health. The flea dominates as a parasite that infects the majority of dogs and cats throughout their lives.

The United States to Dominate the North American Pet Tick and Flea Prevention Market

Furthermore, fleas are particularly frequent in the elderly dog and cat population. The majority of dog flea infestation cases in the United States were found in the Southeast, whereas cat flea prevalence rates were highest in the North West.

In the Southeast, where ticks are most common in dogs, Oklahoma accounts for a sizable portion. The Northeast dominated tick infections in cats, with Massachusetts leading the way among other states.

Sneha Verghese
Sneha Verghese

Principal Consultant

Talk to Analyst

Find your sweet spots for generating winning opportunities in this market.

Heavy Competition in the Pet Tick and Flea Prevention Market

The industry is characterized by intense competition among all value chain participants. In particular, the rivalry between veterinarians and retail channels for over-the-counter (OTC) flea and tick control treatments benefits pet owners.

Over the past decade, the majority of significant pharmaceutical firms have concentrated on the pet medicine industry, which has stimulated research and development of medications specifically for pets to address illnesses including infections, anxiety, and arthritis.

Development and production of these items prioritize traditional pet medicine for heartworms, fleas, and ticks. To remain competitive in the sector, stakeholders are decreasing the pricing of their products, which helps pet owners by giving them more convenience and better services.

Shortly, the demand for flea and tick products is anticipated to be driven by consumer awareness and repeated behaviors related to pet goods. Most businesses invest a lot of money in thorough research and development, mostly to create new goods. The two main techniques used by major firms are product portfolio diversification and mergers and acquisitions.

An increase in the cases pertaining to zoonotic diseases, an increase in the adoption of pets, and a number of other factors are expected to drive the pet tick and flea prevention market during the forecast period.

The pet tick and flea prevention market share in the pet care market is close to 7%.

The pet tick and flea prevention market is estimated to progress owing to a significant increase in flea and tick-borne diseases in recent years. There has been an increase in the cases of rocky mountain spotted fever, anaplasmosis, murine typhus, etc.

Moreover, there is also a risk of the virus getting transmitted to humans, leading to zoonotic diseases. This can be further reinforced by the fact that based on market research, nearly 1 in 10 people tend to get infected easily because of certain complicated health conditions that their pet has developed, which are transmitted to the owners as well. This is expected to increase the demand for pet tick and flea prevention during the forecast period.

Additionally, there has been an increase in the number of people buying pet animals. There were approximately 87 million pet dogs worldwide in 2021, and the number of households that owned a pet dog grew from 38% in 2016 to 45% in 2021.

The adoption rate of pet animals started skyrocketing, especially after the covid-19 pandemic, when people had to spend their time alone during lockdowns. To overcome boredom and loneliness, people started buying pet animals. Thus, the increase in the adoption of pet animals could increase the demand for pet tick and flea prevention.

Instead of buying pet animals just for the sake of it, people have started taking care of them just like their own family members. Because of this, people are willing to spend any amount for the welfare of their pet animals. Thus, the increasing scenario of pet humanization is expected to increase the demand for pet tick and flea prevention.

Moreover, rising disposable income has also increased the demand for flea control and tick control. With the rise in disposable income, people find it relatively affordable to own and provide shelter and a nutritious diet to their pets, apart from providing timely medication. This might increase the demand for pet tick and flea prevention in the future.

Furthermore, there have been increasing initiatives from governments worldwide to raise awareness regarding pet tick and fleas and their prevention. For example, the US Environmental Protection Agency has been carrying out mass awareness programs to convey the potential damage that ticks and fleas can cause to animal health. Such initiatives would play a key role in increasing the demand for pet tick and flea prevention during the forecast period.

Restraints for the Pet Tick and Flea Prevention Market

High cost

Even though many pet owners are ready to spend any amount on taking care of their pets, only some might think before availing of these services as the affordability factor comes into the picture. This might hamper the pet tick and flea prevention market share during the forecast period.

Side effects

Applying pet tick and flea prevention products may have some side effects on the pet body. Some of the common side effects include itching and spots on certain parts of the body. It has also been observed that after applying these products, the pet animals exhibit irritable behavior, and the veterinary specialists believe that the product might not suit the pet animal’s skin, as a result of which it starts behaving like this.

Get the data you need at a Fraction of the cost

Personalize your report by choosing insights you need
and save 40%!

Comparative View for Pet Tick and Flea Prevention Market

Pet Tick and Flea Prevention Market:

Attributes Pet Tick and Flea Prevention Market
Anticipated CAGR (2022 to 2032) 4%
Market Value (2022) US$ 8886.2 Million
Growth Factor Prevalence of pet humanisation, coupled with a tendency of pet diseases getting transmitted to human beings is expected to drive the pet tick and flea prevention market.
Future Opportunities Increasing disposable income, and increasing initiatives being carried out by the government expected to create opportunities for the pet tick and flea prevention market.
Market Trends The adoption of spot on products is a trend that is currently driving the pet tick and flea prevention market.

Pet Services Market:

Attributes Pet Services Market
Anticipated CAGR (2022 to 2032) 9%
Market Value (2022) US$ 25.07 Billion
Growth Factor Expansion of pet types, coupled with the operational efficiency of pet services market is currently driving the market.
Future Opportunities Increased penetration of subscription services, coupled with an increase in the adoption of data science to analyse consumer adoption pattern is expected to drive pet services market.
Market Trends There is a growing adoption of online sales channel. Apart from that, a large number of manufacturers are preferring the online business model in the pet services market.

Pet Sitting Market:

Attributes Pet Sitting Market
Anticipated CAGR (2022 to 2032) 11%
Market Value (2022) US$ 2.15 Billion
Growth Factor An exponential increase in the animal welfare expenses, coupled with increased pet adoption is currently driving the pet sitting market.
Future Opportunities Increasing cases of food borne and zoonotic diseases expected to drive the pet sitting market.
Market Trends Of late, there has been an increase in the disbursement of pet insurance, and this might potentially drive the pet sitting market going further.

Region-wise Insights for Pet Tick and Flea Prevention Market

How is the Pet Tick and Flea Prevention Market Growing in North America?

“Rise in flea, tick and heartworm borne illness makes North America the largest pet tick and flea prevention market.”

The growth in the adoption rate of domestic animals and increasing concern about pet health among pet owners led to the market's growth. Moreover, North America is the largest market for pet animals and daycare. This also increases the scope of the region's pet tick and flea prevention market.

According to the Centres for Disease Control and Prevention (CDC), diseases caused by tick and flea bites increased three-fold in the United States in 2018, and there were nearly 650000 more cases compared to 2015-2016.

Strict government rules and regulations from organizations such as the US Environmental Protection Agency and the Food and Drug Administration have increased pet care requirements in North America. Moreover, massive campaigns conducted by government agencies have further reinforced the market.

Why is the Pet Tick and Flea Prevention Market booming in Europe?

“Government initiatives is the main factor that is leading to the growth of pet tick and flea prevention market in Europe and makes it the second largest market”

In Europe, the government and many major corporate bodies are funding the pet tick and flea prevention market to conduct high-quality Research and Development activities. The research activities are conducted to counter FTH-based issues mainly. Additionally, Europe is also home to some of the major players who are serving the niche.

Why is there an Increase in the Application of Pet Ticks and Flea Products in Asia Pacific?

Increase in animal adoption rate is causing the rise in demand for pet ticks and fleas products

Also, Asia Pacific is the region where per capita income is rapidly increasing. Additionally, the overall healthcare infrastructure is showing rapid advancements, and governments in this region are taking proactive measures to expedite the development process further. Therefore, Asia Pacific is expected to be the fastest-growing market during the forecast period.

Category-wise Insights in Pet Tick and Flea Prevention Market

Which is the most Popular Product in Pet Tick and Flea Prevention Market?

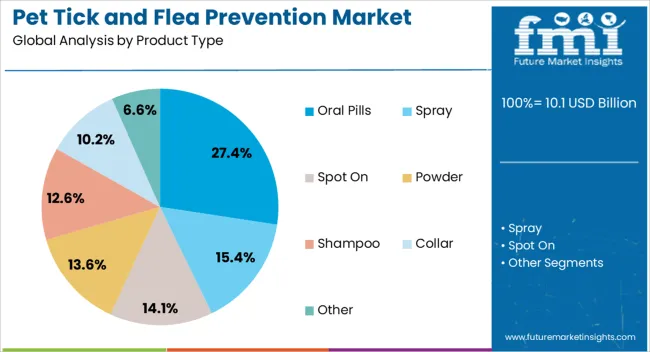
“Spot on product is most preferred in the Pet Tick and Flea Prevention market.”

Spot on flea and tick products are liquids applied at a particular spot on the pet's skin, usually at the neck or shoulder. It is very easy to use and convenient for pet owners compared to other products. It is also extremely subtle and has deeper penetration.

Additionally, the chances of spilling or wastage of the liquid are very less in the case of a spot on product.

Which Animal accounted for the Largest Revenue in the Pet Tick and Flea Prevention Market?

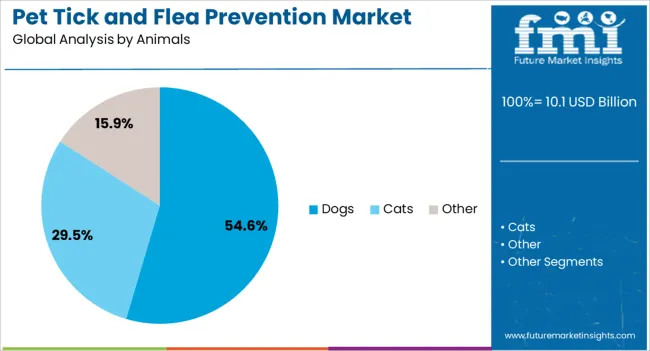
“Dogs account for the highest market share in the pet tick and flea prevention market “

Furry animals, especially dogs, provide the perfect environment for breeding ticks and fleas. These insects feed on the animals’ blood, which can lead to serious diseases ranging from allergies to serious infections.

Hence, it is seen that most revenue is generated from dog owners. The demand rate is increasing in developed countries because of the increasing adoption of pet dogs.

Which Sales Channel is the Most Preferred in the Pet Tick and Flea Prevention Market?

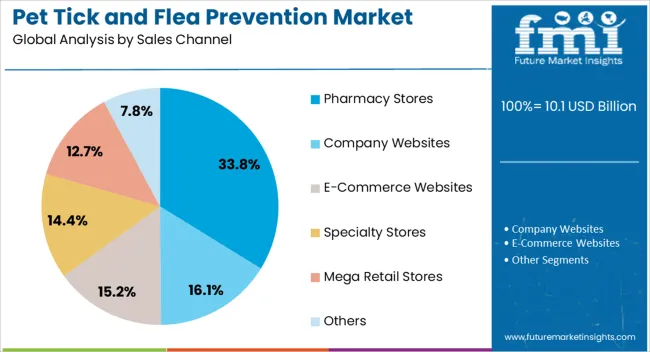
“E-commerce is the most preferred sales channel”

E-commerce is undoubtedly the channel that is generating revenue for almost all sectors. Moreover, E-commerce sites allow us to choose from more than one brand.

Based on a market study, online pet food sales rose by 77% in March 2020 during covid 19 lockdown. The E-commerce channel was virtually the only channel driving the market during the pandemic.

Start-up Ecosystem in the Pet Tick and Flea Prevention Market

The pet tick and flea prevention market is currently dominated by key players who have been a part of this niche for decades.

Only a little is happening if we look at the start-up ecosystem. One of the main reasons any start-up was not established in this niche was the need for raw materials available over the last two years. This was mainly because the supply chain was getting disrupted across the world.

However, with the situation returning to normal, the market presents a huge opportunity for aspiring entrepreneurs. The simple reason is the increasing adoption of pet animals.

Apart from that, be it governments across the world, funding agencies, high net-worth individuals, etc., everybody is willing to invest in this niche and provide funding to aspiring entrepreneurs.

Competitive Landscape in the Pet Tick and Flea Prevention Market

The local and global firms are equally competitive in the pet tick and flea markets. With rising awareness about veterinary health, the key players are taking all possible steps to be the market leader in the pet flea and tick market.

Apart from that, the focus is on achieving sustainable goals and ensuring that the operational standard is well within limits put forth by the healthcare authorities. Moreover, the key players are also entering into strategic collaborations to expand their portfolio further and serve new regions.

Some of the recent developments in the pet tick and flea prevention market are:

  • In September 2022, Boehringer Ingelheim launches Fencovis, a new vaccine to prevent calf diarrhea.
  • In April 2022, Ceva Sante Animale announced Japan based joint venture with MITSUI

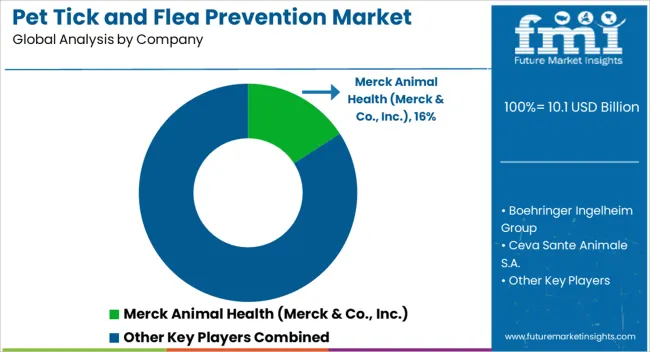
Ecto Development Corporation, Merck Animal Health and Sergeant’s Pet Care Products are exploring the pet tick and flea prevention market by introducing best quality products

Ecto development Corporation has been serving the animal health industry for nearly three decades. The state-of-the-art laboratory focuses on Research and Development, product management, chemical analysis, and carrying out EPA/FDA studies. Apart from that, the company has been heavily investing in quality control analysis to support manufacturing capabilities.

Apart from that, be it product chemistry, method validation, analytical method development, protocol development, Ecto has been providing solutions to carry out the processes seamlessly. This ensures that the product that is being put into the final mixture is complying with the standards set by the food authorities.

The company has also been able to produce nearly 480,000 injection molded units per month and 300,000 liquid fill units per month.

Merck Animal Health is known for its information, technologies, and veterinary services which have been instrumental in advancing animal healthcare. They are driven by a desire to be highly responsive to the dynamic industry. They have also been building strong partnerships in an effort to improve health of animals across the world.

Recently, Merk Animal Health announced the finding of its third veterinarian wellbeing study in collaboration with AVMA, including a $ 100000 grant to address the wellbeing and mental health development among veterinarians, technicians, and staff.

Merk animal health was also in the news for announcing SENSEHUB Feedlot, a state-of-the-art technology which features an illuminating electronic ear tag that makes it easy for animal care handlers to identify and sort cattle needing attention with less labour.

Sergeant’s Pet Care Products has been serving the pet niche for more than a century and a half. It is known for providing affordable pet care. Their shampoos and formulas have shown proven results.

The scents that have been developed by Sergeant’s, have been known to last up to 2 weeks. Moreover, their products are available in bot online and offline mode, and can be availed Over the Counter.

Key Companies Profiled in the Pet Tick and Flea Prevention Market

  • Boehringer Ingelheim Group
  • Ceva Sante Animale S.A.
  • Ecto Development Corporation
  • Eli Lilly and Company
  • Merck Animal Health (Merck & Co., Inc.)
  • Sergeant’s Pet Care Products, Inc.
  • The Hartz Mountain Corporation
  • Virbac Corporation
  • Wellmark International, Inc.
  • Central Life Sciences
  • Advanced PetCare of Northern Nevada
  • Penn Veterinary Supply, Inc.
  • Petsburgh Pet Care Inc.
  • Pipestone Veterinary Services
  • Precious Pet Services Pvt. Ltd.
  • SPC Pet India

Pet Tick and Flea Prevention Market by Category

By Product:

  • Oral pills
  • Spray
  • Spot on
  • Powder
  • Shampoo,
  • Collar
  • Other products (Injection, Drops, and Dips)

By Animals:

  • Dogs
  • Cats
  • Other animals (Mice, Rats etc.)

By Sales Channel:

  • E-commerce websites
  • Company websites
  • Specialty stores
  • Pharmacy stores
  • Mega retail stores
  • Others (Individual Stores, Departmental Stores, etc.)

By Region:

  • North America
  • Latin America
  • Europe
  • Asia Pacific
  • MEA

Frequently Asked Questions

How large is the Pet Tick and Flea Prevention Market Size?

The pet tick and flick has a valuation of US$ 8,886.2 mn as on 2022.

At what rate is the Pet Tick and Flea Prevention Market expected to grow during the Forecast Period?

The global pet tick and flea market is expected to grow at a CAGR of 4% during the forecast period.

What are the key trends driving the Pet Tick and Flea Prevention sales?

The key trends driving the pet tick and flea prevention products are increase in the cases of zoonotic diseases and increase in the adoption of pets.

What is the expected valuation of Pet Tick and Flea Prevention Market by 2032?

The pet tick and flea prevention market is expected to be valued at US$ 13,150 mn by 2032.

Which Region is the Largest Pet Tick and Flea Prevention Market?

North America is the largest pet tick and flea prevention market.

Table of Content

1. Executive Summary

    1.1. Global Market Outlook

    1.2. Demand-side Trends

    1.3. Supply-side Trends

    1.4. Technology Roadmap Analysis

    1.5. Analysis and Recommendations

2. Market Overview

    2.1. Market Coverage / Taxonomy

    2.2. Market Definition / Scope / Limitations

3. Market Background

    3.1. Market Dynamics

        3.1.1. Drivers

        3.1.2. Restraints

        3.1.3. Opportunity

        3.1.4. Trends

    3.2. Scenario Forecast

        3.2.1. Demand in Optimistic Scenario

        3.2.2. Demand in Likely Scenario

        3.2.3. Demand in Conservative Scenario

    3.3. Opportunity Map Analysis

    3.4. Investment Feasibility Matrix

    3.5. PESTLE and Porter’s Analysis

    3.6. Regulatory Landscape

        3.6.1. By Key Regions

        3.6.2. By Key Countries

4. Global Pet tick and flea Analysis 2017-2021 and Forecast, 2022-2032

    4.1. Historical Market Size Value (US$ Mn) & Volume (Mn Units)Analysis, 2017-2021

    4.2. Current and Future Market Size Value (US$ Mn) & Volume (Mn Units)Projections, 2022-2032

        4.2.1. Y-o-Y Growth Trend Analysis

        4.2.2. Absolute $ Opportunity Analysis

5. Global Pet tick and flea Analysis 2017-2021 and Forecast 2022-2032, By Products

    5.1. Introduction / Key Findings

    5.2. Historical Market Size Value (US$ Mn) & Volume (Mn Units)Analysis By Products, 2017-2021

    5.3. Current and Future Market Size Value (US$ Mn) & Volume (Mn Units)Analysis and Forecast By Products, 2022-2032

        5.3.1. Oral Pill

        5.3.2. Spray

        5.3.3. Spot On

        5.3.4. Powder

        5.3.5. Shampoo

        5.3.6. Collar

        5.3.7. Other Products (Injection, Drops, and Dips)

    5.4. Y-o-Y Growth Trend Analysis By Products, 2017-2021

    5.5. Absolute $ Opportunity Analysis By Products, 2022-2032

6. Global Pet tick and flea Analysis 2017-2021 and Forecast 2022-2032, By Price

    6.1. Introduction / Key Findings

    6.2. Historical Market Size Value (US$ Mn) & Volume (Mn Units)Analysis By Price , 2017-2021

    6.3. Current and Future Market Size Value (US$ Mn) & Volume (Mn Units)Analysis and Forecast By Price , 2022-2032

        6.3.1. Low

        6.3.2. Medium

        6.3.3. Premium

    6.4. Y-o-Y Growth Trend Analysis By Price , 2017-2021

    6.5. Absolute $ Opportunity Analysis By Price , 2022-2032

7. Global Pet tick and flea Analysis 2017-2021 and Forecast 2022-2032, By animal

    7.1. Introduction / Key Findings

    7.2. Historical Market Size Value (US$ Mn) & Volume (Mn Units)Analysis By animal , 2017-2021

    7.3. Current and Future Market Size Value (US$ Mn) & Volume (Mn Units)Analysis and Forecast By animal , 2022-2032

        7.3.1. Dogs

        7.3.2. Cats

        7.3.3. Other Animals (Mice, Rabbits, Etc.)

    7.4. Y-o-Y Growth Trend Analysis By animal , 2017-2021

    7.5. Absolute $ Opportunity Analysis By animal , 2022-2032

8. Global Pet tick and flea Analysis 2017-2021 and Forecast 2022-2032, By sales channel

    8.1. Introduction / Key Findings

    8.2. Historical Market Size Value (US$ Mn) & Volume (Mn Units)Analysis By sales channel , 2017-2021

    8.3. Current and Future Market Size Value (US$ Mn) & Volume (Mn Units)Analysis and Forecast By sales channel , 2022-2032

        8.3.1. E-commerce Sites

        8.3.2. Company Websites

        8.3.3. Specialty Stores

        8.3.4. Pharma

        8.3.5. Mega Retail Stores

        8.3.6. Others (Individual Stores, Departmental Stores, etc.)

    8.4. Y-o-Y Growth Trend Analysis By saleschannel , 2017-2021

    8.5. Absolute $ Opportunity Analysis By saleschannel , 2022-2032

9. Global Pet tick and fleaAnalysis 2017-2021 and Forecast 2022-2032, By Region

    9.1. Introduction

    9.2. Historical Market Size Value (US$ Mn) & Volume (Mn Units)Analysis By Region, 2017-2021

    9.3. Current Market Size Value (US$ Mn) & Volume (Mn Units)Analysis and Forecast By Region, 2022-2032

        9.3.1. North America

        9.3.2. Latin America

        9.3.3. Europe

        9.3.4. East Asia

        9.3.5. South Asia

        9.3.6. Oceania

        9.3.7. MEA

    9.4. Market Attractiveness Analysis By Region

10. North America Pet tick and flea Analysis 2017-2021 and Forecast 2022-2032, By Country

    10.1. Historical Market Size Value (US$ Mn) & Volume (Mn Units)Trend Analysis By Market Taxonomy, 2017-2021

    10.2. Market Size Value (US$ Mn) & Volume (Mn Units)Forecast By Market Taxonomy, 2022-2032

        10.2.1. By Country

            10.2.1.1. U.S.

            10.2.1.2. Canada

        10.2.2. By Products

        10.2.3. By Price

        10.2.4. By animal

        10.2.5. By sales channel

    10.3. Market Attractiveness Analysis

        10.3.1. By Country

        10.3.2. By Products

        10.3.3. By Price

        10.3.4. By animal

        10.3.5. By sales channel

    10.4. Key Takeaways

11. Latin America Pet tick and flea Analysis 2017-2021 and Forecast 2022-2032, By Country

    11.1. Historical Market Size Value (US$ Mn) & Volume (Mn Units)Trend Analysis By Market Taxonomy, 2017-2021

    11.2. Market Size Value (US$ Mn) & Volume (Mn Units)Forecast By Market Taxonomy, 2022-2032

        11.2.1. By Country

            11.2.1.1. Brazil

            11.2.1.2. Mexico

            11.2.1.3. Rest of Latin America

        11.2.2. By Products

        11.2.3. By Price

        11.2.4. By animal

        11.2.5. By sales channel

    11.3. Market Attractiveness Analysis

        11.3.1. By Country

        11.3.2. By Products

        11.3.3. By Price

        11.3.4. By animal

        11.3.5. By sales channel

    11.4. Key Takeaways

12. Europe Pet tick and flea Analysis 2017-2021 and Forecast 2022-2032, By Country

    12.1. Historical Market Size Value (US$ Mn) & Volume (Mn Units)Trend Analysis By Market Taxonomy, 2017-2021

    12.2. Market Size Value (US$ Mn) & Volume (Mn Units)Forecast By Market Taxonomy, 2022-2032

        12.2.1. By Country

            12.2.1.1. Germany

            12.2.1.2. Italy

            12.2.1.3. France

            12.2.1.4. U.K.

            12.2.1.5. Spain

            12.2.1.6. Russia

            12.2.1.7. BENELUX

            12.2.1.8. Rest of Europe

        12.2.2. By Products

        12.2.3. By Price

        12.2.4. By animal

        12.2.5. By sales channel

    12.3. Market Attractiveness Analysis

        12.3.1. By Country

        12.3.2. By Products

        12.3.3. By Price

        12.3.4. By animal

        12.3.5. By sales channel

    12.4. Key Takeaways

13. East Asia Pet tick and flea Analysis 2017-2021 and Forecast 2022-2032, By Country

    13.1. Historical Market Size Value (US$ Mn) & Volume (Mn Units)Trend Analysis By Market Taxonomy, 2017-2021

    13.2. Market Size Value (US$ Mn) & Volume (Mn Units)Forecast By Market Taxonomy, 2022-2032

        13.2.1. By Country

            13.2.1.1. China

            13.2.1.2. Japan

            13.2.1.3. South Korea

        13.2.2. By Products

        13.2.3. By Price

        13.2.4. By animal

        13.2.5. By sales channel

    13.3. Market Attractiveness Analysis

        13.3.1. By Country

        13.3.2. By Products

        13.3.3. By Price

        13.3.4. By animal

        13.3.5. By sales channel

    13.4. Key Takeaways

14. South Asia Pet tick and flea Analysis 2017-2021 and Forecast 2022-2032, By Country

    14.1. Historical Market Size Value (US$ Mn) & Volume (Mn Units)Trend Analysis By Market Taxonomy, 2017-2021

    14.2. Market Size Value (US$ Mn) & Volume (Mn Units)Forecast By Market Taxonomy, 2022-2032

        14.2.1. By Country

            14.2.1.1. India

            14.2.1.2. Thailand

            14.2.1.3. Malaysia

            14.2.1.4. Indonesia

            14.2.1.5. Rest of South Asia

        14.2.2. By Products

        14.2.3. By Price

        14.2.4. By animal

        14.2.5. By sales channel

    14.3. Market Attractiveness Analysis

        14.3.1. By Country

        14.3.2. By Products

        14.3.3. By Price

        14.3.4. By animal

        14.3.5. By sales channel

    14.4. Key Takeaways

15. Oceania Pet tick and flea Analysis 2017-2021 and Forecast 2022-2032, By Country

    15.1. Historical Market Size Value (US$ Mn) & Volume (Mn Units)Trend Analysis By Market Taxonomy, 2017-2021

    15.2. Market Size Value (US$ Mn) & Volume (Mn Units)Forecast By Market Taxonomy, 2022-2032

        15.2.1. By Country

            15.2.1.1. Australia

            15.2.1.2. New Zealand

        15.2.2. By Products

        15.2.3. By Price

        15.2.4. By animal

        15.2.5. By sales channel

    15.3. Market Attractiveness Analysis

        15.3.1. By Country

        15.3.2. By Products

        15.3.3. By Price

        15.3.4. By animal

        15.3.5. By sales channel

    15.4. Key Takeaways

16. MEA Pet tick and flea Analysis 2017-2021 and Forecast 2022-2032, By Country

    16.1. Historical Market Size Value (US$ Mn) & Volume (Mn Units)Trend Analysis By Market Taxonomy, 2017-2021

    16.2. Market Size Value (US$ Mn) & Volume (Mn Units)Forecast By Market Taxonomy, 2022-2032

        16.2.1. By Country

            16.2.1.1. GCC Countries

            16.2.1.2. Turkey

            16.2.1.3. Israel

            16.2.1.4. South Africa

            16.2.1.5. Egypt

            16.2.1.6. Rest of MEA

        16.2.2. By Products

        16.2.3. By Price

        16.2.4. By animal

        16.2.5. By sales channel

    16.3. Market Attractiveness Analysis

        16.3.1. By Country

        16.3.2. By Products

        16.3.3. By Price

        16.3.4. By animal

        16.3.5. By sales channel

    16.4. Key Takeaways

17. Key Countries Pet tick and flea Analysis

    17.1. U.S.

        17.1.1. Pricing Analysis

        17.1.2. Market Share Analysis, 2021

            17.1.2.1. By Products

            17.1.2.2. By Price

            17.1.2.3. By animal

            17.1.2.4. By sales channel

    17.2. Canada

        17.2.1. Pricing Analysis

        17.2.2. Market Share Analysis, 2021

            17.2.2.1. By Products

            17.2.2.2. By Price

            17.2.2.3. By animal

            17.2.2.4. By sales channel

    17.3. Brazil

        17.3.1. Pricing Analysis

        17.3.2. Market Share Analysis, 2021

            17.3.2.1. By Products

            17.3.2.2. By Price

            17.3.2.3. By animal

            17.3.2.4. By sales channel

    17.4. Mexico

        17.4.1. Pricing Analysis

        17.4.2. Market Share Analysis, 2021

            17.4.2.1. By Products

            17.4.2.2. By Price

            17.4.2.3. By animal

            17.4.2.4. By sales channel

    17.5. Argentina

        17.5.1. Pricing Analysis

        17.5.2. Market Share Analysis, 2021

            17.5.2.1. By Products

            17.5.2.2. By Price

            17.5.2.3. By animal

            17.5.2.4. By sales channel

    17.6. Germany

        17.6.1. Pricing Analysis

        17.6.2. Market Share Analysis, 2021

            17.6.2.1. By Products

            17.6.2.2. By Price

            17.6.2.3. By animal;

            17.6.2.4. By sales channel

    17.7. Italy

        17.7.1. Pricing Analysis

        17.7.2. Market Share Analysis, 2021

            17.7.2.1. By Products

            17.7.2.2. By Price

            17.7.2.3. By animal

            17.7.2.4. By sales channel

    17.8. France

        17.8.1. Pricing Analysis

        17.8.2. Market Share Analysis, 2021

            17.8.2.1. By Products

            17.8.2.2. By Price

            17.8.2.3. By animal

            17.8.2.4. By sales channel

    17.9. U.K.

        17.9.1. Pricing Analysis

        17.9.2. Market Share Analysis, 2021

            17.9.2.1. By Products

            17.9.2.2. By Price

            17.9.2.3. By animal

            17.9.2.4. By sales channel

    17.10. Spain

        17.10.1. Pricing Analysis

        17.10.2. Market Share Analysis, 2021

            17.10.2.1. By Products

            17.10.2.2. By Price

            17.10.2.3. By animal

            17.10.2.4. By sales channel

    17.11. Russia

        17.11.1. Pricing Analysis

        17.11.2. Market Share Analysis, 2021

            17.11.2.1. By Products

            17.11.2.2. By Price

            17.11.2.3. By animal

            17.11.2.4. By sales channel

    17.12. BENELUX

        17.12.1. Pricing Analysis

        17.12.2. Market Share Analysis, 2021

            17.12.2.1. By Products

            17.12.2.2. By Price

            17.12.2.3. By animal

            17.12.2.4. By sales channel

    17.13. China

        17.13.1. Pricing Analysis

        17.13.2. Market Share Analysis, 2021

            17.13.2.1. By Products

            17.13.2.2. By Price

            17.13.2.3. By animal

            17.13.2.4. By sales channel

    17.14. Japan

        17.14.1. Pricing Analysis

        17.14.2. Market Share Analysis, 2021

            17.14.2.1. By Products

            17.14.2.2. By Price

            17.14.2.3. By animal

            17.14.2.4. By sales channel

    17.15. South Korea

        17.15.1. Pricing Analysis

        17.15.2. Market Share Analysis, 2021

            17.15.2.1. By Products

            17.15.2.2. By Price

            17.15.2.3. By animal

            17.15.2.4. By sales channel

    17.16. India

        17.16.1. Pricing Analysis

        17.16.2. Market Share Analysis, 2021

            17.16.2.1. By Products

            17.16.2.2. By Price

            17.16.2.3. By animal

            17.16.2.4. By sales channel

    17.17. GCC Countries

        17.17.1. Pricing Analysis

        17.17.2. Market Share Analysis, 2021

            17.17.2.1. By Products

            17.17.2.2. By Price

            17.17.2.3. By animal

            17.17.2.4. By sales channel

    17.18. Turkey

        17.18.1. Pricing Analysis

        17.18.2. Market Share Analysis, 2021

            17.18.2.1. By Products

            17.18.2.2. By Price

            17.18.2.3. By animal

            17.18.2.4. By sales channel

    17.19. Israel

        17.19.1. Pricing Analysis

        17.19.2. Market Share Analysis, 2021

            17.19.2.1. By Products

            17.19.2.2. By Price

            17.19.2.3. By animal

            17.19.2.4. By sales channel

    17.20. South Africa

        17.20.1. Pricing Analysis

        17.20.2. Market Share Analysis, 2021

            17.20.2.1. By Products

            17.20.2.2. By Price

            17.20.2.3. By animal

            17.20.2.4. By sales channel

    17.21. Egypt

        17.21.1. Pricing Analysis

        17.21.2. Market Share Analysis, 2021

            17.21.2.1. By Products

            17.21.2.2. By Price

            17.21.2.3. By animal

            17.21.2.4. By sales channel

18. Market Structure Analysis

    18.1. Competition Dashboard

    18.2. Competition Benchmarking

    18.3. Market Share Analysis of Top Players

        18.3.1. By Regional

        18.3.2. By Products

        18.3.3. By Price

        18.3.4. By animal

        18.3.5. By sales channel

19. Competition Analysis

    19.1. Competition Deep Dive

        19.1.1. Boehringer Ingelheim Group

            19.1.1.1. Overview

            19.1.1.2. Product Portfolio

            19.1.1.3. Profitability by Market Segment

            19.1.1.4. Sales Footprint

            19.1.1.5. Strategy Overview

                19.1.1.5.1. Marketing Strategy

                19.1.1.5.2. Product Strategy

        19.1.2. Ceva Sante Animale S.A.

            19.1.2.1. Overview

            19.1.2.2. Product Portfolio

            19.1.2.3. Profitability by Market Segment

            19.1.2.4. Sales Footprint

            19.1.2.5. Strategy Overview

                19.1.2.5.1. Marketing Strategy

                19.1.2.5.2. Product Strategy

        19.1.3. Ecto Development Corporation

            19.1.3.1. Overview

            19.1.3.2. Product Portfolio

            19.1.3.3. Profitability by Market Segment

            19.1.3.4. Sales Footprint

            19.1.3.5. Strategy Overview

                19.1.3.5.1. Marketing Strategy

                19.1.3.5.2. Product Strategy

        19.1.4. Eli Lilly and Company

            19.1.4.1. Overview

            19.1.4.2. Product Portfolio

            19.1.4.3. Profitability by Market Segment

            19.1.4.4. Sales Footprint

            19.1.4.5. Strategy Overview

                19.1.4.5.1. Marketing Strategy

                19.1.4.5.2. Product Strategy

        19.1.5. Merck Animal Health (Merck & Co., Inc.)

            19.1.5.1. Overview

            19.1.5.2. Product Portfolio

            19.1.5.3. Profitability by Market Segment

            19.1.5.4. Sales Footprint

            19.1.5.5. Strategy Overview

                19.1.5.5.1. Marketing Strategy

                19.1.5.5.2. Product Strategy

        19.1.6. Sergeant’s Pet Care Products, Inc.

            19.1.6.1. Overview

            19.1.6.2. Product Portfolio

            19.1.6.3. Profitability by Market Segment

            19.1.6.4. Sales Footprint

            19.1.6.5. Strategy Overview

                19.1.6.5.1. Marketing Strategy

                19.1.6.5.2. Product Strategy

        19.1.7. The Hartz Mountain Corporation

            19.1.7.1. Overview

            19.1.7.2. Product Portfolio

            19.1.7.3. Profitability by Market Segment

            19.1.7.4. Sales Footprint

            19.1.7.5. Strategy Overview

                19.1.7.5.1. Marketing Strategy

                19.1.7.5.2. Product Strategy

        19.1.8. Virbac Corporation

            19.1.8.1. Overview

            19.1.8.2. Product Portfolio

            19.1.8.3. Profitability by Market Segment

            19.1.8.4. Sales Footprint

            19.1.8.5. Strategy Overview

                19.1.8.5.1. Marketing Strategy

                19.1.8.5.2. Product Strategy

        19.1.9. Wellmark International, Inc.

            19.1.9.1. Overview

            19.1.9.2. Product Portfolio

            19.1.9.3. Profitability by Market Segment

            19.1.9.4. Sales Footprint

            19.1.9.5. Strategy Overview

                19.1.9.5.1. Marketing Strategy

                19.1.9.5.2. Product Strategy

        19.1.10. Central Life Sciences

            19.1.10.1. Overview

            19.1.10.2. Product Portfolio

            19.1.10.3. Profitability by Market Segment

            19.1.10.4. Sales Footprint

            19.1.10.5. Strategy Overview

                19.1.10.5.1. Marketing Strategy

                19.1.10.5.2. Product Strategy

        19.1.11. Advanced PetCare of Northern Nevada

            19.1.11.1. Overview

            19.1.11.2. Product Portfolio

            19.1.11.3. Profitability by Market Segment

            19.1.11.4. Sales Footprint

            19.1.11.5. Strategy Overview

                19.1.11.5.1. Marketing Strategy

                19.1.11.5.2. Product Strategy

        19.1.12. Penn Veterinary Supply, Inc.

            19.1.12.1. Overview

            19.1.12.2. Product Portfolio

            19.1.12.3. Profitability by Market Segment

            19.1.12.4. Sales Footprint

            19.1.12.5. Strategy Overview

                19.1.12.5.1. Marketing Strategy

                19.1.12.5.2. Product Strategy

        19.1.13. Petsburgh Pet Care Inc.

            19.1.13.1. Overview

            19.1.13.2. Product Portfolio

            19.1.13.3. Profitability by Market Segment

            19.1.13.4. Sales Footprint

            19.1.13.5. Strategy Overview

                19.1.13.5.1. Marketing Strategy

                19.1.13.5.2. Product Strategy

        19.1.14. Pipestone Veterinary Services

            19.1.14.1. Overview

            19.1.14.2. Product Portfolio

            19.1.14.3. Profitability by Market Segment

            19.1.14.4. Sales Footprint

            19.1.14.5. Strategy Overview

                19.1.14.5.1. Marketing Strategy

                19.1.14.5.2. Product Strategy

        19.1.15. Precious Pet Services Pvt. Ltd.

            19.1.15.1. Overview

            19.1.15.2. Product Portfolio

            19.1.15.3. Profitability by Market Segment

            19.1.15.4. Sales Footprint

            19.1.15.5. Strategy Overview

                19.1.15.5.1. Marketing Strategy

                19.1.15.5.2. Product Strategy

        19.1.16. SPC Pet India

            19.1.16.1. Overview

            19.1.16.2. Product Portfolio

            19.1.16.3. Profitability by Market Segment

            19.1.16.4. Sales Footprint

            19.1.16.5. Strategy Overview

                19.1.16.5.1. Marketing Strategy

                19.1.16.5.2. Product Strategy

20. Assumptions & Acronyms Used

21. Research Methodology

List of Tables

Table 1: Global Pet tick and flea Value (US$ Mn) Forecast by Region, 2017-2032

Table 2: Global Pet tick and flea Volume (Mn Units) Forecast by Region, 2017-2032

Table 3: Global Pet tick and flea Value (US$ Mn) Forecast by Products, 2017-2032

Table 4: Global Pet tick and flea Volume (Mn Units) Forecast by Products, 2017-2032

Table 5: Global Pet tick and flea Value (US$ Mn) Forecast by Price , 2017-2032

Table 6: Global Pet tick and flea Volume (Mn Units) Forecast by Price , 2017-2032

Table 7: Global Pet tick and flea Value (US$ Mn) Forecast by By animal , 2017-2032

Table 8: Global Pet tick and flea Volume (Mn Units) Forecast by By animal , 2017-2032

Table 9: Global Pet tick and flea Value (US$ Mn) Forecast by By sales channel , 2017-2032

Table 10: Global Pet tick and flea Volume (Mn Units) Forecast by By sales channel , 2017-2032

Table 11: North America Pet tick and flea Value (US$ Mn) Forecast by Country, 2017-2032

Table 12: North America Pet tick and flea Volume (Mn Units) Forecast by Country, 2017-2032

Table 13: North America Pet tick and flea Value (US$ Mn) Forecast by Products, 2017-2032

Table 14: North America Pet tick and flea Volume (Mn Units) Forecast by Products, 2017-2032

Table 15: North America Pet tick and flea Value (US$ Mn) Forecast by Price , 2017-2032

Table 16: North America Pet tick and flea Volume (Mn Units) Forecast by Price , 2017-2032

Table 17: North America Pet tick and flea Value (US$ Mn) Forecast by By animal , 2017-2032

Table 18: North America Pet tick and flea Volume (Mn Units) Forecast by By animal , 2017-2032

Table 19: North America Pet tick and flea Value (US$ Mn) Forecast by By sales channel , 2017-2032

Table 20: North America Pet tick and flea Volume (Mn Units) Forecast by By sales channel , 2017-2032

Table 21: Latin America Pet tick and flea Value (US$ Mn) Forecast by Country, 2017-2032

Table 22: Latin America Pet tick and flea Volume (Mn Units) Forecast by Country, 2017-2032

Table 23: Latin America Pet tick and flea Value (US$ Mn) Forecast by Products, 2017-2032

Table 24: Latin America Pet tick and flea Volume (Mn Units) Forecast by Products, 2017-2032

Table 25: Latin America Pet tick and flea Value (US$ Mn) Forecast by Price , 2017-2032

Table 26: Latin America Pet tick and flea Volume (Mn Units) Forecast by Price , 2017-2032

Table 27: Latin America Pet tick and flea Value (US$ Mn) Forecast by By animal , 2017-2032

Table 28: Latin America Pet tick and flea Volume (Mn Units) Forecast by By animal , 2017-2032

Table 29: Latin America Pet tick and flea Value (US$ Mn) Forecast by By sales channel , 2017-2032

Table 30: Latin America Pet tick and flea Volume (Mn Units) Forecast by By sales channel , 2017-2032

Table 31: Europe Pet tick and flea Value (US$ Mn) Forecast by Country, 2017-2032

Table 32: Europe Pet tick and flea Volume (Mn Units) Forecast by Country, 2017-2032

Table 33: Europe Pet tick and flea Value (US$ Mn) Forecast by Products, 2017-2032

Table 34: Europe Pet tick and flea Volume (Mn Units) Forecast by Products, 2017-2032

Table 35: Europe Pet tick and flea Value (US$ Mn) Forecast by Price , 2017-2032

Table 36: Europe Pet tick and flea Volume (Mn Units) Forecast by Price , 2017-2032

Table 37: Europe Pet tick and flea Value (US$ Mn) Forecast by By animal , 2017-2032

Table 38: Europe Pet tick and flea Volume (Mn Units) Forecast by By animal , 2017-2032

Table 39: Europe Pet tick and flea Value (US$ Mn) Forecast by By sales channel , 2017-2032

Table 40: Europe Pet tick and flea Volume (Mn Units) Forecast by By sales channel , 2017-2032

Table 41: East Asia Pet tick and flea Value (US$ Mn) Forecast by Country, 2017-2032

Table 42: East Asia Pet tick and flea Volume (Mn Units) Forecast by Country, 2017-2032

Table 43: East Asia Pet tick and flea Value (US$ Mn) Forecast by Products, 2017-2032

Table 44: East Asia Pet tick and flea Volume (Mn Units) Forecast by Products, 2017-2032

Table 45: East Asia Pet tick and flea Value (US$ Mn) Forecast by Price , 2017-2032

Table 46: East Asia Pet tick and flea Volume (Mn Units) Forecast by Price , 2017-2032

Table 47: East Asia Pet tick and flea Value (US$ Mn) Forecast by By animal , 2017-2032

Table 48: East Asia Pet tick and flea Volume (Mn Units) Forecast by By animal , 2017-2032

Table 49: East Asia Pet tick and flea Value (US$ Mn) Forecast by By sales channel , 2017-2032

Table 50: East Asia Pet tick and flea Volume (Mn Units) Forecast by By sales channel , 2017-2032

Table 51: South Asia Pet tick and flea Value (US$ Mn) Forecast by Country, 2017-2032

Table 52: South Asia Pet tick and flea Volume (Mn Units) Forecast by Country, 2017-2032

Table 53: South Asia Pet tick and flea Value (US$ Mn) Forecast by Products, 2017-2032

Table 54: South Asia Pet tick and flea Volume (Mn Units) Forecast by Products, 2017-2032

Table 55: South Asia Pet tick and flea Value (US$ Mn) Forecast by Price , 2017-2032

Table 56: South Asia Pet tick and flea Volume (Mn Units) Forecast by Price , 2017-2032

Table 57: South Asia Pet tick and flea Value (US$ Mn) Forecast by By animal , 2017-2032

Table 58: South Asia Pet tick and flea Volume (Mn Units) Forecast by By animal , 2017-2032

Table 59: South Asia Pet tick and flea Value (US$ Mn) Forecast by By sales channel , 2017-2032

Table 60: South Asia Pet tick and flea Volume (Mn Units) Forecast by By sales channel , 2017-2032

Table 61: Oceania Pet tick and flea Value (US$ Mn) Forecast by Country, 2017-2032

Table 62: Oceania Pet tick and flea Volume (Mn Units) Forecast by Country, 2017-2032

Table 63: Oceania Pet tick and flea Value (US$ Mn) Forecast by Products, 2017-2032

Table 64: Oceania Pet tick and flea Volume (Mn Units) Forecast by Products, 2017-2032

Table 65: Oceania Pet tick and flea Value (US$ Mn) Forecast by Price , 2017-2032

Table 66: Oceania Pet tick and flea Volume (Mn Units) Forecast by Price , 2017-2032

Table 67: Oceania Pet tick and flea Value (US$ Mn) Forecast by By animal , 2017-2032

Table 68: Oceania Pet tick and flea Volume (Mn Units) Forecast by By animal , 2017-2032

Table 69: Oceania Pet tick and flea Value (US$ Mn) Forecast by By sales channel , 2017-2032

Table 70: Oceania Pet tick and flea Volume (Mn Units) Forecast by By sales channel , 2017-2032

Table 71: MEA Pet tick and flea Value (US$ Mn) Forecast by Country, 2017-2032

Table 72: MEA Pet tick and flea Volume (Mn Units) Forecast by Country, 2017-2032

Table 73: MEA Pet tick and flea Value (US$ Mn) Forecast by Products, 2017-2032

Table 74: MEA Pet tick and flea Volume (Mn Units) Forecast by Products, 2017-2032

Table 75: MEA Pet tick and flea Value (US$ Mn) Forecast by Price , 2017-2032

Table 76: MEA Pet tick and flea Volume (Mn Units) Forecast by Price , 2017-2032

Table 77: MEA Pet tick and flea Value (US$ Mn) Forecast by By animal , 2017-2032

Table 78: MEA Pet tick and flea Volume (Mn Units) Forecast by By animal , 2017-2032

Table 79: MEA Pet tick and flea Value (US$ Mn) Forecast by By sales channel , 2017-2032

Table 80: MEA Pet tick and flea Volume (Mn Units) Forecast by By sales channel , 2017-2032

List of Charts

Figure 1: Global Pet tick and flea Value (US$ Mn) by Products, 2022-2032

Figure 2: Global Pet tick and flea Value (US$ Mn) by Price , 2022-2032

Figure 3: Global Pet tick and flea Value (US$ Mn) by By animal , 2022-2032

Figure 4: Global Pet tick and flea Value (US$ Mn) by By sales channel , 2022-2032

Figure 5: Global Pet tick and flea Value (US$ Mn) by Region, 2022-2032

Figure 6: Global Pet tick and flea Value (US$ Mn) Analysis by Region, 2017-2032

Figure 7: Global Pet tick and flea Volume (Mn Units) Analysis by Region, 2017-2032

Figure 8: Global Pet tick and flea Value Share (%) and BPS Analysis by Region, 2022-2032

Figure 9: Global Pet tick and flea Y-o-Y Growth (%) Projections by Region, 2022-2032

Figure 10: Global Pet tick and flea Value (US$ Mn) Analysis by Products, 2017-2032

Figure 11: Global Pet tick and flea Volume (Mn Units) Analysis by Products, 2017-2032

Figure 12: Global Pet tick and flea Value Share (%) and BPS Analysis by Products, 2022-2032

Figure 13: Global Pet tick and flea Y-o-Y Growth (%) Projections by Products, 2022-2032

Figure 14: Global Pet tick and flea Value (US$ Mn) Analysis by Price , 2017-2032

Figure 15: Global Pet tick and flea Volume (Mn Units) Analysis by Price , 2017-2032

Figure 16: Global Pet tick and flea Value Share (%) and BPS Analysis by Price , 2022-2032

Figure 17: Global Pet tick and flea Y-o-Y Growth (%) Projections by Price , 2022-2032

Figure 18: Global Pet tick and flea Value (US$ Mn) Analysis by By animal , 2017-2032

Figure 19: Global Pet tick and flea Volume (Mn Units) Analysis by By animal , 2017-2032

Figure 20: Global Pet tick and flea Value Share (%) and BPS Analysis by By animal , 2022-2032

Figure 21: Global Pet tick and flea Y-o-Y Growth (%) Projections by By animal , 2022-2032

Figure 22: Global Pet tick and flea Value (US$ Mn) Analysis by By sales channel , 2017-2032

Figure 23: Global Pet tick and flea Volume (Mn Units) Analysis by By sales channel , 2017-2032

Figure 24: Global Pet tick and flea Value Share (%) and BPS Analysis by By sales channel , 2022-2032

Figure 25: Global Pet tick and flea Y-o-Y Growth (%) Projections by By sales channel , 2022-2032

Figure 26: Global Pet tick and flea Attractiveness by Products, 2022-2032

Figure 27: Global Pet tick and flea Attractiveness by Price , 2022-2032

Figure 28: Global Pet tick and flea Attractiveness by By animal , 2022-2032

Figure 29: Global Pet tick and flea Attractiveness by By sales channel , 2022-2032

Figure 30: Global Pet tick and flea Attractiveness by Region, 2022-2032

Figure 31: North America Pet tick and flea Value (US$ Mn) by Products, 2022-2032

Figure 32: North America Pet tick and flea Value (US$ Mn) by Price , 2022-2032

Figure 33: North America Pet tick and flea Value (US$ Mn) by By animal , 2022-2032

Figure 34: North America Pet tick and flea Value (US$ Mn) by By sales channel , 2022-2032

Figure 35: North America Pet tick and flea Value (US$ Mn) by Country, 2022-2032

Figure 36: North America Pet tick and flea Value (US$ Mn) Analysis by Country, 2017-2032

Figure 37: North America Pet tick and flea Volume (Mn Units) Analysis by Country, 2017-2032

Figure 38: North America Pet tick and flea Value Share (%) and BPS Analysis by Country, 2022-2032

Figure 39: North America Pet tick and flea Y-o-Y Growth (%) Projections by Country, 2022-2032

Figure 40: North America Pet tick and flea Value (US$ Mn) Analysis by Products, 2017-2032

Figure 41: North America Pet tick and flea Volume (Mn Units) Analysis by Products, 2017-2032

Figure 42: North America Pet tick and flea Value Share (%) and BPS Analysis by Products, 2022-2032

Figure 43: North America Pet tick and flea Y-o-Y Growth (%) Projections by Products, 2022-2032

Figure 44: North America Pet tick and flea Value (US$ Mn) Analysis by Price , 2017-2032

Figure 45: North America Pet tick and flea Volume (Mn Units) Analysis by Price , 2017-2032

Figure 46: North America Pet tick and flea Value Share (%) and BPS Analysis by Price , 2022-2032

Figure 47: North America Pet tick and flea Y-o-Y Growth (%) Projections by Price , 2022-2032

Figure 48: North America Pet tick and flea Value (US$ Mn) Analysis by By animal , 2017-2032

Figure 49: North America Pet tick and flea Volume (Mn Units) Analysis by By animal , 2017-2032

Figure 50: North America Pet tick and flea Value Share (%) and BPS Analysis by By animal , 2022-2032

Figure 51: North America Pet tick and flea Y-o-Y Growth (%) Projections by By animal , 2022-2032

Figure 52: North America Pet tick and flea Value (US$ Mn) Analysis by By sales channel , 2017-2032

Figure 53: North America Pet tick and flea Volume (Mn Units) Analysis by By sales channel , 2017-2032

Figure 54: North America Pet tick and flea Value Share (%) and BPS Analysis by By sales channel , 2022-2032

Figure 55: North America Pet tick and flea Y-o-Y Growth (%) Projections by By sales channel , 2022-2032

Figure 56: North America Pet tick and flea Attractiveness by Products, 2022-2032

Figure 57: North America Pet tick and flea Attractiveness by Price , 2022-2032

Figure 58: North America Pet tick and flea Attractiveness by By animal , 2022-2032

Figure 59: North America Pet tick and flea Attractiveness by By sales channel , 2022-2032

Figure 60: North America Pet tick and flea Attractiveness by Country, 2022-2032

Figure 61: Latin America Pet tick and flea Value (US$ Mn) by Products, 2022-2032

Figure 62: Latin America Pet tick and flea Value (US$ Mn) by Price , 2022-2032

Figure 63: Latin America Pet tick and flea Value (US$ Mn) by By animal , 2022-2032

Figure 64: Latin America Pet tick and flea Value (US$ Mn) by By sales channel , 2022-2032

Figure 65: Latin America Pet tick and flea Value (US$ Mn) by Country, 2022-2032

Figure 66: Latin America Pet tick and flea Value (US$ Mn) Analysis by Country, 2017-2032

Figure 67: Latin America Pet tick and flea Volume (Mn Units) Analysis by Country, 2017-2032

Figure 68: Latin America Pet tick and flea Value Share (%) and BPS Analysis by Country, 2022-2032

Figure 69: Latin America Pet tick and flea Y-o-Y Growth (%) Projections by Country, 2022-2032

Figure 70: Latin America Pet tick and flea Value (US$ Mn) Analysis by Products, 2017-2032

Figure 71: Latin America Pet tick and flea Volume (Mn Units) Analysis by Products, 2017-2032

Figure 72: Latin America Pet tick and flea Value Share (%) and BPS Analysis by Products, 2022-2032

Figure 73: Latin America Pet tick and flea Y-o-Y Growth (%) Projections by Products, 2022-2032

Figure 74: Latin America Pet tick and flea Value (US$ Mn) Analysis by Price , 2017-2032

Figure 75: Latin America Pet tick and flea Volume (Mn Units) Analysis by Price , 2017-2032

Figure 76: Latin America Pet tick and flea Value Share (%) and BPS Analysis by Price , 2022-2032

Figure 77: Latin America Pet tick and flea Y-o-Y Growth (%) Projections by Price , 2022-2032

Figure 78: Latin America Pet tick and flea Value (US$ Mn) Analysis by By animal , 2017-2032

Figure 79: Latin America Pet tick and flea Volume (Mn Units) Analysis by By animal , 2017-2032

Figure 80: Latin America Pet tick and flea Value Share (%) and BPS Analysis by By animal , 2022-2032

Figure 81: Latin America Pet tick and flea Y-o-Y Growth (%) Projections by By animal , 2022-2032

Figure 82: Latin America Pet tick and flea Value (US$ Mn) Analysis by By sales channel , 2017-2032

Figure 83: Latin America Pet tick and flea Volume (Mn Units) Analysis by By sales channel , 2017-2032

Figure 84: Latin America Pet tick and flea Value Share (%) and BPS Analysis by By sales channel , 2022-2032

Figure 85: Latin America Pet tick and flea Y-o-Y Growth (%) Projections by By sales channel , 2022-2032

Figure 86: Latin America Pet tick and flea Attractiveness by Products, 2022-2032

Figure 87: Latin America Pet tick and flea Attractiveness by Price , 2022-2032

Figure 88: Latin America Pet tick and flea Attractiveness by By animal , 2022-2032

Figure 89: Latin America Pet tick and flea Attractiveness by By sales channel , 2022-2032

Figure 90: Latin America Pet tick and flea Attractiveness by Country, 2022-2032

Figure 91: Europe Pet tick and flea Value (US$ Mn) by Products, 2022-2032

Figure 92: Europe Pet tick and flea Value (US$ Mn) by Price , 2022-2032

Figure 93: Europe Pet tick and flea Value (US$ Mn) by By animal , 2022-2032

Figure 94: Europe Pet tick and flea Value (US$ Mn) by By sales channel , 2022-2032

Figure 95: Europe Pet tick and flea Value (US$ Mn) by Country, 2022-2032

Figure 96: Europe Pet tick and flea Value (US$ Mn) Analysis by Country, 2017-2032

Figure 97: Europe Pet tick and flea Volume (Mn Units) Analysis by Country, 2017-2032

Figure 98: Europe Pet tick and flea Value Share (%) and BPS Analysis by Country, 2022-2032

Figure 99: Europe Pet tick and flea Y-o-Y Growth (%) Projections by Country, 2022-2032

Figure 100: Europe Pet tick and flea Value (US$ Mn) Analysis by Products, 2017-2032

Figure 101: Europe Pet tick and flea Volume (Mn Units) Analysis by Products, 2017-2032

Figure 102: Europe Pet tick and flea Value Share (%) and BPS Analysis by Products, 2022-2032

Figure 103: Europe Pet tick and flea Y-o-Y Growth (%) Projections by Products, 2022-2032

Figure 104: Europe Pet tick and flea Value (US$ Mn) Analysis by Price , 2017-2032

Figure 105: Europe Pet tick and flea Volume (Mn Units) Analysis by Price , 2017-2032

Figure 106: Europe Pet tick and flea Value Share (%) and BPS Analysis by Price , 2022-2032

Figure 107: Europe Pet tick and flea Y-o-Y Growth (%) Projections by Price , 2022-2032

Figure 108: Europe Pet tick and flea Value (US$ Mn) Analysis by By animal , 2017-2032

Figure 109: Europe Pet tick and flea Volume (Mn Units) Analysis by By animal , 2017-2032

Figure 110: Europe Pet tick and flea Value Share (%) and BPS Analysis by By animal , 2022-2032

Figure 111: Europe Pet tick and flea Y-o-Y Growth (%) Projections by By animal , 2022-2032

Figure 112: Europe Pet tick and flea Value (US$ Mn) Analysis by By sales channel , 2017-2032

Figure 113: Europe Pet tick and flea Volume (Mn Units) Analysis by By sales channel , 2017-2032

Figure 114: Europe Pet tick and flea Value Share (%) and BPS Analysis by By sales channel , 2022-2032

Figure 115: Europe Pet tick and flea Y-o-Y Growth (%) Projections by By sales channel , 2022-2032

Figure 116: Europe Pet tick and flea Attractiveness by Products, 2022-2032

Figure 117: Europe Pet tick and flea Attractiveness by Price , 2022-2032

Figure 118: Europe Pet tick and flea Attractiveness by By animal , 2022-2032

Figure 119: Europe Pet tick and flea Attractiveness by By sales channel , 2022-2032

Figure 120: Europe Pet tick and flea Attractiveness by Country, 2022-2032

Figure 121: East Asia Pet tick and flea Value (US$ Mn) by Products, 2022-2032

Figure 122: East Asia Pet tick and flea Value (US$ Mn) by Price , 2022-2032

Figure 123: East Asia Pet tick and flea Value (US$ Mn) by By animal , 2022-2032

Figure 124: East Asia Pet tick and flea Value (US$ Mn) by By sales channel , 2022-2032

Figure 125: East Asia Pet tick and flea Value (US$ Mn) by Country, 2022-2032

Figure 126: East Asia Pet tick and flea Value (US$ Mn) Analysis by Country, 2017-2032

Figure 127: East Asia Pet tick and flea Volume (Mn Units) Analysis by Country, 2017-2032

Figure 128: East Asia Pet tick and flea Value Share (%) and BPS Analysis by Country, 2022-2032

Figure 129: East Asia Pet tick and flea Y-o-Y Growth (%) Projections by Country, 2022-2032

Figure 130: East Asia Pet tick and flea Value (US$ Mn) Analysis by Products, 2017-2032

Figure 131: East Asia Pet tick and flea Volume (Mn Units) Analysis by Products, 2017-2032

Figure 132: East Asia Pet tick and flea Value Share (%) and BPS Analysis by Products, 2022-2032

Figure 133: East Asia Pet tick and flea Y-o-Y Growth (%) Projections by Products, 2022-2032

Figure 134: East Asia Pet tick and flea Value (US$ Mn) Analysis by Price , 2017-2032

Figure 135: East Asia Pet tick and flea Volume (Mn Units) Analysis by Price , 2017-2032

Figure 136: East Asia Pet tick and flea Value Share (%) and BPS Analysis by Price , 2022-2032

Figure 137: East Asia Pet tick and flea Y-o-Y Growth (%) Projections by Price , 2022-2032

Figure 138: East Asia Pet tick and flea Value (US$ Mn) Analysis by By animal , 2017-2032

Figure 139: East Asia Pet tick and flea Volume (Mn Units) Analysis by By animal , 2017-2032

Figure 140: East Asia Pet tick and flea Value Share (%) and BPS Analysis by By animal , 2022-2032

Figure 141: East Asia Pet tick and flea Y-o-Y Growth (%) Projections by By animal , 2022-2032

Figure 142: East Asia Pet tick and flea Value (US$ Mn) Analysis by By sales channel , 2017-2032

Figure 143: East Asia Pet tick and flea Volume (Mn Units) Analysis by By sales channel , 2017-2032

Figure 144: East Asia Pet tick and flea Value Share (%) and BPS Analysis by By sales channel , 2022-2032

Figure 145: East Asia Pet tick and flea Y-o-Y Growth (%) Projections by By sales channel , 2022-2032

Figure 146: East Asia Pet tick and flea Attractiveness by Products, 2022-2032

Figure 147: East Asia Pet tick and flea Attractiveness by Price , 2022-2032

Figure 148: East Asia Pet tick and flea Attractiveness by By animal , 2022-2032

Figure 149: East Asia Pet tick and flea Attractiveness by By sales channel , 2022-2032

Figure 150: East Asia Pet tick and flea Attractiveness by Country, 2022-2032

Figure 151: South Asia Pet tick and flea Value (US$ Mn) by Products, 2022-2032

Figure 152: South Asia Pet tick and flea Value (US$ Mn) by Price , 2022-2032

Figure 153: South Asia Pet tick and flea Value (US$ Mn) by By animal , 2022-2032

Figure 154: South Asia Pet tick and flea Value (US$ Mn) by By sales channel , 2022-2032

Figure 155: South Asia Pet tick and flea Value (US$ Mn) by Country, 2022-2032

Figure 156: South Asia Pet tick and flea Value (US$ Mn) Analysis by Country, 2017-2032

Figure 157: South Asia Pet tick and flea Volume (Mn Units) Analysis by Country, 2017-2032

Figure 158: South Asia Pet tick and flea Value Share (%) and BPS Analysis by Country, 2022-2032

Figure 159: South Asia Pet tick and flea Y-o-Y Growth (%) Projections by Country, 2022-2032

Figure 160: South Asia Pet tick and flea Value (US$ Mn) Analysis by Products, 2017-2032

Figure 161: South Asia Pet tick and flea Volume (Mn Units) Analysis by Products, 2017-2032

Figure 162: South Asia Pet tick and flea Value Share (%) and BPS Analysis by Products, 2022-2032

Figure 163: South Asia Pet tick and flea Y-o-Y Growth (%) Projections by Products, 2022-2032

Figure 164: South Asia Pet tick and flea Value (US$ Mn) Analysis by Price , 2017-2032

Figure 165: South Asia Pet tick and flea Volume (Mn Units) Analysis by Price , 2017-2032

Figure 166: South Asia Pet tick and flea Value Share (%) and BPS Analysis by Price , 2022-2032

Figure 167: South Asia Pet tick and flea Y-o-Y Growth (%) Projections by Price , 2022-2032

Figure 168: South Asia Pet tick and flea Value (US$ Mn) Analysis by By animal , 2017-2032

Figure 169: South Asia Pet tick and flea Volume (Mn Units) Analysis by By animal , 2017-2032

Figure 170: South Asia Pet tick and flea Value Share (%) and BPS Analysis by By animal , 2022-2032

Figure 171: South Asia Pet tick and flea Y-o-Y Growth (%) Projections by By animal , 2022-2032

Figure 172: South Asia Pet tick and flea Value (US$ Mn) Analysis by By sales channel , 2017-2032

Figure 173: South Asia Pet tick and flea Volume (Mn Units) Analysis by By sales channel , 2017-2032

Figure 174: South Asia Pet tick and flea Value Share (%) and BPS Analysis by By sales channel , 2022-2032

Figure 175: South Asia Pet tick and flea Y-o-Y Growth (%) Projections by By sales channel , 2022-2032

Figure 176: South Asia Pet tick and flea Attractiveness by Products, 2022-2032

Figure 177: South Asia Pet tick and flea Attractiveness by Price , 2022-2032

Figure 178: South Asia Pet tick and flea Attractiveness by By animal , 2022-2032

Figure 179: South Asia Pet tick and flea Attractiveness by By sales channel , 2022-2032

Figure 180: South Asia Pet tick and flea Attractiveness by Country, 2022-2032

Figure 181: Oceania Pet tick and flea Value (US$ Mn) by Products, 2022-2032

Figure 182: Oceania Pet tick and flea Value (US$ Mn) by Price , 2022-2032

Figure 183: Oceania Pet tick and flea Value (US$ Mn) by By animal , 2022-2032

Figure 184: Oceania Pet tick and flea Value (US$ Mn) by By sales channel , 2022-2032

Figure 185: Oceania Pet tick and flea Value (US$ Mn) by Country, 2022-2032

Figure 186: Oceania Pet tick and flea Value (US$ Mn) Analysis by Country, 2017-2032

Figure 187: Oceania Pet tick and flea Volume (Mn Units) Analysis by Country, 2017-2032

Figure 188: Oceania Pet tick and flea Value Share (%) and BPS Analysis by Country, 2022-2032

Figure 189: Oceania Pet tick and flea Y-o-Y Growth (%) Projections by Country, 2022-2032

Figure 190: Oceania Pet tick and flea Value (US$ Mn) Analysis by Products, 2017-2032

Figure 191: Oceania Pet tick and flea Volume (Mn Units) Analysis by Products, 2017-2032

Figure 192: Oceania Pet tick and flea Value Share (%) and BPS Analysis by Products, 2022-2032

Figure 193: Oceania Pet tick and flea Y-o-Y Growth (%) Projections by Products, 2022-2032

Figure 194: Oceania Pet tick and flea Value (US$ Mn) Analysis by Price , 2017-2032

Figure 195: Oceania Pet tick and flea Volume (Mn Units) Analysis by Price , 2017-2032

Figure 196: Oceania Pet tick and flea Value Share (%) and BPS Analysis by Price , 2022-2032

Figure 197: Oceania Pet tick and flea Y-o-Y Growth (%) Projections by Price , 2022-2032

Figure 198: Oceania Pet tick and flea Value (US$ Mn) Analysis by By animal , 2017-2032

Figure 199: Oceania Pet tick and flea Volume (Mn Units) Analysis by By animal , 2017-2032

Figure 200: Oceania Pet tick and flea Value Share (%) and BPS Analysis by By animal , 2022-2032

Figure 201: Oceania Pet tick and flea Y-o-Y Growth (%) Projections by By animal , 2022-2032

Figure 202: Oceania Pet tick and flea Value (US$ Mn) Analysis by By sales channel , 2017-2032

Figure 203: Oceania Pet tick and flea Volume (Mn Units) Analysis by By sales channel , 2017-2032

Figure 204: Oceania Pet tick and flea Value Share (%) and BPS Analysis by By sales channel , 2022-2032

Figure 205: Oceania Pet tick and flea Y-o-Y Growth (%) Projections by By sales channel , 2022-2032

Figure 206: Oceania Pet tick and flea Attractiveness by Products, 2022-2032

Figure 207: Oceania Pet tick and flea Attractiveness by Price , 2022-2032

Figure 208: Oceania Pet tick and flea Attractiveness by By animal , 2022-2032

Figure 209: Oceania Pet tick and flea Attractiveness by By sales channel , 2022-2032

Figure 210: Oceania Pet tick and flea Attractiveness by Country, 2022-2032

Figure 211: MEA Pet tick and flea Value (US$ Mn) by Products, 2022-2032

Figure 212: MEA Pet tick and flea Value (US$ Mn) by Price , 2022-2032

Figure 213: MEA Pet tick and flea Value (US$ Mn) by By animal , 2022-2032

Figure 214: MEA Pet tick and flea Value (US$ Mn) by By sales channel , 2022-2032

Figure 215: MEA Pet tick and flea Value (US$ Mn) by Country, 2022-2032

Figure 216: MEA Pet tick and flea Value (US$ Mn) Analysis by Country, 2017-2032

Figure 217: MEA Pet tick and flea Volume (Mn Units) Analysis by Country, 2017-2032

Figure 218: MEA Pet tick and flea Value Share (%) and BPS Analysis by Country, 2022-2032

Figure 219: MEA Pet tick and flea Y-o-Y Growth (%) Projections by Country, 2022-2032

Figure 220: MEA Pet tick and flea Value (US$ Mn) Analysis by Products, 2017-2032

Figure 221: MEA Pet tick and flea Volume (Mn Units) Analysis by Products, 2017-2032

Figure 222: MEA Pet tick and flea Value Share (%) and BPS Analysis by Products, 2022-2032

Figure 223: MEA Pet tick and flea Y-o-Y Growth (%) Projections by Products, 2022-2032

Figure 224: MEA Pet tick and flea Value (US$ Mn) Analysis by Price , 2017-2032

Figure 225: MEA Pet tick and flea Volume (Mn Units) Analysis by Price , 2017-2032

Figure 226: MEA Pet tick and flea Value Share (%) and BPS Analysis by Price , 2022-2032

Figure 227: MEA Pet tick and flea Y-o-Y Growth (%) Projections by Price , 2022-2032

Figure 228: MEA Pet tick and flea Value (US$ Mn) Analysis by By animal , 2017-2032

Figure 229: MEA Pet tick and flea Volume (Mn Units) Analysis by By animal , 2017-2032

Figure 230: MEA Pet tick and flea Value Share (%) and BPS Analysis by By animal , 2022-2032

Figure 231: MEA Pet tick and flea Y-o-Y Growth (%) Projections by By animal , 2022-2032

Figure 232: MEA Pet tick and flea Value (US$ Mn) Analysis by By sales channel , 2017-2032

Figure 233: MEA Pet tick and flea Volume (Mn Units) Analysis by By sales channel , 2017-2032

Figure 234: MEA Pet tick and flea Value Share (%) and BPS Analysis by By sales channel , 2022-2032

Figure 235: MEA Pet tick and flea Y-o-Y Growth (%) Projections by By sales channel , 2022-2032

Figure 236: MEA Pet tick and flea Attractiveness by Products, 2022-2032

Figure 237: MEA Pet tick and flea Attractiveness by Price , 2022-2032

Figure 238: MEA Pet tick and flea Attractiveness by By animal , 2022-2032

Figure 239: MEA Pet tick and flea Attractiveness by By sales channel , 2022-2032

Figure 240: MEA Pet tick and flea Attractiveness by Country, 2022-2032

Recommendations

Food and Beverage

Fish Meal Market

Published : March 2024

Food and Beverage

Fish Feed Market

Published : August 2023

Consumer Product

Fish Tank Water Additives Market

Published : January 2023

Explore Consumer Product Insights

View Reports

Pet Tick and Flea Prevention Market