Reports

- Global Locations -

Headquarters

Future Market Insights, Inc.

Christiana Corporate, 200
Continental Drive, Suite 401,
Newark, Delaware - 19713,
United States

T: +1-845-579-5705

Americas

Future Market Insights, Inc.

616 Corporate Way, Suite 2-9018,
Valley Cottage, NY 10989, United States

T: +1-347-918-3531

MEA

Future Market Insights

1602-6 Jumeirah Bay X2 Tower, Plot No: JLT-PH2-X2A,
Jumeirah Lakes Towers, Dubai,
United Arab Emirates

Europe

Future Market Insights

3rd Floor, 207 Regent Street,
W1B 3HH London
United Kingdom

T: + 44 (0) 20 8123 9659
D: +44 (0) 20 3287 4268

Asia Pacific

Future Market Insights

IndiaLand Global Tech Park, Unit UG-1, Behind Grand HighStreet, Phase 1, Hinjawadi, MH, Pune – 411057, India

Pet Perfume Market Outlook (2022 to 2032)

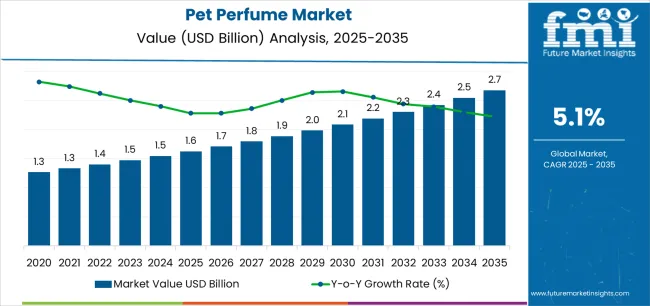
According to a recent report published by Future Market Insights, the pet perfume market size is estimated at US$ 1.4 Billion in 2022. The pet culture is gradually taking a front seat, especially in developed countries. The undercurrents of the pet culture trends are also reaching developing countries, which is proving to be emerging economy for the pet perfume market.

Given the influence, the demand for pet perfume is likely to grow to a valuation of US$ 2.3 Billion by 2032 with an anticipated CAGR of 5% through 2032.

Attributes Details
Pet Perfume Market Estimated Size in 2022 US$ 1.4 Billion
Pet Perfume Market Estimated Size in 2032 US$ 2.3 Billion
Pet Perfume Market CAGR (2022 to 2032) 5%
Market Share Acquired by Top Three Players 1% - 5%

There has been an acute shift in sentiments felt toward pet care, which is opening new avenues for the growth of pet grooming products. The cost to consider while adopting a pet is blurring the boundaries between highs and lows, unlike a decade ago. In addition to this, spending on pet care products is also rising, which creates a pathway for pet shampoos, pet cosmetics, pet hair products, pet watches, and more.

From the other pet care products, pet odor is taking upfront shelves in the pet grooming market. In addition to this, the online sales channel offers a cut above the conventional brick-and-mortar purchase through their subscription model on repeat purchases of pet cologne. This discount often lures end users into repeat purchases in exchange for marking their loyalty toward a brand.

Among other pets in the category, dogs and cats remain unrivaled contenders in the adoption list. As a result, the demand for dog perfumes and cat perfumes alongside grooming care products is anticipated to stay modest yet on an upward trajectory during the forecast period.

Don't pay for what you don't need

Customize your report by selecting specific countries or regions and save 30%!

3 Key Trends Shaping up the Consumption Scenario of Pet Perfumes

Emerging trends in the pet perfumes market include:

  • Strip the Unnecessary:

Pet perfumes for dogs and cats are turning more skin-friendly as manufacturers are focusing on using organic and natural ingredients. As a result, harmful and redundant chemicals are being stripped from the deodorizers for dogs to keep reactions and allergies at bay.

  • Scramble to a Cleaner Substitute:

The pet care market is progressing in the same direction as the cosmetic market for humans and towards the influence of organic products. This trend also gives way to the proliferation of DIY dog perfume without essential oils and similar DIY products. However, in order to regain the lost revenue through DIY means, manufacturers are rethinking their manufacturing abilities.

Key companies producing pet perfumes are circling back to their Research and Development processes to formulate a cleaner alternative to chemical-based products. Some of the perfumes, heavy on chemicals, often causes itchy skin and inflammation, thereby causing irritation. Hence, manufacturers are being mindful of their well-being and inching toward a more natural means of odor extraction and processing. Given the influence, the demand for natural dog perfume is on the rise, and it is likely to grow at a significant pace; especially in developed countries such as the USA, France, Germany, and Canada.

  • Online Sales Channel vs Physical Stores:

Online sales channels are likely to outpace sales closed through physical stores. Pet perfumes are not widely available as other pet products such as dog shampoos. However, the demand for pet perfumes is likely to rise from the online sales channel over the physical stores.

How is the Pet Perfume Market Outperforming its Historical Performance?

The pet perfume market is estimated to witness moderate pet perfume market growth for the forecast period. The rising importance of personal pet grooming is likely to lead to a demand for pet perfume, further pushing for a steady recovery in the short term, with a positive pet perfume market growth stance in the long run.

The pet perfume market's key trends and opportunities are expected to be driven by increased spending on personal pet products along with the continuous innovation in pet perfume products also boosting the pet perfume market's future trends.

Factors such as rising pet dog adoption and increasing awareness of pet hygiene are estimated to contribute to sales of pet perfume along with the pet perfume market growth. Further, increasing consumers’ income and standard of living are expected to have a positive impact on the pet perfume market's future trends as well as the pet perfume market opportunities. The growing e-commerce industry is expected to have a positive impact on the pet perfume market opportunities.

Sneha Verghese
Sneha Verghese

Principal Consultant

Talk to Analyst

Find your sweet spots for generating winning opportunities in this market.

What are the Key Demand Drivers Governing Sales of Pet Perfume in the Global Market?

The pet population has been significantly increasing in numerous high-income countries. Pets are considered to be one of the family members in the present era. Maintaining their hygiene is one of the main concerns of the owners, to avoid a prolonged skin disease which strengthens the demand for pet perfume along with the adoption of pet perfume.

Most pet owners have a common problem of obscene smells from their pets. Since the pets are not made to bathe on a day-to-day basis owing to arising of health issues such as skin itching. That’s why there’s always a chance of developing a foul smell on the pet’s fur escalating the demand for pet perfume.

Considering the above factors, the demand for pet perfume is positively surging and hence, the producers are bringing various fragrances to attract more customers and expand their base. Further, contributes to the pet perfume market growth as well as sales of pet perfume.

What are the Opportunities of Sales for pet perfume products in the Global Market?

Most pet owners prefer the products to be scented with natural and synthetic elements and the rising number of fragrances to be created by various pet perfume companies like Alpha Aromatics and Arm & Hammer, who have to design, created, and supply varieties of scents while simultaneously meeting the standards set for the products. Hence, maintaining the brands’ goodwill in the pet perfume market.

Get the data you need at a Fraction of the cost

Personalize your report by choosing insights you need
and save 40%!

Category-wise Insights

Which Pet Animal Type is Prominent in India?

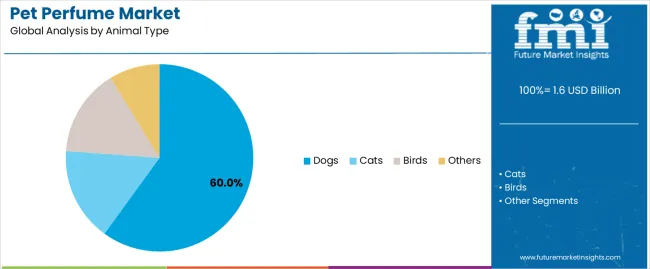
Dogs are the most common and popular pets in India. It is due to the easy availability and the loyalty they showcase toward their owners. Most people prefer their pets to be obedient and trustworthy; hence dogs are considered the best option.

It is a known certainty that dogs will obey their owners unaware of the risks of it. That is the main reason why police and the army view dogs as the most truthful and courageous buddies an official could have in any case of emergency which results in a boost of the pet perfume market's future trends.

Why are Different Types of Ingredients Used for Making Pet Perfumes?

Pet allergies define the ingredient of the product

Just like humans have allergies to specific things just like pet animals also have allergies to ingredients used for the making of pet perfumes. For most pet animals especially dogs and cats, alcohol is toxic.

An alcoholic substance called ethanol is mainly used for pet perfumes; the consequence caused due to its usage is poisoning leading to unconsciousness, nervous breakdown, and even death which may hamper pet perfume market trends and outlooks.

What Price Range Products are Preferred by Consumers?

Mass ranged products are affordable to consumers across the globe

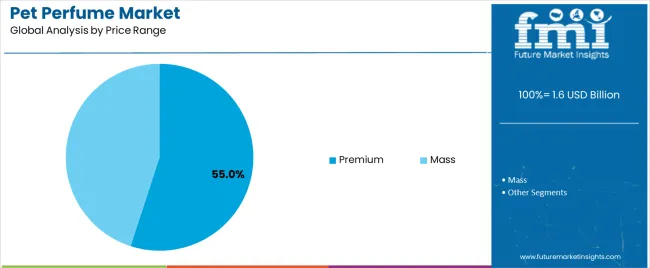
Pet perfume products in the mid-price bracket are currently the most popular, in the year 2022 the pet perfume market share is expected to be roughly about 45%. Many consumers worldwide fall in the category of mass class i.e. middle-class income.

As a result, they choose products that provide superior results at an affordable rate. Additionally, key companies in the pet perfume market are offering a varied choice of products under the mass price range segment.

Country-wise Insights

Which Country Holds a Significant Share in the Global Pet Perfume Market?

67% of the USA households own a pet animal and 30% suffer from allergies

The US pet perfume market is considered the major shareholder in the pet perfume market. As mentioned above, owning a pet in 67% of households signifies the extensive expenditure on maintaining their pet’s health and hygiene.

More than 30% of US citizens suffer from various allergies to pets. Different allergies are developed like nose irritations, skin rashes, and inflammation in the eye, etc.; regardless of which people still keep their pets close to them irrespective of the allergies. Hence, to neutralize the reaction, they use various perfumes for their pets. This leads to an increase in pet perfume consumption for pets in the US as well as the pet perfume market's key trends and opportunities.

What is the Demand Outlook for the Pet Perfume Market in China?

China is one of the fastest-growing markets for pet perfume products in Asia

In the present period, the Asian region (Indonesia, Malaysia, China, and Thailand) have been contributing a greater pet perfume market share. The main reason for these regions to have high sales of pet perfume is the fact that there has a reasonable rate of pet adoption influencing the pet perfume adoption trends.

Most of the consumers of this region consider a lot about the health and hygiene of their pets and see them as members of the family. These concerns lead to spending more of their income on their pet’s well-being ushering in pet perfume market trends. This region is ahead when it comes to pet perfume production as there is a high presence of chemical industries and a massive production capacity surging the pet perfume market's future trends.

Due to the sufficient availability of raw materials and low labor costs, the pet perfume market manufacturers can produce the products at much lesser rates in comparison to manufacturers of other regions.

Which Country has the Highest Pet Bird Population?

54% of Brazil’s land is covered by trees.

Brazil has the highest pet bird population due to its prominent presence all over the country. About 54% of the land is covered by trees and forests; due its rich-biological and varied diversity makes it a unique habitation for birds all over the world influencing the pet perfume market share.

The variety and rare species of birds attract people’s attention and they end up catching them to turn the birds into their pets. Thus, there has been a huge increase in pet birds among Brazilian households over the period boosting the pet perfume market opportunities.

Start-up vs Established Players - Who Reign the Pet Perfume Market?

The pet perfume market features a number of start-up players. In order to benefit financially and satisfy consumer demand for pet perfume, start-ups are resorting to innovative products with natural yet appealing fragrances for pets.

Many of the pet perfume market competitors are selling custom-made dog perfume, which includes a name tag on the perfume bottle and a flavor that is personalized. All of these tactics are intended to increase consumer interest in pet perfume market producers.

In stark contrast, key companies operating in the pet perfume market are aiming at strategic collaborations and partnerships with other producers to develop their product range to address the demand of an increasing number of consumers surging the demand for pet perfume together with pet perfume adoption trends.

Recent Development:

Launch:

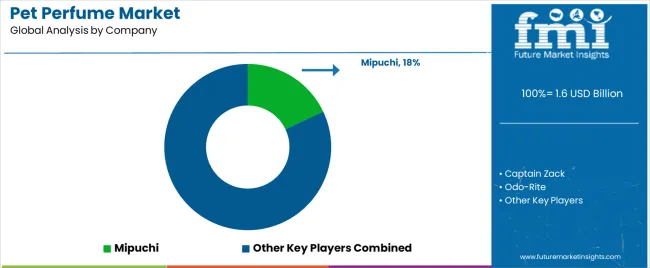
  • In 2021, Mipuchi, a New Zealand-based company launched the world’s first luxury dog perfume made with natural medicinal herbs and aromatherapy-grade ingredients. This product is completely free from parabens, alcohol, sulfates, and other harmful chemicals. Its price comes within the range of the premium class.

New Product:

  • On 20 July 2021, Captain Zack released an affordable dog perfume. It is made of extracts of Aloe Vera and vitamin E with a blueberry fragrance. It also helps in controlling odor and maintains smell for 12 long hours. As it is affordable, it can be purchased by mass-class consumers.

Overall, given the organic and inorganic growth strategies adopted by market players, the market for pet perfumes is likely to remain under the reigns of established players.

Key Players

  • Mipuchi
  • Captain Zack
  • Odo-Rite
  • Alpha Aromatics
  • Boltz
  • Petveda
  • Pets Empire
  • Bodhi Dog
  • Earth Bath
  • South Barks
  • Lambert Kay
  • Guangzhou Yilong Daily Chemicals Company Ltd
  • Borammy
  • Melao
  • Arm & Hammer
  • Nature's Miracle
  • Vetnique Labs
  • other prominent players

Market: Segmentation

By Form Type :

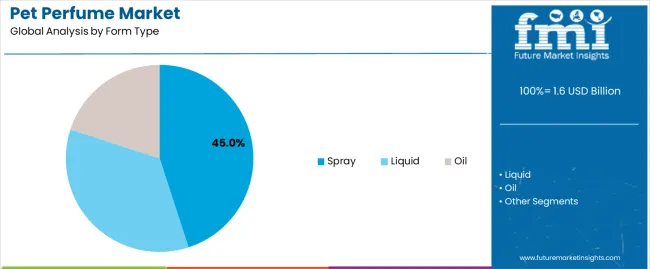
  • Spray
  • Liquid
  • Oil

By Animal Type :

  • Dogs
  • Cats
  • Birds
  • Others

By Price Range :

  • Mass
  • Premium

By Ingredient Type :

  • Alcoholic
  • Non-Alcoholic

By Sales Channels :

  • Veterinary Clinics
  • Online Retailing
  • Wholesalers/ Distributors
  • Supermarkets/Hypermarkets
  • Pharmacy/ Drugstores
  • Convenience Store
  • Pet Specialty Stores
  • Other Sales Channel

By Region :

  • North America
  • Latin America
  • Europe
  • East Asia
  • South Asia
  • Oceania
  • Middle East and Africa (MEA)

Frequently Asked Questions

How big is the global pet perfume market?

The top pet perfume market players hold a share of 5%-8%.

What are the factors driving the pet perfume market?

The main factors that drive the pet perfume market opportunities are pet humanization and the increased importance of health and hygiene.

Which country has the highest population of pet dogs in the world?

The USA has the highest pet dog population with approximately 40% of the USA households owning a dog.

What is the pet perfume market growth?

The pet perfume market size has set a CAGR of 5.0% for the year 2032.

Table of Content

1. Executive Summary | Pet Perfume Market

    1.1. Global Market Outlook

    1.2. Demand-side Trends

    1.3. Supply-side Trends

    1.4. Technology Roadmap Analysis

    1.5. Analysis and Recommendations

2. Market Overview

    2.1. Market Coverage / Taxonomy

    2.2. Market Definition / Scope / Limitations

3. Market Background

    3.1. Market Dynamics

        3.1.1. Drivers

        3.1.2. Restraints

        3.1.3. Opportunity

        3.1.4. Trends

    3.2. Scenario Forecast

        3.2.1. Demand in Optimistic Scenario

        3.2.2. Demand in Likely Scenario

        3.2.3. Demand in Conservative Scenario

    3.3. Opportunity Map Analysis

    3.4. Investment Feasibility Matrix

    3.5. PESTLE and Porter’s Analysis

    3.6. Regulatory Landscape

        3.6.1. By Key Regions

        3.6.2. By Key Countries

4. Global Analysis 2017 to 2021 and Forecast, 2022 to 2032

    4.1. Historical Market Size Value (US$ Million) & Volume(Units) Analysis, 2017 to 2021

    4.2. Current and Future Market Size Value (US$ Million) & Volume(Units) Projections, 2022 to 2032

        4.2.1. Y-o-Y Growth Trend Analysis

        4.2.2. Absolute $ Opportunity Analysis

5. Global Analysis 2017 to 2021 and Forecast 2022 to 2032, By Form Type

    5.1. Introduction / Key Findings

    5.2. Historical Market Size Value (US$ Million) & Volume(Units) Analysis By Form Type, 2017 to 2021

    5.3. Current and Future Market Size Value (US$ Million) & Volume(Units) Analysis and Forecast By Form Type, 2022 to 2032

        5.3.1. Spray

        5.3.2. Liquid

        5.3.3. Oil

    5.4. Y-o-Y Growth Trend Analysis By Form Type, 2017 to 2021

    5.5. Absolute $ Opportunity Analysis By Form Type, 2022 to 2032

6. Global Analysis 2017 to 2021 and Forecast 2022 to 2032, By Animal Type

    6.1. Introduction / Key Findings

    6.2. Historical Market Size Value (US$ Million) & Volume(Units) Analysis By Animal Type, 2017 to 2021

    6.3. Current and Future Market Size Value (US$ Million) & Volume(Units) Analysis and Forecast By Animal Type, 2022 to 2032

        6.3.1. Dogs

        6.3.2. Cats

        6.3.3. Birds

        6.3.4. Others

    6.4. Y-o-Y Growth Trend Analysis By Animal Type, 2017 to 2021

    6.5. Absolute $ Opportunity Analysis By Animal Type, 2022 to 2032

7. Global Analysis 2017 to 2021 and Forecast 2022 to 2032, By Price Range

    7.1. Introduction / Key Findings

    7.2. Historical Market Size Value (US$ Million) & Volume(Units) Analysis By Price Range, 2017 to 2021

    7.3. Current and Future Market Size Value (US$ Million) & Volume(Units) Analysis and Forecast By Price Range, 2022 to 2032

        7.3.1. Low

        7.3.2. Medium

        7.3.3. Premium

    7.4. Y-o-Y Growth Trend Analysis By Price Range, 2017 to 2021

    7.5. Absolute $ Opportunity Analysis By Price Range, 2022 to 2032

8. Global Analysis 2017 to 2021 and Forecast 2022 to 2032, By Ingredient Type

    8.1. Introduction / Key Findings

    8.2. Historical Market Size Value (US$ Million) & Volume(Units) Analysis By Ingredient Type, 2017 to 2021

    8.3. Current and Future Market Size Value (US$ Million) & Volume(Units) Analysis and Forecast By Ingredient Type, 2022 to 2032

        8.3.1. Alcoholic

        8.3.2. Non-Alcoholic

    8.4. Y-o-Y Growth Trend Analysis By Ingredient Type, 2017 to 2021

    8.5. Absolute $ Opportunity Analysis By Ingredient Type, 2022 to 2032

9. Global Analysis 2017 to 2021 and Forecast 2022 to 2032, By Sales Channels

    9.1. Introduction / Key Findings

    9.2. Historical Market Size Value (US$ Million) & Volume(Units) Analysis By Sales Channels, 2017 to 2021

    9.3. Current and Future Market Size Value (US$ Million) & Volume(Units) Analysis and Forecast By Sales Channels, 2022 to 2032

        9.3.1. Veterinary Clinics

        9.3.2. Online Retailing

        9.3.3. Wholesalers/ Distributors

        9.3.4. Supermarkets/Hypermarkets

        9.3.5. Pharmacy/ Drugstores

        9.3.6. Convenience Store

        9.3.7. Pet Specialty Stores

        9.3.8. Other Sales Channel

    9.4. Y-o-Y Growth Trend Analysis By Sales Channels, 2017 to 2021

    9.5. Absolute $ Opportunity Analysis By Sales Channels, 2022 to 2032

10. Global Analysis 2017 to 2021 and Forecast 2022 to 2032, By Region

    10.1. Introduction

    10.2. Historical Market Size Value (US$ Million) & Volume(Units) Analysis By Region, 2017 to 2021

    10.3. Current Market Size Value (US$ Million) & Volume(Units) Analysis and Forecast By Region, 2022 to 2032

        10.3.1. North America

        10.3.2. Latin America

        10.3.3. Europe

        10.3.4. Asia Pacific

        10.3.5. South Asia

        10.3.6. Oceania

        10.3.7. Middle East and Africa

    10.4. Market Attractiveness Analysis By Region

11. North America Analysis 2017 to 2021 and Forecast 2022 to 2032, By Country

    11.1. Historical Market Size Value (US$ Million) & Volume(Units) Trend Analysis By Market Taxonomy, 2017 to 2021

    11.2. Market Size Value (US$ Million) & Volume(Units) Forecast By Market Taxonomy, 2022 to 2032

        11.2.1. By Country

            11.2.1.1. United States of America

            11.2.1.2. Canada

        11.2.2. By Form Type

        11.2.3. By Animal Type

        11.2.4. By Price Range

        11.2.5. By Ingredient Type

        11.2.6. By Sales Channels

    11.3. Market Attractiveness Analysis

        11.3.1. By Country

        11.3.2. By Form Type

        11.3.3. By Animal Type

        11.3.4. By Price Range

        11.3.5. By Ingredient Type

        11.3.6. By Sales Channels

    11.4. Key Takeaways

12. Latin America Analysis 2017 to 2021 and Forecast 2022 to 2032, By Country

    12.1. Historical Market Size Value (US$ Million) & Volume(Units) Trend Analysis By Market Taxonomy, 2017 to 2021

    12.2. Market Size Value (US$ Million) & Volume(Units) Forecast By Market Taxonomy, 2022 to 2032

        12.2.1. By Country

            12.2.1.1. Brazil

            12.2.1.2. Mexico

            12.2.1.3. Rest of Latin America

        12.2.2. By Form Type

        12.2.3. By Animal Type

        12.2.4. By Price Range

        12.2.5. By Ingredient Type

        12.2.6. By Sales Channels

    12.3. Market Attractiveness Analysis

        12.3.1. By Country

        12.3.2. By Form Type

        12.3.3. By Animal Type

        12.3.4. By Price Range

        12.3.5. By Ingredient Type

        12.3.6. By Sales Channels

    12.4. Key Takeaways

13. Europe Analysis 2017 to 2021 and Forecast 2022 to 2032, By Country

    13.1. Historical Market Size Value (US$ Million) & Volume(Units) Trend Analysis By Market Taxonomy, 2017 to 2021

    13.2. Market Size Value (US$ Million) & Volume(Units) Forecast By Market Taxonomy, 2022 to 2032

        13.2.1. By Country

            13.2.1.1. Germany

            13.2.1.2. Italy

            13.2.1.3. France

            13.2.1.4. United Kingdom

            13.2.1.5. Spain

            13.2.1.6. Russia

            13.2.1.7. BENELUX

            13.2.1.8. Rest of Europe

        13.2.2. By Form Type

        13.2.3. By Animal Type

        13.2.4. By Price Range

        13.2.5. By Ingredient Type

        13.2.6. By Sales Channels

    13.3. Market Attractiveness Analysis

        13.3.1. By Country

        13.3.2. By Form Type

        13.3.3. By Animal Type

        13.3.4. By Price Range

        13.3.5. By Ingredient Type

        13.3.6. By Sales Channels

    13.4. Key Takeaways

14. Asia Pacific Analysis 2017 to 2021 and Forecast 2022 to 2032, By Country

    14.1. Historical Market Size Value (US$ Million) & Volume(Units) Trend Analysis By Market Taxonomy, 2017 to 2021

    14.2. Market Size Value (US$ Million) & Volume(Units) Forecast By Market Taxonomy, 2022 to 2032

        14.2.1. By Country

            14.2.1.1. China

            14.2.1.2. Japan

            14.2.1.3. South Korea

        14.2.2. By Form Type

        14.2.3. By Animal Type

        14.2.4. By Price Range

        14.2.5. By Ingredient Type

        14.2.6. By Sales Channels

    14.3. Market Attractiveness Analysis

        14.3.1. By Country

        14.3.2. By Form Type

        14.3.3. By Animal Type

        14.3.4. By Price Range

        14.3.5. By Ingredient Type

        14.3.6. By Sales Channels

    14.4. Key Takeaways

15. South Asia Analysis 2017 to 2021 and Forecast 2022 to 2032, By Country

    15.1. Historical Market Size Value (US$ Million) & Volume(Units) Trend Analysis By Market Taxonomy, 2017 to 2021

    15.2. Market Size Value (US$ Million) & Volume(Units) Forecast By Market Taxonomy, 2022 to 2032

        15.2.1. By Country

            15.2.1.1. India

            15.2.1.2. Thailand

            15.2.1.3. Malaysia

            15.2.1.4. Indonesia

            15.2.1.5. Rest of South Asia

        15.2.2. By Form Type

        15.2.3. By Animal Type

        15.2.4. By Price Range

        15.2.5. By Ingredient Type

        15.2.6. By Sales Channels

    15.3. Market Attractiveness Analysis

        15.3.1. By Country

        15.3.2. By Form Type

        15.3.3. By Animal Type

        15.3.4. By Price Range

        15.3.5. By Ingredient Type

        15.3.6. By Sales Channels

    15.4. Key Takeaways

16. Oceania Analysis 2017 to 2021 and Forecast 2022 to 2032, By Country

    16.1. Historical Market Size Value (US$ Million) & Volume(Units) Trend Analysis By Market Taxonomy, 2017 to 2021

    16.2. Market Size Value (US$ Million) & Volume(Units) Forecast By Market Taxonomy, 2022 to 2032

        16.2.1. By Country

            16.2.1.1. Australia

            16.2.1.2. New Zealand

        16.2.2. By Form Type

        16.2.3. By Animal Type

        16.2.4. By Price Range

        16.2.5. By Ingredient Type

        16.2.6. By Sales Channels

    16.3. Market Attractiveness Analysis

        16.3.1. By Country

        16.3.2. By Form Type

        16.3.3. By Animal Type

        16.3.4. By Price Range

        16.3.5. By Ingredient Type

        16.3.6. By Sales Channels

    16.4. Key Takeaways

17. Middle East and Africa Analysis 2017 to 2021 and Forecast 2022 to 2032, By Country

    17.1. Historical Market Size Value (US$ Million) & Volume(Units) Trend Analysis By Market Taxonomy, 2017 to 2021

    17.2. Market Size Value (US$ Million) & Volume(Units) Forecast By Market Taxonomy, 2022 to 2032

        17.2.1. By Country

            17.2.1.1. GCC Countries

            17.2.1.2. Turkey

            17.2.1.3. Israel

            17.2.1.4. South Africa

            17.2.1.5. Egypt

            17.2.1.6. Rest of Middle East and Africa

        17.2.2. By Form Type

        17.2.3. By Animal Type

        17.2.4. By Price Range

        17.2.5. By Ingredient Type

        17.2.6. By Sales Channels

    17.3. Market Attractiveness Analysis

        17.3.1. By Country

        17.3.2. By Form Type

        17.3.3. By Animal Type

        17.3.4. By Price Range

        17.3.5. By Ingredient Type

        17.3.6. By Sales Channels

    17.4. Key Takeaways

18. Key Countries Analysis

    18.1. United States of America

        18.1.1. Pricing Analysis

        18.1.2. Market Share Analysis, 2021

            18.1.2.1. By Form Type

            18.1.2.2. By Animal Type

            18.1.2.3. By Price Range

            18.1.2.4. By Ingredient Type

            18.1.2.5. By Sales Channels

    18.2. Canada

        18.2.1. Pricing Analysis

        18.2.2. Market Share Analysis, 2021

            18.2.2.1. By Form Type

            18.2.2.2. By Animal Type

            18.2.2.3. By Price Range

            18.2.2.4. By Ingredient Type

            18.2.2.5. By Sales Channels

    18.3. Brazil

        18.3.1. Pricing Analysis

        18.3.2. Market Share Analysis, 2021

            18.3.2.1. By Form Type

            18.3.2.2. By Animal Type

            18.3.2.3. By Price Range

            18.3.2.4. By Ingredient Type

            18.3.2.5. By Sales Channels

    18.4. Mexico

        18.4.1. Pricing Analysis

        18.4.2. Market Share Analysis, 2021

            18.4.2.1. By Form Type

            18.4.2.2. By Animal Type

            18.4.2.3. By Price Range

            18.4.2.4. By Ingredient Type

            18.4.2.5. By Sales Channels

    18.5. Argentina

        18.5.1. Pricing Analysis

        18.5.2. Market Share Analysis, 2021

            18.5.2.1. By Form Type

            18.5.2.2. By Animal Type

            18.5.2.3. By Price Range

            18.5.2.4. By Ingredient Type

            18.5.2.5. By Sales Channels

    18.6. Germany

        18.6.1. Pricing Analysis

        18.6.2. Market Share Analysis, 2021

            18.6.2.1. By Form Type

            18.6.2.2. By Animal Type

            18.6.2.3. By Price Range

            18.6.2.4. By Ingredient Type

            18.6.2.5. By Sales Channels

    18.7. Italy

        18.7.1. Pricing Analysis

        18.7.2. Market Share Analysis, 2021

            18.7.2.1. By Form Type

            18.7.2.2. By Animal Type

            18.7.2.3. By Price Range

            18.7.2.4. By Ingredient Type

            18.7.2.5. By Sales Channels

    18.8. France

        18.8.1. Pricing Analysis

        18.8.2. Market Share Analysis, 2021

            18.8.2.1. By Form Type

            18.8.2.2. By Animal Type

            18.8.2.3. By Price Range

            18.8.2.4. By Ingredient Type

            18.8.2.5. By Sales Channels

    18.9. United Kingdom

        18.9.1. Pricing Analysis

        18.9.2. Market Share Analysis, 2021

            18.9.2.1. By Form Type

            18.9.2.2. By Animal Type

            18.9.2.3. By Price Range

            18.9.2.4. By Ingredient Type

            18.9.2.5. By Sales Channels

    18.10. Spain

        18.10.1. Pricing Analysis

        18.10.2. Market Share Analysis, 2021

            18.10.2.1. By Form Type

            18.10.2.2. By Animal Type

            18.10.2.3. By Price Range

            18.10.2.4. By Ingredient Type

            18.10.2.5. By Sales Channels

    18.11. Russia

        18.11.1. Pricing Analysis

        18.11.2. Market Share Analysis, 2021

            18.11.2.1. By Form Type

            18.11.2.2. By Animal Type

            18.11.2.3. By Price Range

            18.11.2.4. By Ingredient Type

            18.11.2.5. By Sales Channels

    18.12. BENELUX

        18.12.1. Pricing Analysis

        18.12.2. Market Share Analysis, 2021

            18.12.2.1. By Form Type

            18.12.2.2. By Animal Type

            18.12.2.3. By Price Range

            18.12.2.4. By Ingredient Type

            18.12.2.5. By Sales Channels

    18.13. China

        18.13.1. Pricing Analysis

        18.13.2. Market Share Analysis, 2021

            18.13.2.1. By Form Type

            18.13.2.2. By Animal Type

            18.13.2.3. By Price Range

            18.13.2.4. By Ingredient Type

            18.13.2.5. By Sales Channels

    18.14. Japan

        18.14.1. Pricing Analysis

        18.14.2. Market Share Analysis, 2021

            18.14.2.1. By Form Type

            18.14.2.2. By Animal Type

            18.14.2.3. By Price Range

            18.14.2.4. By Ingredient Type

            18.14.2.5. By Sales Channels

    18.15. South Korea

        18.15.1. Pricing Analysis

        18.15.2. Market Share Analysis, 2021

            18.15.2.1. By Form Type

            18.15.2.2. By Animal Type

            18.15.2.3. By Price Range

            18.15.2.4. By Ingredient Type

            18.15.2.5. By Sales Channels

    18.16. India

        18.16.1. Pricing Analysis

        18.16.2. Market Share Analysis, 2021

            18.16.2.1. By Form Type

            18.16.2.2. By Animal Type

            18.16.2.3. By Price Range

            18.16.2.4. By Ingredient Type

            18.16.2.5. By Sales Channels

    18.17. GCC Countries

        18.17.1. Pricing Analysis

        18.17.2. Market Share Analysis, 2021

            18.17.2.1. By Form Type

            18.17.2.2. By Animal Type

            18.17.2.3. By Price Range

            18.17.2.4. By Ingredient Type

            18.17.2.5. By Sales Channels

    18.18. Turkey

        18.18.1. Pricing Analysis

        18.18.2. Market Share Analysis, 2021

            18.18.2.1. By Form Type

            18.18.2.2. By Animal Type

            18.18.2.3. By Price Range

            18.18.2.4. By Ingredient Type

            18.18.2.5. By Sales Channels

    18.19. Israel

        18.19.1. Pricing Analysis

        18.19.2. Market Share Analysis, 2021

            18.19.2.1. By Form Type

            18.19.2.2. By Animal Type

            18.19.2.3. By Price Range

            18.19.2.4. By Ingredient Type

            18.19.2.5. By Sales Channels

    18.20. South Africa

        18.20.1. Pricing Analysis

        18.20.2. Market Share Analysis, 2021

            18.20.2.1. By Form Type

            18.20.2.2. By Animal Type

            18.20.2.3. By Price Range

            18.20.2.4. By Ingredient Type

            18.20.2.5. By Sales Channels

    18.21. Egypt

        18.21.1. Pricing Analysis

        18.21.2. Market Share Analysis, 2021

            18.21.2.1. By Form Type

            18.21.2.2. By Animal Type

            18.21.2.3. By Price Range

            18.21.2.4. By Ingredient Type

            18.21.2.5. By Sales Channels

19. Market Structure Analysis

    19.1. Competition Dashboard

    19.2. Competition Benchmarking

    19.3. Market Share Analysis of Top Players

        19.3.1. By Regional

        19.3.2. By Form Type

        19.3.3. By Animal Type

        19.3.4. By Price Range

        19.3.5. By Ingredient Type

        19.3.6. By Sales Channels

20. Competition Analysis

    20.1. Competition Deep Dive

        20.1.1. Mipuchi

            20.1.1.1. Overview

            20.1.1.2. Product Portfolio

            20.1.1.3. Profitability by Market Segment

            20.1.1.4. Sales Footprint

            20.1.1.5. Strategy Overview

                20.1.1.5.1. Marketing Strategy

                20.1.1.5.2. Product Strategy

        20.1.2. Captain Zack

            20.1.2.1. Overview

            20.1.2.2. Product Portfolio

            20.1.2.3. Profitability by Market Segment

            20.1.2.4. Sales Footprint

            20.1.2.5. Strategy Overview

                20.1.2.5.1. Marketing Strategy

                20.1.2.5.2. Product Strategy

        20.1.3. Odo-Rite

            20.1.3.1. Overview

            20.1.3.2. Product Portfolio

            20.1.3.3. Profitability by Market Segment

            20.1.3.4. Sales Footprint

            20.1.3.5. Strategy Overview

                20.1.3.5.1. Marketing Strategy

                20.1.3.5.2. Product Strategy

        20.1.4. Alpha Aromatics

            20.1.4.1. Overview

            20.1.4.2. Product Portfolio

            20.1.4.3. Profitability by Market Segment

            20.1.4.4. Sales Footprint

            20.1.4.5. Strategy Overview

                20.1.4.5.1. Marketing Strategy

                20.1.4.5.2. Product Strategy

        20.1.5. Boltz

            20.1.5.1. Overview

            20.1.5.2. Product Portfolio

            20.1.5.3. Profitability by Market Segment

            20.1.5.4. Sales Footprint

            20.1.5.5. Strategy Overview

                20.1.5.5.1. Marketing Strategy

                20.1.5.5.2. Product Strategy

        20.1.6. Petveda

            20.1.6.1. Overview

            20.1.6.2. Product Portfolio

            20.1.6.3. Profitability by Market Segment

            20.1.6.4. Sales Footprint

            20.1.6.5. Strategy Overview

                20.1.6.5.1. Marketing Strategy

                20.1.6.5.2. Product Strategy

        20.1.7. Pets Empire

            20.1.7.1. Overview

            20.1.7.2. Product Portfolio

            20.1.7.3. Profitability by Market Segment

            20.1.7.4. Sales Footprint

            20.1.7.5. Strategy Overview

                20.1.7.5.1. Marketing Strategy

                20.1.7.5.2. Product Strategy

        20.1.8. Bodhi Dog

            20.1.8.1. Overview

            20.1.8.2. Product Portfolio

            20.1.8.3. Profitability by Market Segment

            20.1.8.4. Sales Footprint

            20.1.8.5. Strategy Overview

                20.1.8.5.1. Marketing Strategy

                20.1.8.5.2. Product Strategy

        20.1.9. Earth Bath

            20.1.9.1. Overview

            20.1.9.2. Product Portfolio

            20.1.9.3. Profitability by Market Segment

            20.1.9.4. Sales Footprint

            20.1.9.5. Strategy Overview

                20.1.9.5.1. Marketing Strategy

                20.1.9.5.2. Product Strategy

        20.1.10. South Barks

            20.1.10.1. Overview

            20.1.10.2. Product Portfolio

            20.1.10.3. Profitability by Market Segment

            20.1.10.4. Sales Footprint

            20.1.10.5. Strategy Overview

                20.1.10.5.1. Marketing Strategy

                20.1.10.5.2. Product Strategy

        20.1.11. Lambert Kay

            20.1.11.1. Overview

            20.1.11.2. Product Portfolio

            20.1.11.3. Profitability by Market Segment

            20.1.11.4. Sales Footprint

            20.1.11.5. Strategy Overview

                20.1.11.5.1. Marketing Strategy

                20.1.11.5.2. Product Strategy

        20.1.12. Guangzhou Yilong Daily Chemicals Company Ltd

            20.1.12.1. Overview

            20.1.12.2. Product Portfolio

            20.1.12.3. Profitability by Market Segment

            20.1.12.4. Sales Footprint

            20.1.12.5. Strategy Overview

                20.1.12.5.1. Marketing Strategy

                20.1.12.5.2. Product Strategy

        20.1.13. Borammy

            20.1.13.1. Overview

            20.1.13.2. Product Portfolio

            20.1.13.3. Profitability by Market Segment

            20.1.13.4. Sales Footprint

            20.1.13.5. Strategy Overview

                20.1.13.5.1. Marketing Strategy

                20.1.13.5.2. Product Strategy

21. Assumptions & Acronyms Used

22. Research Methodology

Don't pay for what you don't need

Customize your report by selecting specific countries or regions and save 30%!

List of Tables

Table 1: Global Value (US$ Million) Forecast by Region, 2017 to 2032

Table 2: Global Volume(Units) Forecast by Region, 2017 to 2032

Table 3: Global Value (US$ Million) Forecast by Form Type, 2017 to 2032

Table 4: Global Volume(Units) Forecast by Form Type, 2017 to 2032

Table 5: Global Value (US$ Million) Forecast by Animal Type, 2017 to 2032

Table 6: Global Volume(Units) Forecast by Animal Type, 2017 to 2032

Table 7: Global Value (US$ Million) Forecast by Price Range, 2017 to 2032

Table 8: Global Volume(Units) Forecast by Price Range, 2017 to 2032

Table 9: Global Value (US$ Million) Forecast by Ingredient Type, 2017 to 2032

Table 10: Global Volume(Units) Forecast by Ingredient Type, 2017 to 2032

Table 11: Global Value (US$ Million) Forecast by Sales Channels, 2017 to 2032

Table 12: Global Volume(Units) Forecast by Sales Channels, 2017 to 2032

Table 13: North America Value (US$ Million) Forecast by Country, 2017 to 2032

Table 14: North America Volume(Units) Forecast by Country, 2017 to 2032

Table 15: North America Value (US$ Million) Forecast by Form Type, 2017 to 2032

Table 16: North America Volume(Units) Forecast by Form Type, 2017 to 2032

Table 17: North America Value (US$ Million) Forecast by Animal Type, 2017 to 2032

Table 18: North America Volume(Units) Forecast by Animal Type, 2017 to 2032

Table 19: North America Value (US$ Million) Forecast by Price Range, 2017 to 2032

Table 20: North America Volume(Units) Forecast by Price Range, 2017 to 2032

Table 21: North America Value (US$ Million) Forecast by Ingredient Type, 2017 to 2032

Table 22: North America Volume(Units) Forecast by Ingredient Type, 2017 to 2032

Table 23: North America Value (US$ Million) Forecast by Sales Channels, 2017 to 2032

Table 24: North America Volume(Units) Forecast by Sales Channels, 2017 to 2032

Table 25: Latin America Value (US$ Million) Forecast by Country, 2017 to 2032

Table 26: Latin America Volume(Units) Forecast by Country, 2017 to 2032

Table 27: Latin America Value (US$ Million) Forecast by Form Type, 2017 to 2032

Table 28: Latin America Volume(Units) Forecast by Form Type, 2017 to 2032

Table 29: Latin America Value (US$ Million) Forecast by Animal Type, 2017 to 2032

Table 30: Latin America Volume(Units) Forecast by Animal Type, 2017 to 2032

Table 31: Latin America Value (US$ Million) Forecast by Price Range, 2017 to 2032

Table 32: Latin America Volume(Units) Forecast by Price Range, 2017 to 2032

Table 33: Latin America Value (US$ Million) Forecast by Ingredient Type, 2017 to 2032

Table 34: Latin America Volume(Units) Forecast by Ingredient Type, 2017 to 2032

Table 35: Latin America Value (US$ Million) Forecast by Sales Channels, 2017 to 2032

Table 36: Latin America Volume(Units) Forecast by Sales Channels, 2017 to 2032

Table 37: Europe Value (US$ Million) Forecast by Country, 2017 to 2032

Table 38: Europe Volume(Units) Forecast by Country, 2017 to 2032

Table 39: Europe Value (US$ Million) Forecast by Form Type, 2017 to 2032

Table 40: Europe Volume(Units) Forecast by Form Type, 2017 to 2032

Table 41: Europe Value (US$ Million) Forecast by Animal Type, 2017 to 2032

Table 42: Europe Volume(Units) Forecast by Animal Type, 2017 to 2032

Table 43: Europe Value (US$ Million) Forecast by Price Range, 2017 to 2032

Table 44: Europe Volume(Units) Forecast by Price Range, 2017 to 2032

Table 45: Europe Value (US$ Million) Forecast by Ingredient Type, 2017 to 2032

Table 46: Europe Volume(Units) Forecast by Ingredient Type, 2017 to 2032

Table 47: Europe Value (US$ Million) Forecast by Sales Channels, 2017 to 2032

Table 48: Europe Volume(Units) Forecast by Sales Channels, 2017 to 2032

Table 49: Asia Pacific Value (US$ Million) Forecast by Country, 2017 to 2032

Table 50: Asia Pacific Volume(Units) Forecast by Country, 2017 to 2032

Table 51: Asia Pacific Value (US$ Million) Forecast by Form Type, 2017 to 2032

Table 52: Asia Pacific Volume(Units) Forecast by Form Type, 2017 to 2032

Table 53: Asia Pacific Value (US$ Million) Forecast by Animal Type, 2017 to 2032

Table 54: Asia Pacific Volume(Units) Forecast by Animal Type, 2017 to 2032

Table 55: Asia Pacific Value (US$ Million) Forecast by Price Range, 2017 to 2032

Table 56: Asia Pacific Volume(Units) Forecast by Price Range, 2017 to 2032

Table 57: Asia Pacific Value (US$ Million) Forecast by Ingredient Type, 2017 to 2032

Table 58: Asia Pacific Volume(Units) Forecast by Ingredient Type, 2017 to 2032

Table 59: Asia Pacific Value (US$ Million) Forecast by Sales Channels, 2017 to 2032

Table 60: Asia Pacific Volume(Units) Forecast by Sales Channels, 2017 to 2032

Table 61: South Asia Value (US$ Million) Forecast by Country, 2017 to 2032

Table 62: South Asia Volume(Units) Forecast by Country, 2017 to 2032

Table 63: South Asia Value (US$ Million) Forecast by Form Type, 2017 to 2032

Table 64: South Asia Volume(Units) Forecast by Form Type, 2017 to 2032

Table 65: South Asia Value (US$ Million) Forecast by Animal Type, 2017 to 2032

Table 66: South Asia Volume(Units) Forecast by Animal Type, 2017 to 2032

Table 67: South Asia Value (US$ Million) Forecast by Price Range, 2017 to 2032

Table 68: South Asia Volume(Units) Forecast by Price Range, 2017 to 2032

Table 69: South Asia Value (US$ Million) Forecast by Ingredient Type, 2017 to 2032

Table 70: South Asia Volume(Units) Forecast by Ingredient Type, 2017 to 2032

Table 71: South Asia Value (US$ Million) Forecast by Sales Channels, 2017 to 2032

Table 72: South Asia Volume(Units) Forecast by Sales Channels, 2017 to 2032

Table 73: Oceania Value (US$ Million) Forecast by Country, 2017 to 2032

Table 74: Oceania Volume(Units) Forecast by Country, 2017 to 2032

Table 75: Oceania Value (US$ Million) Forecast by Form Type, 2017 to 2032

Table 76: Oceania Volume(Units) Forecast by Form Type, 2017 to 2032

Table 77: Oceania Value (US$ Million) Forecast by Animal Type, 2017 to 2032

Table 78: Oceania Volume(Units) Forecast by Animal Type, 2017 to 2032

Table 79: Oceania Value (US$ Million) Forecast by Price Range, 2017 to 2032

Table 80: Oceania Volume(Units) Forecast by Price Range, 2017 to 2032

Table 81: Oceania Value (US$ Million) Forecast by Ingredient Type, 2017 to 2032

Table 82: Oceania Volume(Units) Forecast by Ingredient Type, 2017 to 2032

Table 83: Oceania Value (US$ Million) Forecast by Sales Channels, 2017 to 2032

Table 84: Oceania Volume(Units) Forecast by Sales Channels, 2017 to 2032

Table 85: Middle East and Africa Value (US$ Million) Forecast by Country, 2017 to 2032

Table 86: Middle East and Africa Volume(Units) Forecast by Country, 2017 to 2032

Table 87: Middle East and Africa Value (US$ Million) Forecast by Form Type, 2017 to 2032

Table 88: Middle East and Africa Volume(Units) Forecast by Form Type, 2017 to 2032

Table 89: Middle East and Africa Value (US$ Million) Forecast by Animal Type, 2017 to 2032

Table 90: Middle East and Africa Volume(Units) Forecast by Animal Type, 2017 to 2032

Table 91: Middle East and Africa Value (US$ Million) Forecast by Price Range, 2017 to 2032

Table 92: Middle East and Africa Volume(Units) Forecast by Price Range, 2017 to 2032

Table 93: Middle East and Africa Value (US$ Million) Forecast by Ingredient Type, 2017 to 2032

Table 94: Middle East and Africa Volume(Units) Forecast by Ingredient Type, 2017 to 2032

Table 95: Middle East and Africa Value (US$ Million) Forecast by Sales Channels, 2017 to 2032

Table 96: Middle East and Africa Volume(Units) Forecast by Sales Channels, 2017 to 2032
Sneha Verghese
Sneha Verghese

Principal Consultant

Talk to Analyst

Find your sweet spots for generating winning opportunities in this market.

List of Charts

Figure 1: Global Value (US$ Million) by Form Type, 2022 to 2032

Figure 2: Global Value (US$ Million) by Animal Type, 2022 to 2032

Figure 3: Global Value (US$ Million) by Price Range, 2022 to 2032

Figure 4: Global Value (US$ Million) by Ingredient Type, 2022 to 2032

Figure 5: Global Value (US$ Million) by Sales Channels, 2022 to 2032

Figure 6: Global Value (US$ Million) by Region, 2022 to 2032

Figure 7: Global Value (US$ Million) Analysis by Region, 2017 to 2032

Figure 8: Global Volume(Units) Analysis by Region, 2017 to 2032

Figure 9: Global Value Share (%) and BPS Analysis by Region, 2022 to 2032

Figure 10: Global Y-o-Y Growth (%) Projections by Region, 2022 to 2032

Figure 11: Global Value (US$ Million) Analysis by Form Type, 2017 to 2032

Figure 12: Global Volume(Units) Analysis by Form Type, 2017 to 2032

Figure 13: Global Value Share (%) and BPS Analysis by Form Type, 2022 to 2032

Figure 14: Global Y-o-Y Growth (%) Projections by Form Type, 2022 to 2032

Figure 15: Global Value (US$ Million) Analysis by Animal Type, 2017 to 2032

Figure 16: Global Volume(Units) Analysis by Animal Type, 2017 to 2032

Figure 17: Global Value Share (%) and BPS Analysis by Animal Type, 2022 to 2032

Figure 18: Global Y-o-Y Growth (%) Projections by Animal Type, 2022 to 2032

Figure 19: Global Value (US$ Million) Analysis by Price Range, 2017 to 2032

Figure 20: Global Volume(Units) Analysis by Price Range, 2017 to 2032

Figure 21: Global Value Share (%) and BPS Analysis by Price Range, 2022 to 2032

Figure 22: Global Y-o-Y Growth (%) Projections by Price Range, 2022 to 2032

Figure 23: Global Value (US$ Million) Analysis by Ingredient Type, 2017 to 2032

Figure 24: Global Volume(Units) Analysis by Ingredient Type, 2017 to 2032

Figure 25: Global Value Share (%) and BPS Analysis by Ingredient Type, 2022 to 2032

Figure 26: Global Y-o-Y Growth (%) Projections by Ingredient Type, 2022 to 2032

Figure 27: Global Value (US$ Million) Analysis by Sales Channels, 2017 to 2032

Figure 28: Global Volume(Units) Analysis by Sales Channels, 2017 to 2032

Figure 29: Global Value Share (%) and BPS Analysis by Sales Channels, 2022 to 2032

Figure 30: Global Y-o-Y Growth (%) Projections by Sales Channels, 2022 to 2032

Figure 31: Global Attractiveness by Form Type, 2022 to 2032

Figure 32: Global Attractiveness by Animal Type, 2022 to 2032

Figure 33: Global Attractiveness by Price Range, 2022 to 2032

Figure 34: Global Attractiveness by Ingredient Type, 2022 to 2032

Figure 35: Global Attractiveness by Sales Channels, 2022 to 2032

Figure 36: Global Attractiveness by Region, 2022 to 2032

Figure 37: North America Value (US$ Million) by Form Type, 2022 to 2032

Figure 38: North America Value (US$ Million) by Animal Type, 2022 to 2032

Figure 39: North America Value (US$ Million) by Price Range, 2022 to 2032

Figure 40: North America Value (US$ Million) by Ingredient Type, 2022 to 2032

Figure 41: North America Value (US$ Million) by Sales Channels, 2022 to 2032

Figure 42: North America Value (US$ Million) by Country, 2022 to 2032

Figure 43: North America Value (US$ Million) Analysis by Country, 2017 to 2032

Figure 44: North America Volume(Units) Analysis by Country, 2017 to 2032

Figure 45: North America Value Share (%) and BPS Analysis by Country, 2022 to 2032

Figure 46: North America Y-o-Y Growth (%) Projections by Country, 2022 to 2032

Figure 47: North America Value (US$ Million) Analysis by Form Type, 2017 to 2032

Figure 48: North America Volume(Units) Analysis by Form Type, 2017 to 2032

Figure 49: North America Value Share (%) and BPS Analysis by Form Type, 2022 to 2032

Figure 50: North America Y-o-Y Growth (%) Projections by Form Type, 2022 to 2032

Figure 51: North America Value (US$ Million) Analysis by Animal Type, 2017 to 2032

Figure 52: North America Volume(Units) Analysis by Animal Type, 2017 to 2032

Figure 53: North America Value Share (%) and BPS Analysis by Animal Type, 2022 to 2032

Figure 54: North America Y-o-Y Growth (%) Projections by Animal Type, 2022 to 2032

Figure 55: North America Value (US$ Million) Analysis by Price Range, 2017 to 2032

Figure 56: North America Volume(Units) Analysis by Price Range, 2017 to 2032

Figure 57: North America Value Share (%) and BPS Analysis by Price Range, 2022 to 2032

Figure 58: North America Y-o-Y Growth (%) Projections by Price Range, 2022 to 2032

Figure 59: North America Value (US$ Million) Analysis by Ingredient Type, 2017 to 2032

Figure 60: North America Volume(Units) Analysis by Ingredient Type, 2017 to 2032

Figure 61: North America Value Share (%) and BPS Analysis by Ingredient Type, 2022 to 2032

Figure 62: North America Y-o-Y Growth (%) Projections by Ingredient Type, 2022 to 2032

Figure 63: North America Value (US$ Million) Analysis by Sales Channels, 2017 to 2032

Figure 64: North America Volume(Units) Analysis by Sales Channels, 2017 to 2032

Figure 65: North America Value Share (%) and BPS Analysis by Sales Channels, 2022 to 2032

Figure 66: North America Y-o-Y Growth (%) Projections by Sales Channels, 2022 to 2032

Figure 67: North America Attractiveness by Form Type, 2022 to 2032

Figure 68: North America Attractiveness by Animal Type, 2022 to 2032

Figure 69: North America Attractiveness by Price Range, 2022 to 2032

Figure 70: North America Attractiveness by Ingredient Type, 2022 to 2032

Figure 71: North America Attractiveness by Sales Channels, 2022 to 2032

Figure 72: North America Attractiveness by Country, 2022 to 2032

Figure 73: Latin America Value (US$ Million) by Form Type, 2022 to 2032

Figure 74: Latin America Value (US$ Million) by Animal Type, 2022 to 2032

Figure 75: Latin America Value (US$ Million) by Price Range, 2022 to 2032

Figure 76: Latin America Value (US$ Million) by Ingredient Type, 2022 to 2032

Figure 77: Latin America Value (US$ Million) by Sales Channels, 2022 to 2032

Figure 78: Latin America Value (US$ Million) by Country, 2022 to 2032

Figure 79: Latin America Value (US$ Million) Analysis by Country, 2017 to 2032

Figure 80: Latin America Volume(Units) Analysis by Country, 2017 to 2032

Figure 81: Latin America Value Share (%) and BPS Analysis by Country, 2022 to 2032

Figure 82: Latin America Y-o-Y Growth (%) Projections by Country, 2022 to 2032

Figure 83: Latin America Value (US$ Million) Analysis by Form Type, 2017 to 2032

Figure 84: Latin America Volume(Units) Analysis by Form Type, 2017 to 2032

Figure 85: Latin America Value Share (%) and BPS Analysis by Form Type, 2022 to 2032

Figure 86: Latin America Y-o-Y Growth (%) Projections by Form Type, 2022 to 2032

Figure 87: Latin America Value (US$ Million) Analysis by Animal Type, 2017 to 2032

Figure 88: Latin America Volume(Units) Analysis by Animal Type, 2017 to 2032

Figure 89: Latin America Value Share (%) and BPS Analysis by Animal Type, 2022 to 2032

Figure 90: Latin America Y-o-Y Growth (%) Projections by Animal Type, 2022 to 2032

Figure 91: Latin America Value (US$ Million) Analysis by Price Range, 2017 to 2032

Figure 92: Latin America Volume(Units) Analysis by Price Range, 2017 to 2032

Figure 93: Latin America Value Share (%) and BPS Analysis by Price Range, 2022 to 2032

Figure 94: Latin America Y-o-Y Growth (%) Projections by Price Range, 2022 to 2032

Figure 95: Latin America Value (US$ Million) Analysis by Ingredient Type, 2017 to 2032

Figure 96: Latin America Volume(Units) Analysis by Ingredient Type, 2017 to 2032

Figure 97: Latin America Value Share (%) and BPS Analysis by Ingredient Type, 2022 to 2032

Figure 98: Latin America Y-o-Y Growth (%) Projections by Ingredient Type, 2022 to 2032

Figure 99: Latin America Value (US$ Million) Analysis by Sales Channels, 2017 to 2032

Figure 100: Latin America Volume(Units) Analysis by Sales Channels, 2017 to 2032

Figure 101: Latin America Value Share (%) and BPS Analysis by Sales Channels, 2022 to 2032

Figure 102: Latin America Y-o-Y Growth (%) Projections by Sales Channels, 2022 to 2032

Figure 103: Latin America Attractiveness by Form Type, 2022 to 2032

Figure 104: Latin America Attractiveness by Animal Type, 2022 to 2032

Figure 105: Latin America Attractiveness by Price Range, 2022 to 2032

Figure 106: Latin America Attractiveness by Ingredient Type, 2022 to 2032

Figure 107: Latin America Attractiveness by Sales Channels, 2022 to 2032

Figure 108: Latin America Attractiveness by Country, 2022 to 2032

Figure 109: Europe Value (US$ Million) by Form Type, 2022 to 2032

Figure 110: Europe Value (US$ Million) by Animal Type, 2022 to 2032

Figure 111: Europe Value (US$ Million) by Price Range, 2022 to 2032

Figure 112: Europe Value (US$ Million) by Ingredient Type, 2022 to 2032

Figure 113: Europe Value (US$ Million) by Sales Channels, 2022 to 2032

Figure 114: Europe Value (US$ Million) by Country, 2022 to 2032

Figure 115: Europe Value (US$ Million) Analysis by Country, 2017 to 2032

Figure 116: Europe Volume(Units) Analysis by Country, 2017 to 2032

Figure 117: Europe Value Share (%) and BPS Analysis by Country, 2022 to 2032

Figure 118: Europe Y-o-Y Growth (%) Projections by Country, 2022 to 2032

Figure 119: Europe Value (US$ Million) Analysis by Form Type, 2017 to 2032

Figure 120: Europe Volume(Units) Analysis by Form Type, 2017 to 2032

Figure 121: Europe Value Share (%) and BPS Analysis by Form Type, 2022 to 2032

Figure 122: Europe Y-o-Y Growth (%) Projections by Form Type, 2022 to 2032

Figure 123: Europe Value (US$ Million) Analysis by Animal Type, 2017 to 2032

Figure 124: Europe Volume(Units) Analysis by Animal Type, 2017 to 2032

Figure 125: Europe Value Share (%) and BPS Analysis by Animal Type, 2022 to 2032

Figure 126: Europe Y-o-Y Growth (%) Projections by Animal Type, 2022 to 2032

Figure 127: Europe Value (US$ Million) Analysis by Price Range, 2017 to 2032

Figure 128: Europe Volume(Units) Analysis by Price Range, 2017 to 2032

Figure 129: Europe Value Share (%) and BPS Analysis by Price Range, 2022 to 2032

Figure 130: Europe Y-o-Y Growth (%) Projections by Price Range, 2022 to 2032

Figure 131: Europe Value (US$ Million) Analysis by Ingredient Type, 2017 to 2032

Figure 132: Europe Volume(Units) Analysis by Ingredient Type, 2017 to 2032

Figure 133: Europe Value Share (%) and BPS Analysis by Ingredient Type, 2022 to 2032

Figure 134: Europe Y-o-Y Growth (%) Projections by Ingredient Type, 2022 to 2032

Figure 135: Europe Value (US$ Million) Analysis by Sales Channels, 2017 to 2032

Figure 136: Europe Volume(Units) Analysis by Sales Channels, 2017 to 2032

Figure 137: Europe Value Share (%) and BPS Analysis by Sales Channels, 2022 to 2032

Figure 138: Europe Y-o-Y Growth (%) Projections by Sales Channels, 2022 to 2032

Figure 139: Europe Attractiveness by Form Type, 2022 to 2032

Figure 140: Europe Attractiveness by Animal Type, 2022 to 2032

Figure 141: Europe Attractiveness by Price Range, 2022 to 2032

Figure 142: Europe Attractiveness by Ingredient Type, 2022 to 2032

Figure 143: Europe Attractiveness by Sales Channels, 2022 to 2032

Figure 144: Europe Attractiveness by Country, 2022 to 2032

Figure 145: Asia Pacific Value (US$ Million) by Form Type, 2022 to 2032

Figure 146: Asia Pacific Value (US$ Million) by Animal Type, 2022 to 2032

Figure 147: Asia Pacific Value (US$ Million) by Price Range, 2022 to 2032

Figure 148: Asia Pacific Value (US$ Million) by Ingredient Type, 2022 to 2032

Figure 149: Asia Pacific Value (US$ Million) by Sales Channels, 2022 to 2032

Figure 150: Asia Pacific Value (US$ Million) by Country, 2022 to 2032

Figure 151: Asia Pacific Value (US$ Million) Analysis by Country, 2017 to 2032

Figure 152: Asia Pacific Volume(Units) Analysis by Country, 2017 to 2032

Figure 153: Asia Pacific Value Share (%) and BPS Analysis by Country, 2022 to 2032

Figure 154: Asia Pacific Y-o-Y Growth (%) Projections by Country, 2022 to 2032

Figure 155: Asia Pacific Value (US$ Million) Analysis by Form Type, 2017 to 2032

Figure 156: Asia Pacific Volume(Units) Analysis by Form Type, 2017 to 2032

Figure 157: Asia Pacific Value Share (%) and BPS Analysis by Form Type, 2022 to 2032

Figure 158: Asia Pacific Y-o-Y Growth (%) Projections by Form Type, 2022 to 2032

Figure 159: Asia Pacific Value (US$ Million) Analysis by Animal Type, 2017 to 2032

Figure 160: Asia Pacific Volume(Units) Analysis by Animal Type, 2017 to 2032

Figure 161: Asia Pacific Value Share (%) and BPS Analysis by Animal Type, 2022 to 2032

Figure 162: Asia Pacific Y-o-Y Growth (%) Projections by Animal Type, 2022 to 2032

Figure 163: Asia Pacific Value (US$ Million) Analysis by Price Range, 2017 to 2032

Figure 164: Asia Pacific Volume(Units) Analysis by Price Range, 2017 to 2032

Figure 165: Asia Pacific Value Share (%) and BPS Analysis by Price Range, 2022 to 2032

Figure 166: Asia Pacific Y-o-Y Growth (%) Projections by Price Range, 2022 to 2032

Figure 167: Asia Pacific Value (US$ Million) Analysis by Ingredient Type, 2017 to 2032

Figure 168: Asia Pacific Volume(Units) Analysis by Ingredient Type, 2017 to 2032

Figure 169: Asia Pacific Value Share (%) and BPS Analysis by Ingredient Type, 2022 to 2032

Figure 170: Asia Pacific Y-o-Y Growth (%) Projections by Ingredient Type, 2022 to 2032

Figure 171: Asia Pacific Value (US$ Million) Analysis by Sales Channels, 2017 to 2032

Figure 172: Asia Pacific Volume(Units) Analysis by Sales Channels, 2017 to 2032

Figure 173: Asia Pacific Value Share (%) and BPS Analysis by Sales Channels, 2022 to 2032

Figure 174: Asia Pacific Y-o-Y Growth (%) Projections by Sales Channels, 2022 to 2032

Figure 175: Asia Pacific Attractiveness by Form Type, 2022 to 2032

Figure 176: Asia Pacific Attractiveness by Animal Type, 2022 to 2032

Figure 177: Asia Pacific Attractiveness by Price Range, 2022 to 2032

Figure 178: Asia Pacific Attractiveness by Ingredient Type, 2022 to 2032

Figure 179: Asia Pacific Attractiveness by Sales Channels, 2022 to 2032

Figure 180: Asia Pacific Attractiveness by Country, 2022 to 2032

Figure 181: South Asia Value (US$ Million) by Form Type, 2022 to 2032

Figure 182: South Asia Value (US$ Million) by Animal Type, 2022 to 2032

Figure 183: South Asia Value (US$ Million) by Price Range, 2022 to 2032

Figure 184: South Asia Value (US$ Million) by Ingredient Type, 2022 to 2032

Figure 185: South Asia Value (US$ Million) by Sales Channels, 2022 to 2032

Figure 186: South Asia Value (US$ Million) by Country, 2022 to 2032

Figure 187: South Asia Value (US$ Million) Analysis by Country, 2017 to 2032

Figure 188: South Asia Volume(Units) Analysis by Country, 2017 to 2032

Figure 189: South Asia Value Share (%) and BPS Analysis by Country, 2022 to 2032

Figure 190: South Asia Y-o-Y Growth (%) Projections by Country, 2022 to 2032

Figure 191: South Asia Value (US$ Million) Analysis by Form Type, 2017 to 2032

Figure 192: South Asia Volume(Units) Analysis by Form Type, 2017 to 2032

Figure 193: South Asia Value Share (%) and BPS Analysis by Form Type, 2022 to 2032

Figure 194: South Asia Y-o-Y Growth (%) Projections by Form Type, 2022 to 2032

Figure 195: South Asia Value (US$ Million) Analysis by Animal Type, 2017 to 2032

Figure 196: South Asia Volume(Units) Analysis by Animal Type, 2017 to 2032

Figure 197: South Asia Value Share (%) and BPS Analysis by Animal Type, 2022 to 2032

Figure 198: South Asia Y-o-Y Growth (%) Projections by Animal Type, 2022 to 2032

Figure 199: South Asia Value (US$ Million) Analysis by Price Range, 2017 to 2032

Figure 200: South Asia Volume(Units) Analysis by Price Range, 2017 to 2032

Figure 201: South Asia Value Share (%) and BPS Analysis by Price Range, 2022 to 2032

Figure 202: South Asia Y-o-Y Growth (%) Projections by Price Range, 2022 to 2032

Figure 203: South Asia Value (US$ Million) Analysis by Ingredient Type, 2017 to 2032

Figure 204: South Asia Volume(Units) Analysis by Ingredient Type, 2017 to 2032

Figure 205: South Asia Value Share (%) and BPS Analysis by Ingredient Type, 2022 to 2032

Figure 206: South Asia Y-o-Y Growth (%) Projections by Ingredient Type, 2022 to 2032

Figure 207: South Asia Value (US$ Million) Analysis by Sales Channels, 2017 to 2032

Figure 208: South Asia Volume(Units) Analysis by Sales Channels, 2017 to 2032

Figure 209: South Asia Value Share (%) and BPS Analysis by Sales Channels, 2022 to 2032

Figure 210: South Asia Y-o-Y Growth (%) Projections by Sales Channels, 2022 to 2032

Figure 211: South Asia Attractiveness by Form Type, 2022 to 2032

Figure 212: South Asia Attractiveness by Animal Type, 2022 to 2032

Figure 213: South Asia Attractiveness by Price Range, 2022 to 2032

Figure 214: South Asia Attractiveness by Ingredient Type, 2022 to 2032

Figure 215: South Asia Attractiveness by Sales Channels, 2022 to 2032

Figure 216: South Asia Attractiveness by Country, 2022 to 2032

Figure 217: Oceania Value (US$ Million) by Form Type, 2022 to 2032

Figure 218: Oceania Value (US$ Million) by Animal Type, 2022 to 2032

Figure 219: Oceania Value (US$ Million) by Price Range, 2022 to 2032

Figure 220: Oceania Value (US$ Million) by Ingredient Type, 2022 to 2032

Figure 221: Oceania Value (US$ Million) by Sales Channels, 2022 to 2032

Figure 222: Oceania Value (US$ Million) by Country, 2022 to 2032

Figure 223: Oceania Value (US$ Million) Analysis by Country, 2017 to 2032

Figure 224: Oceania Volume(Units) Analysis by Country, 2017 to 2032

Figure 225: Oceania Value Share (%) and BPS Analysis by Country, 2022 to 2032

Figure 226: Oceania Y-o-Y Growth (%) Projections by Country, 2022 to 2032

Figure 227: Oceania Value (US$ Million) Analysis by Form Type, 2017 to 2032

Figure 228: Oceania Volume(Units) Analysis by Form Type, 2017 to 2032

Figure 229: Oceania Value Share (%) and BPS Analysis by Form Type, 2022 to 2032

Figure 230: Oceania Y-o-Y Growth (%) Projections by Form Type, 2022 to 2032

Figure 231: Oceania Value (US$ Million) Analysis by Animal Type, 2017 to 2032

Figure 232: Oceania Volume(Units) Analysis by Animal Type, 2017 to 2032

Figure 233: Oceania Value Share (%) and BPS Analysis by Animal Type, 2022 to 2032

Figure 234: Oceania Y-o-Y Growth (%) Projections by Animal Type, 2022 to 2032

Figure 235: Oceania Value (US$ Million) Analysis by Price Range, 2017 to 2032

Figure 236: Oceania Volume(Units) Analysis by Price Range, 2017 to 2032

Figure 237: Oceania Value Share (%) and BPS Analysis by Price Range, 2022 to 2032

Figure 238: Oceania Y-o-Y Growth (%) Projections by Price Range, 2022 to 2032

Figure 239: Oceania Value (US$ Million) Analysis by Ingredient Type, 2017 to 2032

Figure 240: Oceania Volume(Units) Analysis by Ingredient Type, 2017 to 2032

Figure 241: Oceania Value Share (%) and BPS Analysis by Ingredient Type, 2022 to 2032

Figure 242: Oceania Y-o-Y Growth (%) Projections by Ingredient Type, 2022 to 2032

Figure 243: Oceania Value (US$ Million) Analysis by Sales Channels, 2017 to 2032

Figure 244: Oceania Volume(Units) Analysis by Sales Channels, 2017 to 2032

Figure 245: Oceania Value Share (%) and BPS Analysis by Sales Channels, 2022 to 2032

Figure 246: Oceania Y-o-Y Growth (%) Projections by Sales Channels, 2022 to 2032

Figure 247: Oceania Attractiveness by Form Type, 2022 to 2032

Figure 248: Oceania Attractiveness by Animal Type, 2022 to 2032

Figure 249: Oceania Attractiveness by Price Range, 2022 to 2032

Figure 250: Oceania Attractiveness by Ingredient Type, 2022 to 2032

Figure 251: Oceania Attractiveness by Sales Channels, 2022 to 2032

Figure 252: Oceania Attractiveness by Country, 2022 to 2032

Figure 253: Middle East and Africa Value (US$ Million) by Form Type, 2022 to 2032

Figure 254: Middle East and Africa Value (US$ Million) by Animal Type, 2022 to 2032

Figure 255: Middle East and Africa Value (US$ Million) by Price Range, 2022 to 2032

Figure 256: Middle East and Africa Value (US$ Million) by Ingredient Type, 2022 to 2032

Figure 257: Middle East and Africa Value (US$ Million) by Sales Channels, 2022 to 2032

Figure 258: Middle East and Africa Value (US$ Million) by Country, 2022 to 2032

Figure 259: Middle East and Africa Value (US$ Million) Analysis by Country, 2017 to 2032

Figure 260: Middle East and Africa Volume(Units) Analysis by Country, 2017 to 2032

Figure 261: Middle East and Africa Value Share (%) and BPS Analysis by Country, 2022 to 2032

Figure 262: Middle East and Africa Y-o-Y Growth (%) Projections by Country, 2022 to 2032

Figure 263: Middle East and Africa Value (US$ Million) Analysis by Form Type, 2017 to 2032

Figure 264: Middle East and Africa Volume(Units) Analysis by Form Type, 2017 to 2032

Figure 265: Middle East and Africa Value Share (%) and BPS Analysis by Form Type, 2022 to 2032

Figure 266: Middle East and Africa Y-o-Y Growth (%) Projections by Form Type, 2022 to 2032

Figure 267: Middle East and Africa Value (US$ Million) Analysis by Animal Type, 2017 to 2032

Figure 268: Middle East and Africa Volume(Units) Analysis by Animal Type, 2017 to 2032

Figure 269: Middle East and Africa Value Share (%) and BPS Analysis by Animal Type, 2022 to 2032

Figure 270: Middle East and Africa Y-o-Y Growth (%) Projections by Animal Type, 2022 to 2032

Figure 271: Middle East and Africa Value (US$ Million) Analysis by Price Range, 2017 to 2032

Figure 272: Middle East and Africa Volume(Units) Analysis by Price Range, 2017 to 2032

Figure 273: Middle East and Africa Value Share (%) and BPS Analysis by Price Range, 2022 to 2032

Figure 274: Middle East and Africa Y-o-Y Growth (%) Projections by Price Range, 2022 to 2032

Figure 275: Middle East and Africa Value (US$ Million) Analysis by Ingredient Type, 2017 to 2032

Figure 276: Middle East and Africa Volume(Units) Analysis by Ingredient Type, 2017 to 2032

Figure 277: Middle East and Africa Value Share (%) and BPS Analysis by Ingredient Type, 2022 to 2032

Figure 278: Middle East and Africa Y-o-Y Growth (%) Projections by Ingredient Type, 2022 to 2032

Figure 279: Middle East and Africa Value (US$ Million) Analysis by Sales Channels, 2017 to 2032

Figure 280: Middle East and Africa Volume(Units) Analysis by Sales Channels, 2017 to 2032

Figure 281: Middle East and Africa Value Share (%) and BPS Analysis by Sales Channels, 2022 to 2032

Figure 282: Middle East and Africa Y-o-Y Growth (%) Projections by Sales Channels, 2022 to 2032

Figure 283: Middle East and Africa Attractiveness by Form Type, 2022 to 2032

Figure 284: Middle East and Africa Attractiveness by Animal Type, 2022 to 2032

Figure 285: Middle East and Africa Attractiveness by Price Range, 2022 to 2032

Figure 286: Middle East and Africa Attractiveness by Ingredient Type, 2022 to 2032

Figure 287: Middle East and Africa Attractiveness by Sales Channels, 2022 to 2032

Figure 288: Middle East and Africa Attractiveness by Country, 2022 to 2032

Recommendations

Consumer Product

Pet Insurance Market

Published : August 2023

Consumer Product

Pet Lodging Market

Published : July 2023

Packaging

PET Straps Market

Published : October 2021

Explore Consumer Product Insights

View Reports