Pet Monitoring Camera Market Size and Share Forecast Outlook (2022 to 2032)

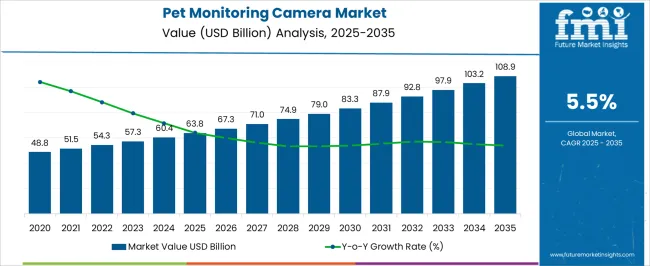
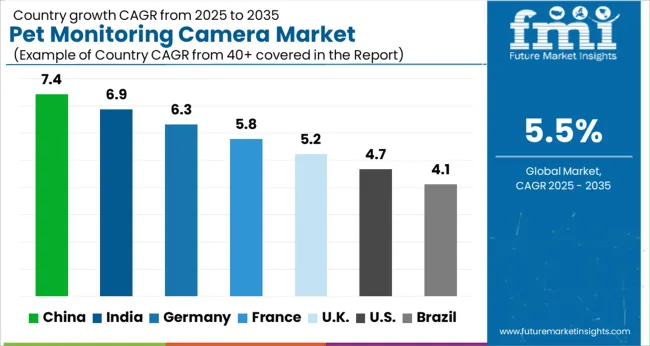
The global demand for pet monitoring cameras is expected to exhibit a CAGR of 5.5% per year to USD 54.3 million in 2022, supported by the following:

  • Due to a greater number of dual-income households, consumers can spend more on their companion animals.
  • Due to rising concern about pet safety as well as adoption trends.
  • Pet ownership among millennials continues to grow along with the adoption of advanced technologies.

In the near future, high prices of pet monitoring cameras may hinder the adoption rate. Many middle-income pet owners hesitate to install these cameras due to their high prices. The majority of the products require continuous cloud connectivity, which is an issue in several developing countries, including Indonesia, India, and Malaysia.

Attribute Details
Pet Monitoring Camera Market Estimated Size (2022) USD 54.3 million
Projected Market Size (2032) USD 93.5 million
Value-based CAGR (2022 to 2032) 5.5%
Top players market share ~1% to 5%

Trends Shaping the Pet Monitoring Camera Market

A multifunctional surveillance camera for pets is one of the latest technological innovations that are evidence of constant technological advancement. The purpose of these multifunctional surveillance cameras for pets is to alert their owners to their pets' requirements. 

Petzilla, for example, has developed a pet treat cam called Petzi Treat Cam that performs multiple functions, such as registering pets quickly and interacting with them from a smartphone or tablet. Consumers can see their pets, talk to them, take pictures of them, and even treat them while they are out in the yard. 

It is believed that the introduction of technologically improved products has contributed to the growth of the pet monitoring camera market in recent years. The introduction of battery-operated and portable pet monitors is one of the main factors that has contributed to its growth.

North America Pet Monitoring Camera Market Holds the Largest Revenue Share

In recent years, the North American market has held the largest share of the pet food industry. In the USA alone, the number of pets has increased in comparison to other countries. In the USA, approximately 136 million people own pets, owing to the fact that a large percentage of the population is very fond of their pets.

This, coupled with increasing disposable incomes and increased spending on pet accessories, encourages more people to buy pet monitoring devices in order to keep an eye on their pets. 

According to the research, one of the main reasons behind the growth of the North American pet monitoring cameras market is the continued rise in the number of millennial pet owners who are keen on utilizing technology to help take care of their pets while they are at work.

Additionally, an increase in adoption has been attributed to the technological advancement of pet monitoring cameras, which is another important factor. There have been many vendors in this region who have developed pet monitoring cameras, which are not only capable of monitoring pets, but also of feeding them when necessary, as well as entertaining them when needed. 

Asia-Pacific Pet Monitoring Camera Market to Record the Fastest CAGR

Due to the increasing adoption and humanization of pets, particularly in Singapore, Thailand, Malaysia, and Indonesia, the Asian Pacific pet monitoring camera market is expected to grow substantially during the forecasted period. As a result of changing consumer behavior, pet wellness and health monitoring products are growing in popularity.

Further, growing disposable incomes and improved lifestyles are projected to provide significant growth prospects in India and China. Rapid urbanization has accelerated pet adoption in these countries.

Countries such as China, Japan, Australia, and India have increased their spending on pets. According to a recent study, in Australia, 76% of dogs and 92% of cats are kept as pets, indicating a high demand for surveillance cameras in this country.

Comparison of Historical (2017 to 2021) vs Forecast Outlook (2022 to 2032)

The global demand for pet monitoring cameras is projected to grow at a CAGR of 5.5% during the forecast period (2022 to 2032). In terms of total market revenue, the pet monitoring camera market is likely to hold a significant share of the pet care sector.

Since 2017, pet surveillance cameras have mostly been used to watch and communicate with lonely at-home pets. However, with advancements in camera technology, the scope of pet monitoring cameras widened. They are being now used for training, treatment, and motion capture purposes.

Pet monitoring cameras enable owners to communicate with pets, monitor their motion, and train them. Growing concerns regarding the safety of pets along with increasing need for continuously monitoring action and movements of pets is expected to boost the sales of pet monitoring cameras during the forecast period.

Key Drivers Supporting Pet Monitoring Camera Market Growth

Surge in Millennial Pet Owners to Boost Pet Monitoring Camera Sales

One of the primary factors driving sales in the pet monitoring camera market is the global proliferation of millennial pet owners who are eager to use technology to look after their pets while they are at work.

Similarly, rise in pet adoption and increasing knowledge of various pet monitoring options will continue to push the demand for pet monitoring cameras during the forecast period.

Rising Penetration of Advanced Technology to Support Growth of the Pet Monitoring Camera Market

Increasing smart technology integration in household electronic equipment is expected to be a trend during the projection period. Thanks to technologies such as Bluetooth and Wi-Fi connectivity, users can control pet surveillance cameras with smartphones and transmit instructions from anywhere within range of communication inside the house.

The advancement of technology in pet monitoring cameras is also a significant element contributing towards increasing their popularity. Many companies have developed pet monitoring cameras that can not only watch pets but also dispense food and entertain them by performing the function of lasers.

Key Restraints Hindering Growth in the Pet Monitoring Camera Market

One of the key factors restraining growth of pet monitoring camera market is the high prices of pet monitoring cameras. Low-income consumers avoid purchasing pricey pet surveillance cameras due to a lack of infrastructure support.
Country-wise Insights in the Pet Monitoring Camera Market

Why is Demand for Pet Monitoring Cameras Rising in the USA?

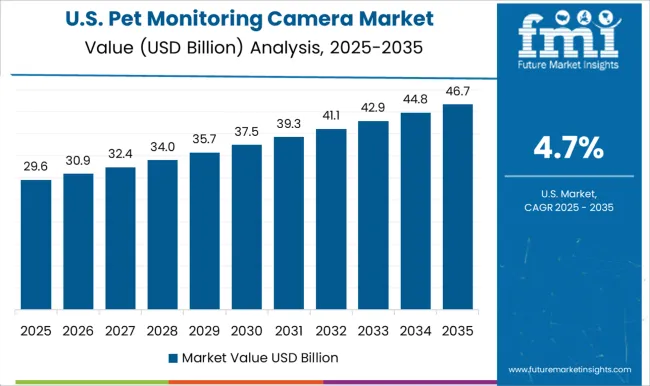
Rapid Adoption of Advanced Technologies Push Demand for Pet Monitoring Cameras in the USA

The market for pet monitoring cameras has grown significantly in recent years, particularly in the USA due rising adoption of smart and advanced technologies, presence of a higher number of pet parents, and growing awareness and concern about pet safety and security in the country.

Furthermore, strong presence of industry heavyweights in the region aids market expansion.

What is the Demand Outlook for China Pet Monitoring Cameras Market?

Availability of Pet Monitoring Cameras at Affordable Rates Propelling Market Growth in China

As per FMI, the pet monitoring cameras market in China is predicted to expand at a robust CAGR of 6.5% between 2022 and 2032. This can be attributed to rising spending on pets and pet related products, rapid economic growth, and availability of advanced monitoring cameras on lower prices.

Similarly, shift in customer behaviour toward purchasing pet wellness and health monitoring solutions is increasing market value in China. Furthermore, increasing consumer lifestyles and rising purchasing power in China is expected to generate considerable market revenue possibilities throughout the projection period.
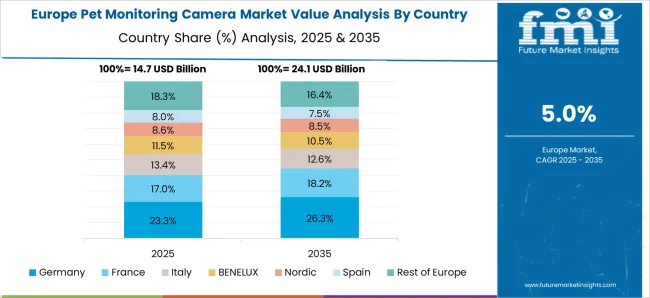
Will the UK Emerge as the Remunerative Pet Monitoring Camera Market in Europe?

Surge in Pet Adoption Rates Spurring Demand for Pet Monitoring Cameras in the UK

Sales of pet monitoring cameras in the UK is expected to grow at a steady CAGR of 3.5% during the forecast period. This can be attributed to the rapid rise in pet population, presence of favourable pet insurance policies, and growing trend of pet humanization

Category-wise Insights in the Pet Monitoring Camera Market

Which is the Most Used Pet Monitoring Camera?

Demand for One Way Video Functionality Pet Monitoring Cameras to Remain High

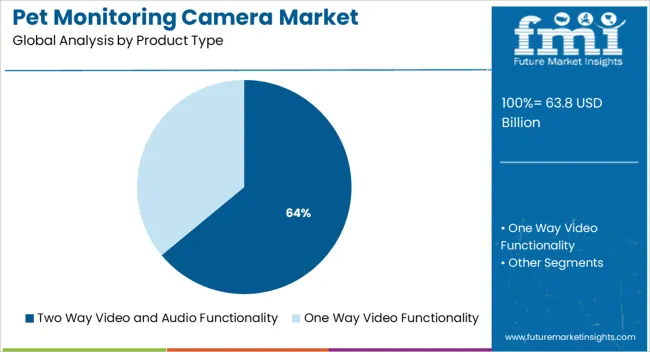
Currently, the one-way video feature category accounts for the biggest revenue share of the global pet monitoring camera market and is expected to continue its dominance over the projected period. This is due to features such as laser dot tracking games, treat vending machines, motion detection capabilities, built-in buzzers, picture capturing, and temperature monitoring.

Why are Sales of Low Priced Pet Monitoring Camera Accelerating?

Demand for Low Priced Pet Monitoring Cameras to Remain High Throughout the Forecast Period

Pet monitoring camera comes in three different price ranges which are low, medium, and premium. Although premium price range offers wide variety and multifunctional features, demand for low price range pet monitoring cameras is expected to grow at a higher CAGR during the forecast period.

Which Sales Channel Contributes Most to the Global Pet Monitoring Camera?

Pet Monitoring Camera Sales to Remain High in Online Retailers Segment

As per FMI, online retailers segment is likely to contribute most to the global pet monitoring camera market through 2032, owing to the increasing desire for online shopping and rising penetration of internet and smartphones.
Competitive Landscape of the Pet Monitoring Camera Market

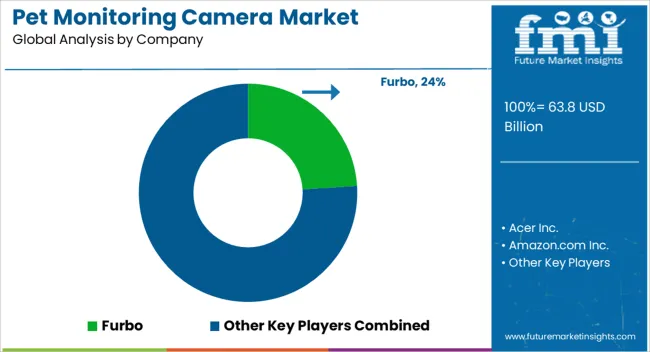
The global pet monitoring camera market is very competitive in nature due to the presence of multiple companies. To improve their revenue, leading pet monitoring camera manufacturers players are focused on releasing new products with advanced characteristics.

For instance,

  • In 2022, Petlibro launched its new camera monitoring automatic pet feeder for caring pet parents.
  • In February 2020, Petcube launched Petcube Bite 2, a smart pet cam with a reward dispenser and an Alexa function for working pet parents. Pet owners may use the technology to access over 50,000 Alexa capabilities hands-free, as well as set auto-play
  • In 2022, Furbo introduced Furbo 360, a smart cam which gives 360-degree view.

Similarly, startups like Tomofun, an international pet technology startup founded in 2014 by Victor Chang are continuously introducing new products to expand their customer base.

Scope and Coverage of the Pet Monitoring Camera Market Report

Attribute Details
Estimated Market Size (2022) USD 54.3 million
Projected Market Size (2032) USD 93.5 million
Anticipated Growth Rate (2022-2032) 5.5%
Forecast Period 2022 to 2032
Historical Data Available for 2017 to 2021
Market Analysis USD Million for Value
Key Regions Covered North America, Latin America, Europe, East Asia, South Asia, Oceania & MEA
Key Countries Covered United States, Canada, Brazil, Mexico, Germany, UK, France, Spain, Italy, Russia, Benelux, South Africa, Northern Africa GCC Countries, China, Japan, South Korea, India, Thailand, Malaysia, Indonesia, Australia & New Zealand.
Key Segments Covered Product Type, Application, Price Range, Sales Channel, End User, and Region
Key Companies Profiled Petcube; Acer Inc.; Amazon.com Inc.; Furbo; Hangzhou Hikvision Digital Technology Co. Ltd.; Lenevo Group Ltd.; PetChatz LLC; Vimtag Technology Co. LTD; Wagz Inc.; Zmodo; Pawbo; Motorola; Cleverdog
Report Coverage Market Forecast, Company Share Analysis, Competition Intelligence, DROT Analysis, Market Dynamics and Challenges, and Strategic Growth Initiatives

Top Segments Studied in the Pet Monitoring Camera Market by Category

By Product Type:

  • One Way Video Functionality
  • Two Way Video and Audio Functionality

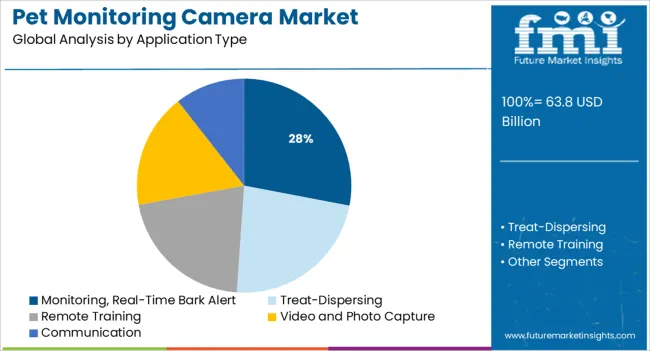
By Application Type

  • Communication
  • Monitoring, Real-Time Bark Alert
  • Treat-Dispersing
  • Remote Training
  • Video and Photo Capture

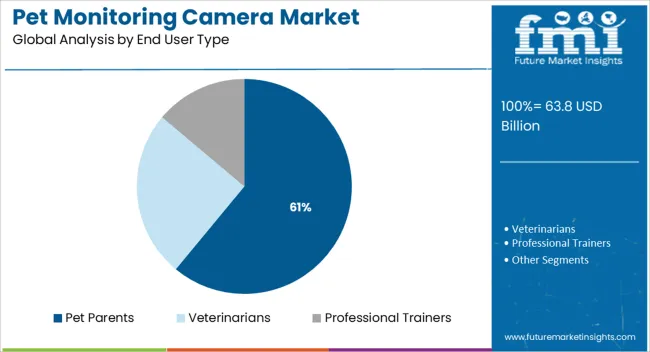
By End User Type:

  • Pet Parents
  • Veterinarians
  • Professional Trainers

By Sales Channel Type:

  • Online Retailers
  • Hypermarket/Supermarkets
  • Speciality Stores
  • Multi-Brand Store
  • Discount Stores

By Price Range:

  • Low
  • Medium
  • Premium

By Region:

  • North America
  • Latin America
  • Europe
  • East Asia
  • South Asia
  • Oceania
  • MEA

Table of Content

  • 1. Executive Summary
  • 2. Market Overview
  • 3. Market Background
  • 4. Global Market Analysis 2017 to 2021 and Forecast, 2022 to 2032
  • 5. Global Market Analysis 2017 to 2021 and Forecast 2022 to 2032, By Product Type
    • 5.1. One Way Video Functionality
    • 5.2. Two Way Video Functionality
  • 6. Global Market Analysis 2017 to 2021 and Forecast 2022 to 2032, By Application
    • 6.1. Communication
    • 6.2. Monitoring
    • 6.3. Real to Time Bark Alert
    • 6.4. Treat to Dispensing
    • 6.5. Remote Training
    • 6.6. Video and Photo Capture
    • 6.7. Others
  • 7. Global Market Analysis 2017 to 2021 and Forecast 2022 to 2032, By Price Range
    • 7.1. Low
    • 7.2. Medium
    • 7.3. Premium
  • 8. Global Market Analysis 2017 to 2021 and Forecast 2022 to 2032, By Sales Channel
    • 8.1. Online Retailers
    • 8.2. Hypermarkets/Supermarkets
    • 8.3. Specialty Stores
    • 8.4. Multi to Brand Stores
    • 8.5. Discount Stores
    • 8.6. Other Sales Channels
  • 9. Global Market Analysis 2017 to 2021 and Forecast 2022 to 2032, By End Use
    • 9.1. Pet Parents
    • 9.2. Veterinarians
    • 9.3. Professional Trainers
  • 10. Global Market Analysis 2017 to 2021 and Forecast 2022 to 2032, By Region
    • 10.1. North America
    • 10.2. Latin America
    • 10.3. Europe
    • 10.4. South Asia
    • 10.5. East Asia
    • 10.6. Oceania
    • 10.7. MEA
  • 11. North America Market Analysis 2017 to 2021 and Forecast 2022 to 2032, By Country
  • 12. Latin America Market Analysis 2017 to 2021 and Forecast 2022 to 2032, By Country
  • 13. Europe Market Analysis 2017 to 2021 and Forecast 2022 to 2032, By Country
  • 14. South Asia Market Analysis 2017 to 2021 and Forecast 2022 to 2032, By Country
  • 15. East Asia Market Analysis 2017 to 2021 and Forecast 2022 to 2032, By Country
  • 16. Oceania Market Analysis 2017 to 2021 and Forecast 2022 to 2032, By Country
  • 17. MEA Market Analysis 2017 to 2021 and Forecast 2022 to 2032, By Country
  • 18. Key Countries Market Analysis
  • 19. Market Structure Analysis
  • 20. Competition Analysis
    • 20.1. Petcube
    • 20.2. Acer Inc.
    • 20.3. Amazon.com Inc.
    • 20.4. Furbo
    • 20.5. Hangzhou Hikvision Digital Technology Co. Ltd.
    • 20.6. Lenovo Group Ltd.
    • 20.7. PetChatz LLC
    • 20.8. Vimtag Technology Co. LTD
    • 20.9. Wagz Inc.
    • 20.10. Zmodo
    • 20.11. Pawbo
    • 20.12. Motorola
  • 21. Assumptions & Acronyms Used
  • 22. Research Methodology

List of Tables

Table 1: Global Market value (US$ Mn) Forecast by Region, 2017-2032

Table 2: Global Market volume (Mn Units) Forecast by Region, 2017-2032

Table 3: Global Market value (US$ Mn) Forecast by Product Type, 2017-2032

Table 4: Global Market volume (Mn Units) Forecast by Product Type, 2017-2032

Table 5: Global Market value (US$ Mn) Forecast by Application, 2017-2032

Table 6: Global Market volume (Mn Units) Forecast by Application, 2017-2032

Table 7: Global Market value (US$ Mn) Forecast by Price Range, 2017-2032

Table 8: Global Market volume (Mn Units) Forecast by Price Range, 2017-2032

Table 9: Global Market value (US$ Mn) Forecast by Sales Channel, 2017-2032

Table 10: Global Market volume (Mn Units) Forecast by Sales Channel, 2017-2032

Table 11: Global Market value (US$ Mn) Forecast by End use, 2017-2032

Table 12: Global Market volume (Mn Units) Forecast by End use, 2017-2032

Table 13: North America Market value (US$ Mn) Forecast by Country, 2017-2032

Table 14: North America Market volume (Mn Units) Forecast by Country, 2017-2032

Table 15: North America Market value (US$ Mn) Forecast by Product Type, 2017-2032

Table 16: North America Market volume (Mn Units) Forecast by Product Type, 2017-2032

Table 17: North America Market value (US$ Mn) Forecast by Application, 2017-2032

Table 18: North America Market volume (Mn Units) Forecast by Application, 2017-2032

Table 19: North America Market value (US$ Mn) Forecast by Price Range, 2017-2032

Table 20: North America Market volume (Mn Units) Forecast by Price Range, 2017-2032

Table 21: North America Market value (US$ Mn) Forecast by Sales Channel, 2017-2032

Table 22: North America Market volume (Mn Units) Forecast by Sales Channel, 2017-2032

Table 23: North America Market value (US$ Mn) Forecast by End use, 2017-2032

Table 24: North America Market volume (Mn Units) Forecast by End use, 2017-2032

Table 25: Latin America Market value (US$ Mn) Forecast by Country, 2017-2032

Table 26: Latin America Market volume (Mn Units) Forecast by Country, 2017-2032

Table 27: Latin America Market value (US$ Mn) Forecast by Product Type, 2017-2032

Table 28: Latin America Market volume (Mn Units) Forecast by Product Type, 2017-2032

Table 29: Latin America Market value (US$ Mn) Forecast by Application, 2017-2032

Table 30: Latin America Market volume (Mn Units) Forecast by Application, 2017-2032

Table 31: Latin America Market value (US$ Mn) Forecast by Price Range, 2017-2032

Table 32: Latin America Market volume (Mn Units) Forecast by Price Range, 2017-2032

Table 33: Latin America Market value (US$ Mn) Forecast by Sales Channel, 2017-2032

Table 34: Latin America Market volume (Mn Units) Forecast by Sales Channel, 2017-2032

Table 35: Latin America Market value (US$ Mn) Forecast by End use, 2017-2032

Table 36: Latin America Market volume (Mn Units) Forecast by End use, 2017-2032

Table 37: Europe Market value (US$ Mn) Forecast by Country, 2017-2032

Table 38: Europe Market volume (Mn Units) Forecast by Country, 2017-2032

Table 39: Europe Market value (US$ Mn) Forecast by Product Type, 2017-2032

Table 40: Europe Market volume (Mn Units) Forecast by Product Type, 2017-2032

Table 41: Europe Market value (US$ Mn) Forecast by Application, 2017-2032

Table 42: Europe Market volume (Mn Units) Forecast by Application, 2017-2032

Table 43: Europe Market value (US$ Mn) Forecast by Price Range, 2017-2032

Table 44: Europe Market volume (Mn Units) Forecast by Price Range, 2017-2032

Table 45: Europe Market value (US$ Mn) Forecast by Sales Channel, 2017-2032

Table 46: Europe Market volume (Mn Units) Forecast by Sales Channel, 2017-2032

Table 47: Europe Market value (US$ Mn) Forecast by End use, 2017-2032

Table 48: Europe Market volume (Mn Units) Forecast by End use, 2017-2032

Table 49: South Asia Market value (US$ Mn) Forecast by Country, 2017-2032

Table 50: South Asia Market volume (Mn Units) Forecast by Country, 2017-2032

Table 51: South Asia Market value (US$ Mn) Forecast by Product Type, 2017-2032

Table 52: South Asia Market volume (Mn Units) Forecast by Product Type, 2017-2032

Table 53: South Asia Market value (US$ Mn) Forecast by Application, 2017-2032

Table 54: South Asia Market Volume (Mn Units) Forecast by Application, 2017-2032

Table 55: South Asia Market Value (US$ Mn) Forecast by Price Range, 2017-2032

Table 56: South Asia Market Volume (Mn Units) Forecast by Price Range, 2017-2032

Table 57: South Asia Market Value (US$ Mn) Forecast by Sales Channel, 2017-2032

Table 58: South Asia Market Volume (Mn Units) Forecast by Sales Channel, 2017-2032

Table 59: South Asia Market Value (US$ Mn) Forecast by End use, 2017-2032

Table 60: South Asia Market Volume (Mn Units) Forecast by End use, 2017-2032

Table 61: East Asia Market Value (US$ Mn) Forecast by Country, 2017-2032

Table 62: East Asia Market Volume (Mn Units) Forecast by Country, 2017-2032

Table 63: East Asia Market Value (US$ Mn) Forecast by Product Type, 2017-2032

Table 64: East Asia Market Volume (Mn Units) Forecast by Product Type, 2017-2032

Table 65: East Asia Market Value (US$ Mn) Forecast by Application, 2017-2032

Table 66: East Asia Market Volume (Mn Units) Forecast by Application, 2017-2032

Table 67: East Asia Market Value (US$ Mn) Forecast by Price Range, 2017-2032

Table 68: East Asia Market Volume (Mn Units) Forecast by Price Range, 2017-2032

Table 69: East Asia Market Value (US$ Mn) Forecast by Sales Channel, 2017-2032

Table 70: East Asia Market Volume (Mn Units) Forecast by Sales Channel, 2017-2032

Table 71: East Asia Market Value (US$ Mn) Forecast by End use, 2017-2032

Table 72: East Asia Market Volume (Mn Units) Forecast by End use, 2017-2032

Table 73: Oceania Market Value (US$ Mn) Forecast by Country, 2017-2032

Table 74: Oceania Market Volume (Mn Units) Forecast by Country, 2017-2032

Table 75: Oceania Market Value (US$ Mn) Forecast by Product Type, 2017-2032

Table 76: Oceania Market Volume (Mn Units) Forecast by Product Type, 2017-2032

Table 77: Oceania Market Value (US$ Mn) Forecast by Application, 2017-2032

Table 78: Oceania Market Volume (Mn Units) Forecast by Application, 2017-2032

Table 79: Oceania Market Value (US$ Mn) Forecast by Price Range, 2017-2032

Table 80: Oceania Market Volume (Mn Units) Forecast by Price Range, 2017-2032

Table 81: Oceania Market Value (US$ Mn) Forecast by Sales Channel, 2017-2032

Table 82: Oceania Market Volume (Mn Units) Forecast by Sales Channel, 2017-2032

Table 83: Oceania Market Value (US$ Mn) Forecast by End use, 2017-2032

Table 84: Oceania Market Volume (Mn Units) Forecast by End use, 2017-2032

Table 85: MEA Market Value (US$ Mn) Forecast by Country, 2017-2032

Table 86: MEA Market Volume (Mn Units) Forecast by Country, 2017-2032

Table 87: MEA Market Value (US$ Mn) Forecast by Product Type, 2017-2032

Table 88: MEA Market Volume (Mn Units) Forecast by Product Type, 2017-2032

Table 89: MEA Market Value (US$ Mn) Forecast by Application, 2017-2032

Table 90: MEA Market Volume (Mn Units) Forecast by Application, 2017-2032

Table 91: MEA Market Value (US$ Mn) Forecast by Price Range, 2017-2032

Table 92: MEA Market Volume (Mn Units) Forecast by Price Range, 2017-2032

Table 93: MEA Market Value (US$ Mn) Forecast by Sales Channel, 2017-2032

Table 94: MEA Market Volume (Mn Units) Forecast by Sales Channel, 2017-2032

Table 95: MEA Market Value (US$ Mn) Forecast by End use, 2017-2032

Table 96: MEA Market Volume (Mn Units) Forecast by End use, 2017-2032

List of Figures

Figure 1: Global Market value (US$ Mn) by Product Type, 2022-2032

Figure 2: Global Market value (US$ Mn) by Application, 2022-2032

Figure 3: Global Market value (US$ Mn) by Price Range, 2022-2032

Figure 4: Global Market value (US$ Mn) by Sales Channel, 2022-2032

Figure 5: Global Market value (US$ Mn) by End use, 2022-2032

Figure 6: Global Market value (US$ Mn) by Region, 2022-2032

Figure 7: Global Market value (US$ Mn) Analysis by Region, 2017-2032

Figure 8: Global Market volume (Mn Units) Analysis by Region, 2017-2032

Figure 9: Global Market value Share (%) and BPS Analysis by Region, 2022-2032

Figure 10: Global Market Y-o-Y Growth (%) Projections by Region, 2022-2032

Figure 11: Global Market value (US$ Mn) Analysis by Product Type, 2017-2032

Figure 12: Global Market volume (Mn Units) Analysis by Product Type, 2017-2032

Figure 13: Global Market value Share (%) and BPS Analysis by Product Type, 2022-2032

Figure 14: Global Market Y-o-Y Growth (%) Projections by Product Type, 2022-2032

Figure 15: Global Market value (US$ Mn) Analysis by Application, 2017-2032

Figure 16: Global Market volume (Mn Units) Analysis by Application, 2017-2032

Figure 17: Global Market value Share (%) and BPS Analysis by Application, 2022-2032

Figure 18: Global Market Y-o-Y Growth (%) Projections by Application, 2022-2032

Figure 19: Global Market value (US$ Mn) Analysis by Price Range, 2017-2032

Figure 20: Global Market volume (Mn Units) Analysis by Price Range, 2017-2032

Figure 21: Global Market value Share (%) and BPS Analysis by Price Range, 2022-2032

Figure 22: Global Market Y-o-Y Growth (%) Projections by Price Range, 2022-2032

Figure 23: Global Market value (US$ Mn) Analysis by Sales Channel, 2017-2032

Figure 24: Global Market volume (Mn Units) Analysis by Sales Channel, 2017-2032

Figure 25: Global Market value Share (%) and BPS Analysis by Sales Channel, 2022-2032

Figure 26: Global Market Y-o-Y Growth (%) Projections by Sales Channel, 2022-2032

Figure 27: Global Market value (US$ Mn) Analysis by End use, 2017-2032

Figure 28: Global Market volume (Mn Units) Analysis by End use, 2017-2032

Figure 29: Global Market value Share (%) and BPS Analysis by End use, 2022-2032

Figure 30: Global Market Y-o-Y Growth (%) Projections by End use, 2022-2032

Figure 31: Global Market attractiveness by Product Type, 2022-2032

Figure 32: Global Market attractiveness by Application, 2022-2032

Figure 33: Global Market attractiveness by Price Range, 2022-2032

Figure 34: Global Market attractiveness by Sales Channel, 2022-2032

Figure 35: Global Market attractiveness by End use, 2022-2032

Figure 36: Global Market attractiveness by Region, 2022-2032

Figure 37: North America Market value (US$ Mn) by Product Type, 2022-2032

Figure 38: North America Market value (US$ Mn) by Application, 2022-2032

Figure 39: North America Market value (US$ Mn) by Price Range, 2022-2032

Figure 40: North America Market value (US$ Mn) by Sales Channel, 2022-2032

Figure 41: North America Market value (US$ Mn) by End use, 2022-2032

Figure 42: North America Market value (US$ Mn) by Country, 2022-2032

Figure 43: North America Market value (US$ Mn) Analysis by Country, 2017-2032

Figure 44: North America Market volume (Mn Units) Analysis by Country, 2017-2032

Figure 45: North America Market value Share (%) and BPS Analysis by Country, 2022-2032

Figure 46: North America Market Y-o-Y Growth (%) Projections by Country, 2022-2032

Figure 47: North America Market value (US$ Mn) Analysis by Product Type, 2017-2032

Figure 48: North America Market volume (Mn Units) Analysis by Product Type, 2017-2032

Figure 49: North America Market value Share (%) and BPS Analysis by Product Type, 2022-2032

Figure 50: North America Market Y-o-Y Growth (%) Projections by Product Type, 2022-2032

Figure 51: North America Market value (US$ Mn) Analysis by Application, 2017-2032

Figure 52: North America Market volume (Mn Units) Analysis by Application, 2017-2032

Figure 53: North America Market value Share (%) and BPS Analysis by Application, 2022-2032

Figure 54: North America Market Y-o-Y Growth (%) Projections by Application, 2022-2032

Figure 55: North America Market value (US$ Mn) Analysis by Price Range, 2017-2032

Figure 56: North America Market volume (Mn Units) Analysis by Price Range, 2017-2032

Figure 57: North America Market value Share (%) and BPS Analysis by Price Range, 2022-2032

Figure 58: North America Market Y-o-Y Growth (%) Projections by Price Range, 2022-2032

Figure 59: North America Market value (US$ Mn) Analysis by Sales Channel, 2017-2032

Figure 60: North America Market volume (Mn Units) Analysis by Sales Channel, 2017-2032

Figure 61: North America Market value Share (%) and BPS Analysis by Sales Channel, 2022-2032

Figure 62: North America Market Y-o-Y Growth (%) Projections by Sales Channel, 2022-2032

Figure 63: North America Market value (US$ Mn) Analysis by End use, 2017-2032

Figure 64: North America Market volume (Mn Units) Analysis by End use, 2017-2032

Figure 65: North America Market value Share (%) and BPS Analysis by End use, 2022-2032

Figure 66: North America Market Y-o-Y Growth (%) Projections by End use, 2022-2032

Figure 67: North America Market attractiveness by Product Type, 2022-2032

Figure 68: North America Market attractiveness by Application, 2022-2032

Figure 69: North America Market attractiveness by Price Range, 2022-2032

Figure 70: North America Market attractiveness by Sales Channel, 2022-2032

Figure 71: North America Market attractiveness by End use, 2022-2032

Figure 72: North America Market attractiveness by Country, 2022-2032

Figure 73: Latin America Market value (US$ Mn) by Product Type, 2022-2032

Figure 74: Latin America Market value (US$ Mn) by Application, 2022-2032

Figure 75: Latin America Market value (US$ Mn) by Price Range, 2022-2032

Figure 76: Latin America Market value (US$ Mn) by Sales Channel, 2022-2032

Figure 77: Latin America Market value (US$ Mn) by End use, 2022-2032

Figure 78: Latin America Market value (US$ Mn) by Country, 2022-2032

Figure 79: Latin America Market value (US$ Mn) Analysis by Country, 2017-2032

Figure 80: Latin America Market volume (Mn Units) Analysis by Country, 2017-2032

Figure 81: Latin America Market value Share (%) and BPS Analysis by Country, 2022-2032

Figure 82: Latin America Market Y-o-Y Growth (%) Projections by Country, 2022-2032

Figure 83: Latin America Market value (US$ Mn) Analysis by Product Type, 2017-2032

Figure 84: Latin America Market volume (Mn Units) Analysis by Product Type, 2017-2032

Figure 85: Latin America Market value Share (%) and BPS Analysis by Product Type, 2022-2032

Figure 86: Latin America Market Y-o-Y Growth (%) Projections by Product Type, 2022-2032

Figure 87: Latin America Market value (US$ Mn) Analysis by Application, 2017-2032

Figure 88: Latin America Market volume (Mn Units) Analysis by Application, 2017-2032

Figure 89: Latin America Market value Share (%) and BPS Analysis by Application, 2022-2032

Figure 90: Latin America Market Y-o-Y Growth (%) Projections by Application, 2022-2032

Figure 91: Latin America Market value (US$ Mn) Analysis by Price Range, 2017-2032

Figure 92: Latin America Market volume (Mn Units) Analysis by Price Range, 2017-2032

Figure 93: Latin America Market value Share (%) and BPS Analysis by Price Range, 2022-2032

Figure 94: Latin America Market Y-o-Y Growth (%) Projections by Price Range, 2022-2032

Figure 95: Latin America Market value (US$ Mn) Analysis by Sales Channel, 2017-2032

Figure 96: Latin America Market volume (Mn Units) Analysis by Sales Channel, 2017-2032

Figure 97: Latin America Market value Share (%) and BPS Analysis by Sales Channel, 2022-2032

Figure 98: Latin America Market Y-o-Y Growth (%) Projections by Sales Channel, 2022-2032

Figure 99: Latin America Market value (US$ Mn) Analysis by End use, 2017-2032

Figure 100: Latin America Market volume (Mn Units) Analysis by End use, 2017-2032

Figure 101: Latin America Market value Share (%) and BPS Analysis by End use, 2022-2032

Figure 102: Latin America Market Y-o-Y Growth (%) Projections by End use, 2022-2032

Figure 103: Latin America Market attractiveness by Product Type, 2022-2032

Figure 104: Latin America Market attractiveness by Application, 2022-2032

Figure 105: Latin America Market attractiveness by Price Range, 2022-2032

Figure 106: Latin America Market attractiveness by Sales Channel, 2022-2032

Figure 107: Latin America Market attractiveness by End use, 2022-2032

Figure 108: Latin America Market attractiveness by Country, 2022-2032

Figure 109: Europe Market value (US$ Mn) by Product Type, 2022-2032

Figure 110: Europe Market value (US$ Mn) by Application, 2022-2032

Figure 111: Europe Market value (US$ Mn) by Price Range, 2022-2032

Figure 112: Europe Market value (US$ Mn) by Sales Channel, 2022-2032

Figure 113: Europe Market value (US$ Mn) by End use, 2022-2032

Figure 114: Europe Market value (US$ Mn) by Country, 2022-2032

Figure 115: Europe Market value (US$ Mn) Analysis by Country, 2017-2032

Figure 116: Europe Market volume (Mn Units) Analysis by Country, 2017-2032

Figure 117: Europe Market value Share (%) and BPS Analysis by Country, 2022-2032

Figure 118: Europe Market Y-o-Y Growth (%) Projections by Country, 2022-2032

Figure 119: Europe Market value (US$ Mn) Analysis by Product Type, 2017-2032

Figure 120: Europe Market volume (Mn Units) Analysis by Product Type, 2017-2032

Figure 121: Europe Market value Share (%) and BPS Analysis by Product Type, 2022-2032

Figure 122: Europe Market Y-o-Y Growth (%) Projections by Product Type, 2022-2032

Figure 123: Europe Market value (US$ Mn) Analysis by Application, 2017-2032

Figure 124: Europe Market volume (Mn Units) Analysis by Application, 2017-2032

Figure 125: Europe Market value Share (%) and BPS Analysis by Application, 2022-2032

Figure 126: Europe Market Y-o-Y Growth (%) Projections by Application, 2022-2032

Figure 127: Europe Market value (US$ Mn) Analysis by Price Range, 2017-2032

Figure 128: Europe Market volume (Mn Units) Analysis by Price Range, 2017-2032

Figure 129: Europe Market value Share (%) and BPS Analysis by Price Range, 2022-2032

Figure 130: Europe Market Y-o-Y Growth (%) Projections by Price Range, 2022-2032

Figure 131: Europe Market value (US$ Mn) Analysis by Sales Channel, 2017-2032

Figure 132: Europe Market volume (Mn Units) Analysis by Sales Channel, 2017-2032

Figure 133: Europe Market value Share (%) and BPS Analysis by Sales Channel, 2022-2032

Figure 134: Europe Market Y-o-Y Growth (%) Projections by Sales Channel, 2022-2032

Figure 135: Europe Market value (US$ Mn) Analysis by End use, 2017-2032

Figure 136: Europe Market volume (Mn Units) Analysis by End use, 2017-2032

Figure 137: Europe Market value Share (%) and BPS Analysis by End use, 2022-2032

Figure 138: Europe Market Y-o-Y Growth (%) Projections by End use, 2022-2032

Figure 139: Europe Market attractiveness by Product Type, 2022-2032

Figure 140: Europe Market attractiveness by Application, 2022-2032

Figure 141: Europe Market attractiveness by Price Range, 2022-2032

Figure 142: Europe Market attractiveness by Sales Channel, 2022-2032

Figure 143: Europe Market attractiveness by End use, 2022-2032

Figure 144: Europe Market attractiveness by Country, 2022-2032

Figure 145: South Asia Market value (US$ Mn) by Product Type, 2022-2032

Figure 146: South Asia Market value (US$ Mn) by Application, 2022-2032

Figure 147: South Asia Market value (US$ Mn) by Price Range, 2022-2032

Figure 148: South Asia Market value (US$ Mn) by Sales Channel, 2022-2032

Figure 149: South Asia Market value (US$ Mn) by End use, 2022-2032

Figure 150: South Asia Market value (US$ Mn) by Country, 2022-2032

Figure 151: South Asia Market value (US$ Mn) Analysis by Country, 2017-2032

Figure 152: South Asia Market volume (Mn Units) Analysis by Country, 2017-2032

Figure 153: South Asia Market value Share (%) and BPS Analysis by Country, 2022-2032

Figure 154: South Asia Market Y-o-Y Growth (%) Projections by Country, 2022-2032

Figure 155: South Asia Market value (US$ Mn) Analysis by Product Type, 2017-2032

Figure 156: South Asia Market volume (Mn Units) Analysis by Product Type, 2017-2032

Figure 157: South Asia Market value Share (%) and BPS Analysis by Product Type, 2022-2032

Figure 158: South Asia Market Y-o-Y Growth (%) Projections by Product Type, 2022-2032

Figure 159: South Asia Market value (US$ Mn) Analysis by Application, 2017-2032

Figure 160: South Asia Market volume (Mn Units) Analysis by Application, 2017-2032

Figure 161: South Asia Market value Share (%) and BPS Analysis by Application, 2022-2032

Figure 162: South Asia Market Y-o-Y Growth (%) Projections by Application, 2022-2032

Figure 163: South Asia Market value (US$ Mn) Analysis by Price Range, 2017-2032

Figure 164: South Asia Market volume (Mn Units) Analysis by Price Range, 2017-2032

Figure 165: South Asia Market value Share (%) and BPS Analysis by Price Range, 2022-2032

Figure 166: South Asia Market Y-o-Y Growth (%) Projections by Price Range, 2022-2032

Figure 167: South Asia Market value (US$ Mn) Analysis by Sales Channel, 2017-2032

Figure 168: South Asia Market volume (Mn Units) Analysis by Sales Channel, 2017-2032

Figure 169: South Asia Market value Share (%) and BPS Analysis by Sales Channel, 2022-2032

Figure 170: South Asia Market Y-o-Y Growth (%) Projections by Sales Channel, 2022-2032

Figure 171: South Asia Market value (US$ Mn) Analysis by End use, 2017-2032

Figure 172: South Asia Market volume (Mn Units) Analysis by End use, 2017-2032

Figure 173: South Asia Market value Share (%) and BPS Analysis by End use, 2022-2032

Figure 174: South Asia Market Y-o-Y Growth (%) Projections by End use, 2022-2032

Figure 175: South Asia Market Attractiveness by Product Type, 2022-2032

Figure 176: South Asia Market Attractiveness by Application, 2022-2032

Figure 177: South Asia Market Attractiveness by Price Range, 2022-2032

Figure 178: South Asia Market Attractiveness by Sales Channel, 2022-2032

Figure 179: South Asia Market Attractiveness by End use, 2022-2032

Figure 180: South Asia Market Attractiveness by Country, 2022-2032

Figure 181: East Asia Market value (US$ Mn) by Product Type, 2022-2032

Figure 182: East Asia Market value (US$ Mn) by Application, 2022-2032

Figure 183: East Asia Market value (US$ Mn) by Price Range, 2022-2032

Figure 184: East Asia Market value (US$ Mn) by Sales Channel, 2022-2032

Figure 185: East Asia Market value (US$ Mn) by End use, 2022-2032

Figure 186: East Asia Market value (US$ Mn) by Country, 2022-2032

Figure 187: East Asia Market value (US$ Mn) Analysis by Country, 2017-2032

Figure 188: East Asia Market volume (Mn Units) Analysis by Country, 2017-2032

Figure 189: East Asia Market value Share (%) and BPS Analysis by Country, 2022-2032

Figure 190: East Asia Market Y-o-Y Growth (%) Projections by Country, 2022-2032

Figure 191: East Asia Market value (US$ Mn) Analysis by Product Type, 2017-2032

Figure 192: East Asia Market volume (Mn Units) Analysis by Product Type, 2017-2032

Figure 193: East Asia Market value Share (%) and BPS Analysis by Product Type, 2022-2032

Figure 194: East Asia Market Y-o-Y Growth (%) Projections by Product Type, 2022-2032

Figure 195: East Asia Market value (US$ Mn) Analysis by Application, 2017-2032

Figure 196: East Asia Market volume (Mn Units) Analysis by Application, 2017-2032

Figure 197: East Asia Market value Share (%) and BPS Analysis by Application, 2022-2032

Figure 198: East Asia Market Y-o-Y Growth (%) Projections by Application, 2022-2032

Figure 199: East Asia Market value (US$ Mn) Analysis by Price Range, 2017-2032

Figure 200: East Asia Market volume (Mn Units) Analysis by Price Range, 2017-2032

Figure 201: East Asia Market value Share (%) and BPS Analysis by Price Range, 2022-2032

Figure 202: East Asia Market Y-o-Y Growth (%) Projections by Price Range, 2022-2032

Figure 203: East Asia Market value (US$ Mn) Analysis by Sales Channel, 2017-2032

Figure 204: East Asia Market volume (Mn Units) Analysis by Sales Channel, 2017-2032

Figure 205: East Asia Market value Share (%) and BPS Analysis by Sales Channel, 2022-2032

Figure 206: East Asia Market Y-o-Y Growth (%) Projections by Sales Channel, 2022-2032

Figure 207: East Asia Market value (US$ Mn) Analysis by End use, 2017-2032

Figure 208: East Asia Market volume (Mn Units) Analysis by End use, 2017-2032

Figure 209: East Asia Market value Share (%) and BPS Analysis by End use, 2022-2032

Figure 210: East Asia Market Y-o-Y Growth (%) Projections by End use, 2022-2032

Figure 211: East Asia Market Attractiveness by Product Type, 2022-2032

Figure 212: East Asia Market Attractiveness by Application, 2022-2032

Figure 213: East Asia Market Attractiveness by Price Range, 2022-2032

Figure 214: East Asia Market Attractiveness by Sales Channel, 2022-2032

Figure 215: East Asia Market Attractiveness by End use, 2022-2032

Figure 216: East Asia Market Attractiveness by Country, 2022-2032

Figure 217: Oceania Market value (US$ Mn) by Product Type, 2022-2032

Figure 218: Oceania Market value (US$ Mn) by Application, 2022-2032

Figure 219: Oceania Market value (US$ Mn) by Price Range, 2022-2032

Figure 220: Oceania Market value (US$ Mn) by Sales Channel, 2022-2032

Figure 221: Oceania Market value (US$ Mn) by End use, 2022-2032

Figure 222: Oceania Market value (US$ Mn) by Country, 2022-2032

Figure 223: Oceania Market value (US$ Mn) Analysis by Country, 2017-2032

Figure 224: Oceania Market volume (Mn Units) Analysis by Country, 2017-2032

Figure 225: Oceania Market value Share (%) and BPS Analysis by Country, 2022-2032

Figure 226: Oceania Market Y-o-Y Growth (%) Projections by Country, 2022-2032

Figure 227: Oceania Market value (US$ Mn) Analysis by Product Type, 2017-2032

Figure 228: Oceania Market volume (Mn Units) Analysis by Product Type, 2017-2032

Figure 229: Oceania Market value Share (%) and BPS Analysis by Product Type, 2022-2032

Figure 230: Oceania Market Y-o-Y Growth (%) Projections by Product Type, 2022-2032

Figure 231: Oceania Market value (US$ Mn) Analysis by Application, 2017-2032

Figure 232: Oceania Market volume (Mn Units) Analysis by Application, 2017-2032

Figure 233: Oceania Market value Share (%) and BPS Analysis by Application, 2022-2032

Figure 234: Oceania Market Y-o-Y Growth (%) Projections by Application, 2022-2032

Figure 235: Oceania Market value (US$ Mn) Analysis by Price Range, 2017-2032

Figure 236: Oceania Market volume (Mn Units) Analysis by Price Range, 2017-2032

Figure 237: Oceania Market value Share (%) and BPS Analysis by Price Range, 2022-2032

Figure 238: Oceania Market Y-o-Y Growth (%) Projections by Price Range, 2022-2032

Figure 239: Oceania Market value (US$ Mn) Analysis by Sales Channel, 2017-2032

Figure 240: Oceania Market volume (Mn Units) Analysis by Sales Channel, 2017-2032

Figure 241: Oceania Market value Share (%) and BPS Analysis by Sales Channel, 2022-2032

Figure 242: Oceania Market Y-o-Y Growth (%) Projections by Sales Channel, 2022-2032

Figure 243: Oceania Market value (US$ Mn) Analysis by End use, 2017-2032

Figure 244: Oceania Market volume (Mn Units) Analysis by End use, 2017-2032

Figure 245: Oceania Market value Share (%) and BPS Analysis by End use, 2022-2032

Figure 246: Oceania Market Y-o-Y Growth (%) Projections by End use, 2022-2032

Figure 247: Oceania Market attractiveness by Product Type, 2022-2032

Figure 248: Oceania Market attractiveness by Application, 2022-2032

Figure 249: Oceania Market attractiveness by Price Range, 2022-2032

Figure 250: Oceania Market attractiveness by Sales Channel, 2022-2032

Figure 251: Oceania Market attractiveness by End use, 2022-2032

Figure 252: Oceania Market attractiveness by Country, 2022-2032

Figure 253: MEA Market value (US$ Mn) by Product Type, 2022-2032

Figure 254: MEA Market value (US$ Mn) by Application, 2022-2032

Figure 255: MEA Market value (US$ Mn) by Price Range, 2022-2032

Figure 256: MEA Market value (US$ Mn) by Sales Channel, 2022-2032

Figure 257: MEA Market value (US$ Mn) by End use, 2022-2032

Figure 258: MEA Market value (US$ Mn) by Country, 2022-2032

Figure 259: MEA Market value (US$ Mn) Analysis by Country, 2017-2032

Figure 260: MEA Market volume (Mn Units) Analysis by Country, 2017-2032

Figure 261: MEA Market value Share (%) and BPS Analysis by Country, 2022-2032

Figure 262: MEA Market Y-o-Y Growth (%) Projections by Country, 2022-2032

Figure 263: MEA Market value (US$ Mn) Analysis by Product Type, 2017-2032

Figure 264: MEA Market volume (Mn Units) Analysis by Product Type, 2017-2032

Figure 265: MEA Market value Share (%) and BPS Analysis by Product Type, 2022-2032

Figure 266: MEA Market Y-o-Y Growth (%) Projections by Product Type, 2022-2032

Figure 267: MEA Market value (US$ Mn) Analysis by Application, 2017-2032

Figure 268: MEA Market volume (Mn Units) Analysis by Application, 2017-2032

Figure 269: MEA Market value Share (%) and BPS Analysis by Application, 2022-2032

Figure 270: MEA Market Y-o-Y Growth (%) Projections by Application, 2022-2032

Figure 271: MEA Market value (US$ Mn) Analysis by Price Range, 2017-2032

Figure 272: MEA Market volume (Mn Units) Analysis by Price Range, 2017-2032

Figure 273: MEA Market value Share (%) and BPS Analysis by Price Range, 2022-2032

Figure 274: MEA Market Y-o-Y Growth (%) Projections by Price Range, 2022-2032

Figure 275: MEA Market value (US$ Mn) Analysis by Sales Channel, 2017-2032

Figure 276: MEA Market volume (Mn Units) Analysis by Sales Channel, 2017-2032

Figure 277: MEA Market value Share (%) and BPS Analysis by Sales Channel, 2022-2032

Figure 278: MEA Market Y-o-Y Growth (%) Projections by Sales Channel, 2022-2032

Figure 279: MEA Market value (US$ Mn) Analysis by End use, 2017-2032

Figure 280: MEA Market volume (Mn Units) Analysis by End use, 2017-2032

Figure 281: MEA Market value Share (%) and BPS Analysis by End use, 2022-2032

Figure 282: MEA Market Y-o-Y Growth (%) Projections by End use, 2022-2032

Figure 283: MEA Market attractiveness by Product Type, 2022-2032

Figure 284: MEA Market attractiveness by Application, 2022-2032

Figure 285: MEA Market attractiveness by Price Range, 2022-2032

Figure 286: MEA Market attractiveness by Sales Channel, 2022-2032

Figure 287: MEA Market attractiveness by End use, 2022-2032

Figure 288: MEA Market attractiveness by Country, 2022-2032

Frequently Asked Questions

How big is the pet monitoring camera market?

The global pet monitoring market reached a valuation of USD 54.3 Million in 2022.

What are the key trends pet monitoring products sales?

Growing popularity of multifunctional cameras and new product launches are some of the key trends boosting the market growth.

Who are the leading players in the global pet monitoring market?

Leading players operating in the global pet monitoring camera market are Petcube, Acer Inc., Amazon.com Inc., Furbo, Hangzhou Hikvision Digital Technology Co. Ltd., Lenevo Group Ltd., PetChatz LLC, others.

What is the demand outlook for North America pet monitoring cameras market?

The overall sales of pet monitoring cameras across the North America are projected to surge at a ~3% CAGR over the forecast period.

Explore Similar Insights

Future Market Insights

Pet Monitoring Camera Market