Reports

- Global Locations -

Headquarters

Future Market Insights, Inc.

Christiana Corporate, 200
Continental Drive, Suite 401,
Newark, Delaware - 19713,
United States

T: +1-845-579-5705

Americas

Future Market Insights, Inc.

616 Corporate Way, Suite 2-9018,
Valley Cottage, NY 10989, United States

T: +1-347-918-3531

MEA

Future Market Insights

1602-6 Jumeirah Bay X2 Tower, Plot No: JLT-PH2-X2A,
Jumeirah Lakes Towers, Dubai,
United Arab Emirates

Europe

Future Market Insights

3rd Floor, 207 Regent Street,
W1B 3HH London
United Kingdom

T: + 44 (0) 20 8123 9659
D: +44 (0) 20 3287 4268

Asia Pacific

Future Market Insights

IndiaLand Global Tech Park, Unit UG-1, Behind Grand HighStreet, Phase 1, Hinjawadi, MH, Pune – 411057, India

Night Vision Surveillance Cameras Market Outlook (2022 to 2032)

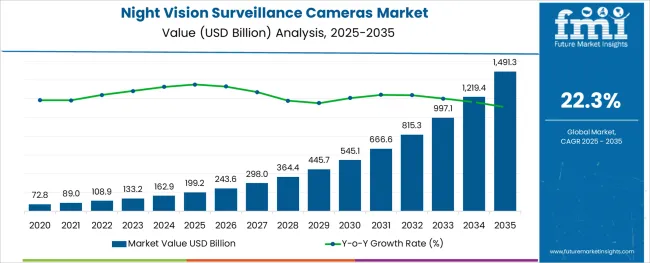
[306 Pages Report] The night vision surveillance cameras market is anticipated to have a steady CAGR of 22.3% during the period 2022 to 2032.

The night vision surveillance cameras market share is predicted to grow from US$ 108.9 Billion in 2022 to US$ 812.2 Billion in 2032. Previously, the demand for night vision surveillance cameras was thriving at a higher CAGR of 24.4% (2016-2021), resulting in a market size of US$ 84.7 Billion in 2021.

Manufacturers' increased Research and Development spending is also propelling the night vision surveillance cameras industry forward.

One of the reasons impeding the night vision surveillance cameras market growth of the night vision security camera market in South Asia and Latin America is the high price connected with the product. Furthermore, data storage issues for night vision security cameras are impeding market expansion and negatively impacting the night vision surveillance cameras market outlook.

The expansion of Covid-19 has had an impact on the supply chain and distribution of night vision security cameras, limiting the market's global growth and leading to a decline in the night vision surveillance cameras market adoption trends.

Attributes Details
Night Vision Surveillance Cameras Market CAGR (2022 to 2032) 22.3%
Night Vision Surveillance Cameras Market Size (2022) US$ 108.9 Billion
Night Vision Surveillance Cameras Market Size (2032) US$ 812.2 Billion

Don't pay for what you don't need

Customize your report by selecting specific countries or regions and save 30%!

How does COVID-19 influence the Night Vision Surveillance Cameras Market?

As per the night vision surveillance cameras market analysis, to combat the spread of COVID-19, governments around the world are building strict surveillance methods. Organizations are also redesigning their business continuity strategies by investing in innovative models to combat the pandemic. Drones equipped with night vision cameras aid authorities in locating people's gatherings while keeping social distance norms.

In public locations, the device can also be used to identify people who are not wearing masks. The usage of thermal imaging night vision devices is currently under focus since these devices can also detect a person's elevated body temperature. The adoption of night vision surveillance cameras has increased due to this factor.

What is Propelling the Night Vision Surveillance Cameras Market?

The night vision surveillance cameras market study indicates that because they ensure personal safety, night vision security cameras are rapidly being used in homes and offices. Through video analytics, night vision security cameras can now zoom in to disclose someone's identity, which can be valuable to crime prevention when used correctly.

The criminal is easily arrested. As a result, buyers are becoming increasingly interested in night-vision security cameras. One of the primary aspects driving the night vision surveillance cameras market is large investments in safe residential and public infrastructure.

The smart security camera with night vision can detect, recognize, analyze, and track people, cars, and objects. This is handy when looking for motion in a quiet environment over the course of a long video recording. Object size and sensitivity are two factors that can be tweaked. As a result of these recent developments in the night vision surveillance cameras market, the use of smart night vision security cameras is on the rise these days.

The surge in terrorist activities, political tensions over border issues, and security and safety concerns have resulted in huge demand for NVDs in the military and defense industries. To meet the growing demand for night patrolling and combat operations, the military and defense sectors are embracing NVDs. Government investments in NVDs by nations like China, India, Germany, Russia, the USA, and others are likely to drive night vision surveillance cameras market size throughout the forecast period.

Sudip Saha
Sudip Saha

Principal Consultant

Talk to Analyst

Find your sweet spots for generating winning opportunities in this market.

What Restrains the Night Vision Surveillance Cameras Market?

Of its multi-tasking capabilities across many military and defense applications, the night vision surveillance cameras market is rapidly expanding. High manufacturing costs, owing to the usage of unique materials such as night vision optics and the utilization of costly third-generation technologies, are expected to impede the night vision surveillance cameras market growth.

Due to the expensive expense of NVDs, such as night-vision goggles, their adoption is limited, and these devices are mostly employed by the military. Due to political issues, certain manufacturers are forced to maintain high costs. This could hinder the night vision surveillance cameras market adoption of NVDs like goggles and scopes.

What are the Trends in the Night Vision Surveillance Cameras Market?

One of the key developments is the incorporation of near-infrared (NIR) imaging technology into night vision systems. It enables soldiers to attack and reveal the location of victims in any weather. Because of its capacity to identify and track motions occurring in the dark, improved NIR devices are becoming more popular. To improve the customer experience, key night vision surveillance cameras market players are focusing on launching advanced products.

In one of the recent developments in the night vision surveillance cameras market, OmniVision Technologies, Inc., for example, unveiled its second-generation near-infrared (NIR) technology - Nyxel 2 - for night-vision and machine-vision applications in March 2020. This technology delivers a wider field of vision, superior quality, and the ability to work in low to no ambient light.

Get the data you need at a Fraction of the cost

Personalize your report by choosing insights you need
and save 40%!

Comparative View of Adjacent Night Vision Surveillance Cameras Market

Night Vision Surveillance Cameras Market:

Attributes Night Vision Surveillance Cameras Market
CAGR (2022 to 2032) 22.3%
Market Value (2026) US$ 175.8 Billion
Growth Factor The night vision surveillance cameras market will be driven by rising military and defense spending.
Opportunity Rising adoption of nvds with near-infrared (nir) imaging technology for security and surveillance applications to aid night vision surveillance cameras market growth
Key Trends The high costs of night vision devices are expected to restrain the demand for night vision surveillance cameras.

Optical Imaging Market:

Attributes Optical Imaging Market
CAGR (2022 to 2032) 14.8%
Market Value (2026) US$ 3.3 Billion
Growth Factor As the elderly population grows, so does the prevalence of eye problems which is expected to lead the market forward.
Opportunity Emerging markets like India, China, Japan, and Brazil are likely to provide considerable growth potential for optical imaging market participants.
Key Trends In 2020, pathological imaging dominated the optical imaging market. The high-resolution imaging capabilities of optical imaging technologies, their non-invasive nature, and the expanding usage of optical imaging in clinical applications all contribute to this segment's considerable share.

Intraoperative Imaging Market:

Attributes Intraoperative Imaging Market
CAGR (2022 to 2032) 5.2%
Market Value (2026) US$ 2.5 Billion
Growth Factor The market for intraoperative imaging is growing due to an increase in the number of surgeries performed, as well as increased funding and public-private partnerships.
Opportunity Intraoperative imaging modalities have advanced in terms of technology and it is expected to change the market outlook significantly.
Key Trends In the intraoperative imaging industry, Asia Pacific is the fastest-growing regional category. The APAC intraoperative imaging market is growing due to rising healthcare expenditure, a burgeoning research base in India, China, and Japan, and government attempts to improve financing.

As per the night vision surveillance cameras market analysis, the need for night vision cameras is likely to rise as the number of smart homes-built increases. These residences are generally equipped with technology that allows them to monitor and detect illegal activity. The global night vision surveillance cameras market is expected to grow tremendously as demand for better security of offices, residences, and assets grow.

As internet buying becomes more prevalent in people's lives, retailers are expected to focus more on aggressive price techniques. This could have a negative impact on the night vision surveillance cameras market's performance over the projection period.

Rural markets provide tremendous night vision surveillance cameras and market growth prospects for night vision security camera companies.

Manufacturers can cut the pricing of night vision surveillance cameras to target these markets, hence extending their client base, as these are price-sensitive markets. As a result, night vision surveillance camera manufacturers should expand their product lines and focus on providing services to these rural markets in the near future.

Due to the increased deployment of network cameras in commercial and residential applications, night vision security camera products are likely to rise at a high rate over the forecast period. Manufacturers' increased Research and Development spending is also propelling the night vision surveillance cameras industry forward.

What is the Segmentation Outlook of the Night Vision Surveillance Cameras Market?

The night vision surveillance cameras market is segmented into product type, type, end-use application, and region.

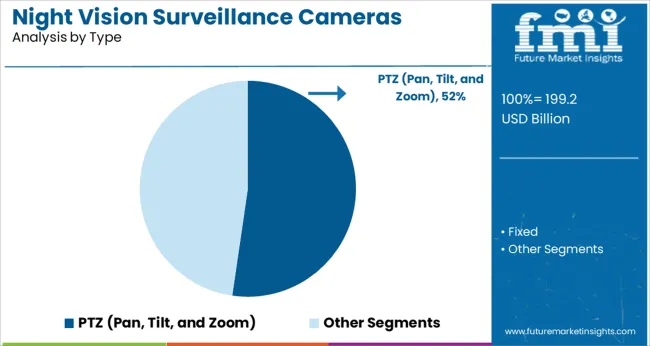
The market for night vision surveillance cameras is divided into fixed and PTZ cameras based on type. During the projection period, PTZ (Pan Tilt and Zoom) is expected to have the highest CAGR of 22%. Infrared or thermal cameras, which produce black and white images, are employed at night and in dimly lit regions.

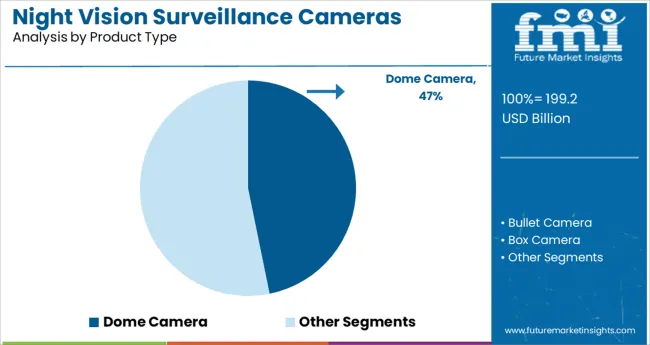
Since it is remotely directed and capable of zoom control, the PTZ (pan-tilt-zoom) camera is widely employed for security applications. Based on the product type, the market is segmented into box cameras, bullet cameras, and dome cameras.

Based on End Use Application, which segment has the Highest Potential in the Night Vision Surveillance Cameras Market?

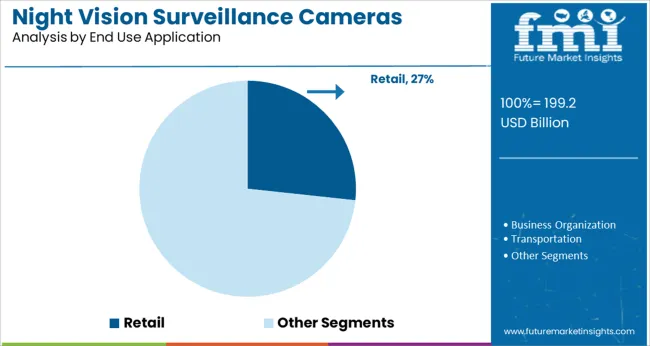
The defense and public sectors have the biggest demand for night vision surveillance cameras. It is anticipated to have a prodigious CAGR of 21.6% during the projected period. Recent terror assaults on essential infrastructure have brought safety concerns to the forefront.

Banking, health, power, water supply, and communication networks have all been targets of sophisticated terror strikes in recent years. Any attack on essential infrastructure might leave a country's economy extremely exposed to future calamity.

As a result, any government's primary goal should be to ensure their protection. As a result, the adoption of night vision surveillance cameras in the public sector is accelerating. Aside from terror attacks, increased concerns about natural catastrophes, criminal activity, accidents, and accidents have also contributed to this segment's high market share.
What is the Regional Analysis of the Night Vision Surveillance Cameras Market?

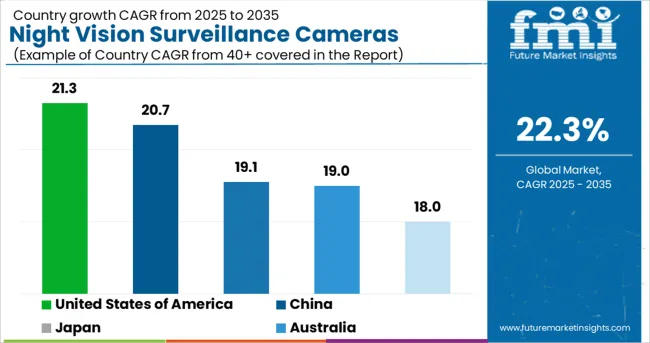
Regions CAGR (2022 to 2032)
United States of America 21.3%
China 20.7%
Japan 19.1%
Australia 19%
South Africa 18%

During the forecast period, North America is expected to dominate the market, with a projected value of US$ 195.4 billion. Rising security breaches and increased reliance are driving up demand for night vision systems in countries like the USA and Canada. The federal governments of the USA and Canada have chosen night vision technology to improve security in public applications.

In the coming years, Asia Pacific is predicted to grow at an exponential rate, with an anticipated market size of US$ 25.3 billion. The rise in demand for location-based gadgets across government sectors, and public transportation such as airports, train stations, and bus stations, is responsible for the expansion. In addition, growing military spending in the region will boost demand for night vision surveillance cameras in a variety of businesses.

During the projection period, Europe is expected to grow at a significant rate. This expansion is due to the existence of a large number of significant manufacturers. During the forecast period, the Middle East and Africa (MEA) and Latin America regions are predicted to grow at a steady rate. This increase is due to the local government's increased investment in modern night vision surveillance devices, such as cameras, goggles, glasses, and others.
How Competition Intensifies the Night Vision Surveillance Cameras Market?

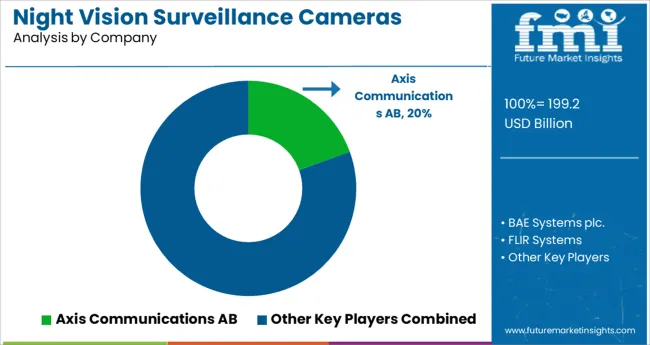
The market for night vision surveillance cameras is fragmented, with a significant number of companies competing. Leading companies are now focusing on providing clients with technologically improved products. Increased demand for night vision surveillance cameras, along with lower long-term costs, is predicted to motivate investors to invest in this technology in the coming years, resulting in increased market rivalry.

Players in the night vision surveillance cameras market are primarily focused on the creation of creative and efficient products. The findings illustrate how rivals are capitalizing on the potential in the night vision surveillance cameras market. The following are some of the most recent advancements in the night vision surveillance cameras market:

  • Intevac Inc. was awarded a USD 28.6 million contract to design and manufacture digital night vision cameras for the US Army's IVAS (Integrated Visual Augmentation System) program in December 2018.
  • At the Security & Policing security event in February 2019, Thermoteknix Systems Ltd. unveiled its sophisticated TiCAM 1000C Biocular Target Locator System. It's a little camera that can be used for observation, surveillance, and security. It's also appropriate for dim lighting and inclement weather.
  • Thales Group announced the co-development of ELFIE night vision devices with armed forces producer MKU Ltd in India in February 2019. ELFIE will provide convenient mobility, as well as night warfare capabilities. The device is appropriate for both left and right eyes and can be installed on a helmet or weapon.

Key Players

  • Axis Communications AB
  • BAE Systems plc.
  • FLIR Systems
  • Hikvision Digital Technology Co Ltd.
  • L3Harris Technologies

Key segments

By Product Type:

  • Dome Camera
  • Bullet Camera
  • Box Camera

By Type:

  • PTZ (Pan, Tilt, and Zoom)
  • Fixed

By End Use Application:

  • Retail
  • Business Organization
  • Transportation
  • Public Sector and Defense
  • Industrial
  • Stadiums
  • Others

By Region:

  • North America
  • Latin America
  • Europe
  • Asia Pacific
  • Middle East & Africa

Frequently Asked Questions

What is the CAGR of the Night Vision Surveillance Cameras Market?

The night vision surveillance cameras market is projected to have a CAGR of 22.3% during the forecast period.

Which is the Leading Region in the Night Vision Surveillance Cameras Market?

The USA is the leading region, with an anticipated CAGR of 21.3% through 2032.

Which Segment Leads in the Night Vision Surveillance Cameras Market by Type?

PTZ leads the market with the projected CAGR of 22% through 2032.

What is the Growth Estimated for the Night Vision Surveillance Cameras Market by 2032?

The night vision surveillance cameras market is predicted to grow to US$ 812.2 billion by 2032.

Which Segment Leads in the Night Vision Surveillance Cameras Market by End Use Application?

Public sector and defense lead the market with the projected CAGR of 21.6% by 2032.

Table of Content

1. Preface | Night Vision Surveillance Cameras Market

    1.1. Research Scope

    1.2. Market Segmentation

    1.3. Research Methodology

2. Executive Summary

    2.1. Global Market Snapshot

    2.2. Global Market Revenue and Volume, 2022 to 2032 (US$ Million and Million Units) and Year-on-Year Growth (%)

3. Global Market Analysis, 2022 to 2032 (US$ Million and Million Units)

    3.1. Key Trends Analysis

    3.2. Market Dynamics

        3.2.1. Drivers

        3.2.2. Restraints

        3.2.3. Opportunities

    3.3. Global Market Analysis, By Type, 2022 to 2032 (US$ Million and Million Units)

        3.3.1. Box Cameras

        3.3.2. Dome Cameras

        3.3.3. Bullet Cameras

    3.4. Global Market Analysis, By Type, 2022 to 2032 (US$ Million and Million Units)

        3.4.1. PTZ (Pan, Tilt and Zoom)

        3.4.2. Fixed

    3.5. Global Market Analysis, By End-use Application, 2022 to 2032 (US$ Million and Million Units)

        3.5.1. Retail

        3.5.2. Business Organizations

        3.5.3. Transportation

        3.5.4. Public Sector and Defense

        3.5.5. Industrial

        3.5.6. Stadiums

        3.5.7. Others (Hospitality, Education, and Residential)

    3.6. Competitive Landscape

        3.6.1. Market Positioning of Key Players, 2021

        3.6.2. Competitive Strategies Adopted by Leading Players

        3.6.3. Recommendations

4. North America Market Analysis, 2022 to 2032 (US$ Million and Million Units)

    4.1. Key Trends Analysis

    4.2. Global Market Analysis, By Shape, 2022 to 2032 (US$ Million and Million Units)

        4.2.1. Box Cameras

        4.2.2. Dome Cameras

        4.2.3. Bullet Cameras

    4.3. North America Market Analysis, By Type, 2022 to 2032 (US$ Million and Million Units)

        4.3.1. PTZ (Pan, Tilt and Zoom)

        4.3.2. Fixed

    4.4. North America Market Analysis, By End-use Application, 2022 to 2032 (US$ Million and Million Units)

        4.4.1. Retail

        4.4.2. Business Organizations

        4.4.3. Transportation

        4.4.4. Public Sector and Defense

        4.4.5. Industrial

        4.4.6. Stadiums

        4.4.7. Others (Hospitality, Education, and Residential)

    4.5. North America Market Analysis, By Country, 2022 to 2032 (US$ Million and Million Units)

        4.5.1. Overview

        4.5.2. United States of America

        4.5.3. Rest of North America

5. Europe Market Analysis, 2022 to 2032 (US$ Million and Million Units)

    5.1. Key Trends Analysis

    5.2. Europe Market Analysis, By Type, 2022 to 2032 (US$ Million and Million Units)

        5.2.1. Box Cameras

        5.2.2. Dome Cameras

        5.2.3. Bullet Cameras

    5.3. Europe Market Analysis, By Type, 2022 to 2032 (US$ Million and Million Units)

        5.3.1. PTZ (Pan, Tilt and Zoom)

        5.3.2. Fixed

    5.4. Europe Market Analysis, By End-use Application, 2022 to 2032 (US$ Million and Million Units)

        5.4.1. Retail

        5.4.2. Business Organizations

        5.4.3. Transportation

        5.4.4. Public Sector and Defense

        5.4.5. Industrial

        5.4.6. Stadiums

        5.4.7. Others (Hospitality, Education, and Residential)

    5.5. Europe Market Analysis, By Region, 2022 to 2032 (US$ Million and Million Units)

        5.5.1. Overview

        5.5.2. EU7 (UK, Italy, Spain, France, Germany, Belgium, and the Netherlands)

        5.5.3. CIS

        5.5.4. Rest of Europe

6. Asia Pacific Market Analysis, 2022 to 2032 (US$ Million and Million Units)

    6.1. Key Trends Analysis

    6.2. Asia Pacific Market Analysis, By Type, 2022 to 2032 (US$ Million and Million Units)

        6.2.1. Box Cameras

        6.2.2. Dome Cameras

        6.2.3. Bullet Cameras

    6.3. Asia Pacific Market Analysis, By Type, 2022 to 2032 (US$ Million and Million Units)

        6.3.1. PTZ (Pan, Tilt and Zoom)

        6.3.2. Fixed

    6.4. Asia Pacific Market Analysis, By End-use Application, 2022 to 2032 (US$ Million and Million Units)

        6.4.1. Retail

        6.4.2. Business Organizations

        6.4.3. Transportation

        6.4.4. Public Sector and Defense

        6.4.5. Industrial

        6.4.6. Stadiums

        6.4.7. Others (Hospitality, Education, and Residential)

    6.5. Asia Pacific Market Analysis, By Region, 2022 to 2032 (US$ Million and Million Units)

        6.5.1. Overview

        6.5.2. Japan

        6.5.3. China

        6.5.4. South Asia (India, Pakistan, Bangladesh, & Sri Lanka)

        6.5.5. Australasia (Australia, NZ & Guinea)

        6.5.6. Rest of APAC

7. Middle East and Africa (MEA) Market Analysis, 2022 to 2032 (US$ Million and Million Units)

    7.1. Key Trends Analysis

    7.2. MEA Market Analysis, By Type, 2022 to 2032 (US$ Million and Million Units)

        7.2.1. Box Cameras

        7.2.2. Dome Cameras

        7.2.3. Bullet Cameras

    7.3. MEA Market Analysis, By Type, 2022 to 2032 (US$ Million and Million Units)

        7.3.1. PTZ (Pan, Tilt and Zoom)

        7.3.2. Fixed

    7.4. MEA Market Analysis, By End-use Application, 2022 to 2032 (US$ Million and Million Units)

        7.4.1. Retail

        7.4.2. Business Organizations

        7.4.3. Transportation

        7.4.4. Public Sector and Defense

        7.4.5. Industrial

        7.4.6. Stadiums

        7.4.7. Others (Hospitality, Education, and Residential)

    7.5. Middle East and Africa (MEA) Market Analysis, By Region, 2022 to 2032 (US$ Million and Million Units)

        7.5.1. Overview

        7.5.2. GCC Countries

        7.5.3. South Africa

        7.5.4. Rest of MEA

8. Latin America Market Analysis, 2022 to 2032 (US$ Million and Million Units)

    8.1. Key Trends Analysis

    8.2. Latin America Market Analysis, By Type, 2022 to 2032 (US$ Million and Million Units)

        8.2.1. Box Cameras

        8.2.2. Dome Cameras

        8.2.3. Bullet Cameras

    8.3. Latin America Market Analysis, By Type, 2022 to 2032 (US$ Million and Million Units)

        8.3.1. PTZ (Pan, Tilt and Zoom)

        8.3.2. Fixed

    8.4. Latin America Market Analysis, By End-use Application, 2022 to 2032 (US$ Million and Million Units)

        8.4.1. Retail

        8.4.2. Business Organizations

        8.4.3. Transportation

        8.4.4. Public Sector and Defense

        8.4.5. Industrial

        8.4.6. Stadiums

        8.4.7. Others (Hospitality, Education, and Residential)

    8.5. Latin America Market Analysis, By Region, 2022 to 2032 (US$ Million and Million Units)

        8.5.1. Overview

        8.5.2. Brazil

        8.5.3. Rest of Latin America

9. Company Profiles

    9.1. Axis Communications AB

        9.1.1. Company Details (HQ, Foundation Year, Employee Strength)

        9.1.2. Market Presence, By Segment and Geography

        9.1.3. Key Developments

        9.1.4. Strategy and Historical Roadmap

        9.1.5. Revenue and Operating Profits

     *Similar details would be provided for all the players mentioned below

    9.2. BAE Systems plc.

    9.3. FLIR Systems

    9.4. Hikvision Digital Technology Co., Ltd.

    9.5. L3Harris Technologies

    9.6. Pelco Corporation

    9.7. Raytheon Company

    9.8. Samsung Group

List of Tables

Table 1: Global Market Value & Volume (US$ Million), By Type, 2022 to 2032

Table 2: Global Market Value & Volume (US$ Million), By Type, 2022 to 2032

Table 3: Global Market Value & Volume (US$ Million), By End-use Application, 2022 to 2032

Table 4: Global Market Value & Volume (US$ Million), By End-use Application, 2022 to 2032

Table 5: Global Market Value & Volume (US$ Million), By Product Type, 2022 to 2032

Table 6: Global Market Value & Volume (US$ Million), By Product Type, 2022 to 2032

Table 7: Global Market, By Region, 2022 to 2032

Table 8: Global Market, By Region, 2022 to 2032

Table 9: North America Market Value & Volume (US$ Million), By Type, 2022 to 2032

Table 10: North America Market Value & Volume (US$ Million), By Type, 2022 to 2032

Table 11: North America Market Value & Volume (US$ Million), By End-use Application, 2022 to 2032

Table 12: North America Market Value & Volume (US$ Million), By End-use Application, 2022 to 2032

Table 13: North America Market Value & Volume (US$ Million), By Product Type, 2022 to 2032

Table 14: North America Market Value & Volume (US$ Million), By Product Type, 2022 to 2032

Table 15: North America Market, By Country, 2022 to 2032

Table 16: North America Market, By Country, 2022 to 2032

List of Charts

Figure 1: Global Market Value (US$ Million) and Year-on-Year Growth, 2022 to 2032

Figure 2: Global Market Absolute $ Historical Gain (2015 to 2032) and Opportunity (2022 to 2032), US$ Million

Figure 3: Global Market Share, by Type, 2021 & 2032

Figure 4: Global Market Y-o-Y Growth Projections, Type - 2022 to 2032

Figure 5: Global Market Attractiveness Index, Type - 2022 to 2032

Figure 6: Global Market Share, By End-use Application, 2021 & 2032

Figure 7: Global Market Y-o-Y Growth Projections, By End-use Application - 2022 to 2032

Figure 8: Global Market Attractiveness Index, By End-use Application - 2022 to 2032

Figure 9: Global Market Share, By Product Type, 2021 & 2032

Figure 10: Global Market Y-o-Y Growth Projections, By Product Type - 2022 to 2032

Figure 11: Global Market Attractiveness Index, By Product Type - 2022 to 2032

Figure 12: Global Market Share, By Region, 2021 & 2032

Figure 13: Global Market Y-o-Y Growth Projections, By Region - 2022 to 2032

Figure 14: Global Market Attractiveness Index, By Region - 2022 to 2032

Figure 15: North America Market Value (US$ Million) and Year-on-Year Growth, 2022 to 2032

Figure 16: North America Market Absolute $ Opportunity Historical (2015 to 2032) and Forecast Period (2022 to 2032), US$ Million

Figure 17: North America Market Share, Type, 2021 & 2032

Figure 18: North America Market Y-o-Y Growth Projections, Type - 2022 to 2032

Figure 19: North America Market Attractiveness Index, Type - 2022 to 2032

Figure 20: North America Market Share, By End-use Application, 2021 & 2032

Figure 21: North America Market Y-o-Y Growth Projections, By End-use Application - 2022 to 2032

Figure 22: North America Market Attractiveness Index, By End-use Application - 2022 to 2032

Figure 23: North America Market Share, By Product Type, 2021 & 2032

Figure 24: North America Market Y-o-Y Growth Projections, By Product Type - 2022 to 2032

Figure 25: North America Market Attractiveness Index, By Product Type - 2022 to 2032

Figure 26: North America Market Share, By Country, 2021 & 2032

Figure 27: North America Market Y-o-Y Growth Projections, By Country - 2022 to 2032

Figure 28: North America Market Attractiveness Index, By Country - 2022 to 2032

Figure 29: Latin America Market Value (US$ Million) and Year-on-Year Growth, 2022 to 2032

Figure 30: Latin America Market Absolute $ Opportunity Historical (2015 to 2032) and Forecast Period (2022 to 2032), US$ Million

Figure 31: Latin America Market Share, Type, 2021 & 2032

Figure 32: Latin America Market Y-o-Y Growth Projections, Type - 2022 to 2032

Figure 33: Latin America Market Attractiveness Index, Type - 2022 to 2032

Figure 34: Latin America Market Share, By End-use Application, 2021 & 2032

Figure 35: Latin America Market Y-o-Y Growth Projections, By End-use Application - 2022 to 2032

Figure 36: Latin America Market Attractiveness Index, By End-use Application - 2022 to 2032

Figure 37: Latin America Market Share, By Product Type, 2021 & 2032

Figure 38: Latin America Market Y-o-Y Growth Projections, By Product Type - 2022 to 2032

Figure 39: Latin America Market Attractiveness Index, By Product Type - 2022 to 2032

Figure 40: Latin America Market Share, By Country, 2021 & 2032

Figure 41: Latin America Market Y-o-Y Growth Projections, By Country - 2022 to 2032

Figure 42: Latin America Market Attractiveness Index, By Country - 2022 to 2032

Figure 43: Europe Market Value (US$ Million) and Year-on-Year Growth, 2022 to 2032

Figure 44: Europe Market Absolute $ Opportunity Historical (2015 to 2032) and Forecast Period (2022 to 2032), US$ Million

Figure 45: Europe Market Share, Type, 2021 & 2032

Figure 46: Europe Market Y-o-Y Growth Projections, Type - 2022 to 2032

Figure 47: Europe Market Attractiveness Index, Type - 2022 to 2032

Figure 48: Europe Market Share, By End-use Application, 2021 & 2032

Figure 49: Europe Market Y-o-Y Growth Projections, By End-use Application - 2022 to 2032

Figure 50: Europe Market Attractiveness Index, By End-use Application - 2022 to 2032

Figure 51: Europe Market Share, By Product Type, 2021 & 2032

Figure 52: Europe Market Y-o-Y Growth Projections, By Product Type - 2022 to 2032

Figure 53: Europe Market Attractiveness Index, By Product Type - 2022 to 2032

Figure 54: Europe Market Share, By Country, 2021 & 2032

Figure 55: Europe Market Y-o-Y Growth Projections, By Country - 2022 to 2032

Figure 56: Europe Market Attractiveness Index, By Country - 2022 to 2032

Figure 57: MEA Market Value (US$ Million) and Year-on-Year Growth, 2022 to 2032

Figure 58: MEA Market Absolute $ Opportunity Historical (2015 to 2032) and Forecast Period (2022 to 2032), US$ Million

Figure 59: MEA Market Share, Type, 2021 & 2032

Figure 60: MEA Market Y-o-Y Growth Projections, Type - 2022 to 2032

Figure 61: MEA Market Attractiveness Index, Type - 2022 to 2032

Figure 62: MEA Market Share, By End-use Application, 2021 & 2032

Figure 63: MEA Market Y-o-Y Growth Projections, By End-use Application - 2022 to 2032

Figure 64: MEA Market Attractiveness Index, By End-use Application - 2022 to 2032

Figure 65: MEA Market Share, By Product Type, 2021 & 2032

Figure 66: MEA Market Y-o-Y Growth Projections, By Product Type - 2022 to 2032

Figure 67: MEA Market Attractiveness Index, By Product Type - 2022 to 2032

Figure 68: MEA Market Share, By Country, 2021 & 2032

Figure 69: MEA Market Y-o-Y Growth Projections, By Country - 2022 to 2032

Figure 70: MEA Market Attractiveness Index, By Country - 2022 to 2032

Figure 71: Asia Pacific Market Value (US$ Million) and Year-on-Year Growth, 2022 to 2032

Figure 72: Asia Pacific Market Absolute $ Opportunity Historical (2015 to 2032) and Forecast Period (2022 to 2032), US$ Million

Figure 73: Asia Pacific Market Share, Type, 2021 & 2032

Figure 74: Asia Pacific Market Y-o-Y Growth Projections, Type - 2022 to 2032

Figure 75: Asia Pacific Market Attractiveness Index, Type - 2022 to 2032

Figure 76: Asia Pacific Market Share, By End-use Application, 2021 & 2032

Figure 77: Asia Pacific Market Y-o-Y Growth Projections, By End-use Application - 2022 to 2032

Figure 78: Asia Pacific Market Attractiveness Index, By End-use Application - 2022 to 2032

Figure 79: Asia Pacific Market Share, By Product Type, 2021 & 2032

Figure 80: Asia Pacific Market Y-o-Y Growth Projections, By Product Type - 2022 to 2032

Figure 81: Asia Pacific Market Attractiveness Index, By Product Type - 2022 to 2032

Figure 82: Asia Pacific Market Share, By Country, 2021 & 2032

Figure 83: Asia Pacific Market Y-o-Y Growth Projections, By Country - 2022 to 2032

Figure 84: Asia Pacific Market Attractiveness Index, By Country - 2022 to 2032

Figure 85: USA Market Value (US$ Million) and Forecast, 2022 to 2032

Figure 86: USA Market Share, Type, 2021

Figure 87: USA Market Share, By End-use Application, 2021

Figure 88: USA Market Share, By Product Type, 2021

Figure 89: Canada Market Value (US$ Million) and Forecast, 2022 to 2032

Figure 90: Canada Market Share, Type, 2021

Figure 91: Canada Market Share, By End-use Application, 2021

Figure 92: Canada Market Share, By Product Type, 2021

Figure 93: Australia Market Value (US$ Million) and Forecast, 2022 to 2032

Figure 94: Australia Market Share, Type, 2021

Figure 95: Australia Market Share, By End-use Application, 2021

Figure 96: Australia Market Share, By Product Type, 2021

Figure 97: Mexico Market Value (US$ Million) and Forecast, 2022 to 2032

Figure 98: Mexico Market Share, Type, 2021

Figure 99: Mexico Market Share, By End-use Application, 2021

Figure 100: Mexico Market Share, By Product Type, 2021

Figure 101: Germany Market Value (US$ Million) and Forecast, 2022 to 2032

Figure 102: Germany Market Share, Type, 2021

Figure 103: Germany Market Share, By End-use Application, 2021

Figure 104: Germany Market Share, By Product Type, 2021

Figure 105: UK Market Value (US$ Million) and Forecast, 2022 to 2032

Figure 106: UK Market Share, Type, 2021

Figure 107: UK Market Share, By End-use Application, 2021

Figure 108: UK Market Share, By Product Type, 2021

Figure 109: France Market Value (US$ Million) and Forecast, 2022 to 2032

Figure 110: France Market Share, Type, 2021

Figure 111: France Market Share, By End-use Application, 2021

Figure 112: France Market Share, By Product Type, 2021

Figure 113: Italy Market Value (US$ Million) and Forecast, 2022 to 2032

Figure 114: Italy Market Share, Type, 2021

Figure 115: Italy Market Share, By End-use Application, 2021

Figure 116: Italy Market Share, By Product Type, 2021

Figure 117: BENELUX Market Value (US$ Million) and Forecast, 2022 to 2032

Figure 118: BENELUX Market Share, Type, 2021

Figure 119: BENELUX Market Share, By End-use Application, 2021

Figure 120: BENELUX Market Share, By Product Type, 2021

Figure 121: Nordic Countries Market Value (US$ Million) and Forecast, 2022 to 2032

Figure 122: Nordic Countries Market Share, Type, 2021

Figure 123: Nordic Countries Market Share, By End-use Application, 2021

Figure 124: Nordic Countries Market Share, By Product Type, 2021

Figure 125: China Market Value (US$ Million) and Forecast, 2022 to 2032

Figure 126: China Market Share, Type, 2021

Figure 127: China Market Share, By End-use Application, 2021

Figure 128: China Market Share, By Product Type, 2021

Figure 129: Japan Market Value (US$ Million) and Forecast, 2022 to 2032

Figure 130: Japan Market Share, Type, 2021

Figure 131: Japan Market Share, By End-use Application, 2021

Figure 132: Japan Market Share, By Product Type, 2021

Figure 133: South Korea Market Value (US$ Million) and Forecast, 2022 to 2032

Figure 134: South Korea Market Share, Type, 2021

Figure 135: South Korea Market Share, By End-use Application, 2021

Figure 136: South Korea Market Share, By Product Type, 2021

Figure 137: GCC Countries Market Value (US$ Million) and Forecast, 2022 to 2032

Figure 138: GCC Countries Market Share, Type, 2021

Figure 139: GCC Countries Market Share, By End-use Application, 2021

Figure 140: GCC Countries Market Share, By Product Type, 2021

Figure 141: South Africa Market Value (US$ Million) and Forecast, 2022 to 2032

Figure 142: South Africa Market Share, Type, 2021

Figure 143: South Africa Market Share, By End-use Application, 2021

Figure 144: South Africa Market Share, By Product Type, 2021

Figure 145: Turkey Market Value (US$ Million) and Forecast, 2022 to 2032

Figure 146: Turkey Market Share, Type, 2021

Figure 147: Turkey Market Share, By End-use Application, 2021

Figure 148: Turkey Market Share, By Product Type, 2021

Table 17: Latin America Market Value & Volume (US$ Million), By Type, 2022 to 2032

Table 18: Latin America Market Value & Volume (US$ Million), By Type, 2022 to 2032

Table 19: Latin America Market Value & Volume (US$ Million), By End-use Application, 2022 to 2032

Table 20: Latin America Market Value & Volume (US$ Million), By End-use Application, 2022 to 2032

Table 21: Latin America Market Value & Volume (US$ Million), By Product Type, 2022 to 2032

Table 22: Latin America Market Value & Volume (US$ Million), By Product Type, 2022 to 2032

Table 23: Latin America Market, By Country, 2022 to 2032

Table 24: Latin America Market, By Country, 2022 to 2032

Table 25: Europe Market Value & Volume (US$ Million), By Type, 2022 to 2032

Table 26: Europe Market Value & Volume (US$ Million), By Type, 2022 to 2032

Table 27: Europe Market Value & Volume (US$ Million), By End-use Application, 2022 to 2032

Table 28: Europe Market Value & Volume (US$ Million), By End-use Application, 2022 to 2032

Table 29: Europe Market Value & Volume (US$ Million), By Product Type, 2022 to 2032

Table 30: Europe Market Value & Volume (US$ Million), By Product Type, 2022 to 2032

Table 31: Europe Market, By Country, 2022 to 2032

Table 32: Europe Market, By Country, 2022 to 2032

Table 33: Asia Pacific Market Value & Volume (US$ Million), By Type, 2022 to 2032

Table 34: Asia Pacific Market Value & Volume (US$ Million), By Type, 2022 to 2032

Table 35: Asia Pacific Market Value & Volume (US$ Million), By End-use Application, 2022 to 2032

Table 36: Asia Pacific Market Value & Volume (US$ Million), By End-use Application, 2022 to 2032

Table 37: Asia Pacific Market Value & Volume (US$ Million), By Product Type, 2022 to 2032

Table 38: Asia Pacific Market Value & Volume (US$ Million), By Product Type, 2022 to 2032

Table 39: Asia Pacific Market, By Country, 2022 to 2032

Table 40: Asia Pacific Market, By Country, 2022 to 2032

Table 41: MEA Market Value & Volume (US$ Million), By Type, 2022 to 2032

Table 42: MEA Market Value & Volume (US$ Million), By Type, 2022 to 2032

Table 43: MEA Market Value & Volume (US$ Million), By End-use Application, 2022 to 2032

Table 44: MEA Market Value & Volume (US$ Million), By End-use Application, 2022 to 2032

Table 45: MEA Market Value & Volume (US$ Million), By Product Type, 2022 to 2032

Table 46: MEA Market Value & Volume (US$ Million), By Product Type, 2022 to 2032

Table 47: MEA Market, By Country, 2022 to 2032

Table 48: MEA Market, By Country, 2022 to 2032

Table 49: Global Market Incremental $ Opportunity, By Type, 2022 to 2032

Table 50: Global Market Incremental $ Opportunity, By End-use Application, 2022 to 2032

Table 51: Global Market Incremental $ Opportunity, By Product Type, 2022 to 2032

Table 52: Global Market Incremental $ Opportunity, By Region, 2022 to 2032

Table 53: North America Market Incremental $ Opportunity, By Type, 2022 to 2032

Table 54: North America Market Incremental $ Opportunity, By End-use Application, 2022 to 2032

Table 55: North America Market Incremental $ Opportunity, By Product Type, 2022 to 2032

Table 56: North America Market Incremental $ Opportunity, By Country, 2022 to 2032

Table 57: Latin America Market Incremental $ Opportunity, By Type, 2022 to 2032

Table 58: Latin America Market Incremental $ Opportunity, By End-use Application, 2022 to 2032

Table 59: Latin America Market Incremental $ Opportunity, By Product Type, 2022 to 2032

Table 60: Latin America Market Incremental $ Opportunity, By Country, 2022 to 2032

Table 61: Europe Market Incremental $ Opportunity, By Type, 2022 to 2032

Table 62: Europe Market Incremental $ Opportunity, By End-use Application, 2022 to 2032

Table 63: Europe Market Incremental $ Opportunity, By Product Type, 2022 to 2032

Table 64: Europe Market Incremental $ Opportunity, By Country, 2022 to 2032

Table 65: Asia Pacific Market Incremental $ Opportunity, By Type, 2022 to 2032

Table 66: Asia Pacific Market Incremental $ Opportunity, By End-use Application, 2022 to 2032

Table 67: Asia Pacific Market Incremental $ Opportunity, By Product Type, 2022 to 2032

Table 68: Asia Pacific Market Incremental $ Opportunity, By Country, 2022 to 2032

Table 69: MEA Market Incremental $ Opportunity, By Type, 2022 to 2032

Table 70: MEA Market Incremental $ Opportunity, By End-use Application, 2022 to 2032

Table 71: MEA Market Incremental $ Opportunity, By Product Type, 2022 to 2032

Table 72: MEA Market Incremental $ Opportunity, By Country, 2022 to 2032

Recommendations

Technology

Mobile Video Surveillance Market

Published : March 2023

Explore Technology Insights

View Reports

Night Vision Surveillance Cameras Market