Reports

- Global Locations -

Headquarters

Future Market Insights, Inc.

Christiana Corporate, 200
Continental Drive, Suite 401,
Newark, Delaware - 19713,
United States

T: +1-845-579-5705

Americas

Future Market Insights, Inc.

616 Corporate Way, Suite 2-9018,
Valley Cottage, NY 10989, United States

T: +1-347-918-3531

MEA

Future Market Insights

1602-6 Jumeirah Bay X2 Tower, Plot No: JLT-PH2-X2A,
Jumeirah Lakes Towers, Dubai,
United Arab Emirates

Europe

Future Market Insights

3rd Floor, 207 Regent Street,
W1B 3HH London
United Kingdom

T: + 44 (0) 20 8123 9659
D: +44 (0) 20 3287 4268

Asia Pacific

Future Market Insights

IndiaLand Global Tech Park, Unit UG-1, Behind Grand HighStreet, Phase 1, Hinjawadi, MH, Pune – 411057, India

Age Related Vision Dysfunction Market Snapshot (2022 to 2033)

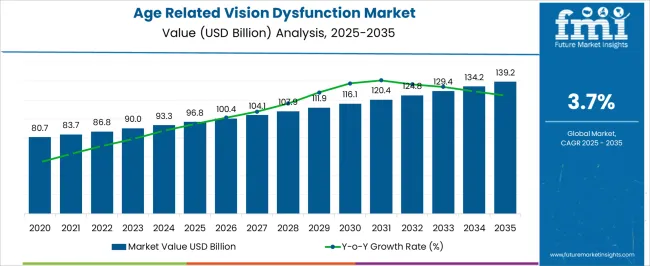
The global age-related vision dysfunction market garnered a market value of US$ 90 Billion in 2023 and is expected to accumulate a market value of US$ 130 Billion by registering a CAGR of 3.7% in the forecast period 2022 to 2033.

The general public's desire to correct and enhance their eyesight as a consequence of increased eye disorders, an aging population, and a variety of other causes is likely to boost the market for age-related vision dysfunction products throughout the forecast period. The adoption of electronic gadgets has been rapidly increasing. People frequently utilize such gadgets for extended periods of time. As a result, more and more individuals are suffering from age-related vision dysfunction, including Asthenopia, and people have begun to use vision care products, particularly vision care eye drops and vision care capsules.

Moreover, poor nutrition and a lack of attention to health are two other issues that are projected to raise demand for the age-related vision dysfunction market. As a result of poor eating, an increasing number of people are experiencing partial or complete eyesight loss. The adoption of electronic gadgets has increased rapidly. Furthermore, vision care products are now more widely available than ever before. Because of such a robust logistics and supply chain network, vision care items such as eyeglasses, cooling glasses, and so on may be transferred quickly within a region or from one nation to another. This is also expected to boost the age-related vision dysfunction market throughout the projected period.

Data Points Key Statistics
Expected Market Value (2023) US$ 90 Billion
Anticipated Forecast Value (2033) US$ 130 Billion
Projected Growth Rate (2023 to 2033) 3.7% CAGR

Don't pay for what you don't need

Customize your report by selecting specific countries or regions and save 30%!

Age Related Vision Dysfunction Demand Analysis (2017 to 2022) Vs Market Outlook (2023 to 2033)

The global demand for age-related vision dysfunction is projected to increase at a CAGR of 3.7% during the forecast period between 2022 and 2033, reaching a total of US$ 130 Billion in 2033, according to a report from Future Market Insights (FMI). From 2017 to 2022, sales witnessed significant growth, registering a CAGR of 2%.

The prevalence of rising eye disorders among individuals from all walks of life is predicted to fuel demand for age-related vision dysfunction, notwithstanding a major increase. The number of patients attending eye care hospitals has increased due to a rise in incidences of cataracts and glaucoma. According to WHO figures, more than 4.5 million individuals are blind as a result of glaucoma. This is concerning, and it has pushed glaucoma patients to adopt preventive measures.

Which are Some Prominent Drivers of Age Related Vision Dysfunction Market?

An Increase in the Proportion of Geriatrics to Encourage Market Expansion

As people age, their eye lenses get stiffer, making it difficult to focus on objects in close proximity. This disorder is known as presbyopia, and it is frequent in persons over the age of 70.

This is usually corrected by using bifocal or progressive lenses. During the projection period, this is likely to improve growth prospects of age-related vision dysfunction.

Advancements in Ophthalmic Diagnostic and Treatment Technologies to boost Adoption

The technical developments that are occurring in this sector are the primary drivers of the age-related vision dysfunction industry. The use of nanotechnology in vision care is predicted to revolutionize the market.

Nanotechnology is now being used to detect eye pressure, cure retinal disorders, and help patients recover from glaucoma faster. Furthermore, robots are used in conjunction with human intelligence to precisely place surgical equipment during eye surgery. Artificial retinas with electrodes are used to replace injured retinas. This might increase future demand for age-related vision dysfunction treatment.

Increasing Awareness-raising Campaigns concerned with Eye Dysfunction

Whether it is the government or large corporations, they are all taking measures to raise awareness about age-related vision dysfunction and its treatment. The World Health Organization (WHO) and the International Agency for the Prevention of Blindness (IAPB) partnered with the Indian government to create VISION 2020. They also put on World Sight Day and other activities.

The goal was to raise awareness about various eye disorders and the procedures to take to keep healthy eyes. This might boost the age-related vision dysfunction market throughout the predicted period. Artificial retinas with electrodes are used to replace injured retinas. This might increase future demand for age-related vision dysfunction treatments.

Sabyasachi Ghosh
Sabyasachi Ghosh

Principal Consultant

Talk to Analyst

Find your sweet spots for generating winning opportunities in this market.

Which are the Trough Areas faced by the Age Related Vision Dysfunction Market?

High Price of Medication to Hamper Market Growth

The high pricing of medications is going to put pressure on corporations and drug makers, particularly on therapies with a high price (i.e. gene therapies) that provide no additional major advantages.
Region-Wise Insights

How will Age-Related Vision Dysfunction Market Demand progress in the Asia Pacific?

Rapid Technological Development for Widening Profit Margins

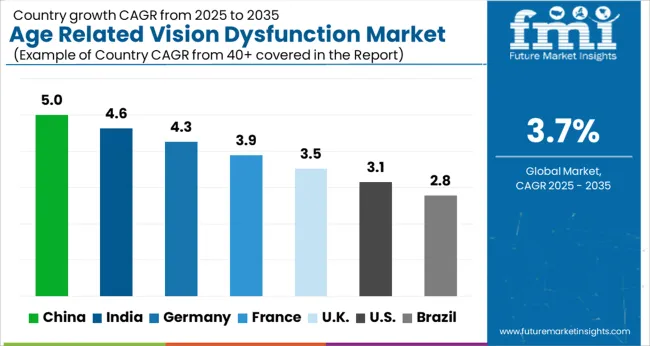
During the projected period, the Chinese age-related vision dysfunction market is predicted to develop at a healthy CAGR of 3.6%. Some of the reasons driving the Chinese age-related vision dysfunction market are the raising geriatric population, rapid technological development, and a growing inclination for superior eye care goods.

According to a Lancet investigation, there were more than 45 million individuals in China with moderate visual impairment, 4.6 million with severe vision impairment, and about 8.7 million with blindness. Furthermore, according to studies, China is one of the world's largest markets for age-related vision dysfunction treatments. Because of technical improvements, China's top businesses are offering novel vision care goods at cheap prices.

On the other hand, according to FMI research, the India age-related vision dysfunction market is estimated to develop at a CAGR of 3% over the forecast period. People have begun to adopt sedentary lifestyles as cities have grown in size. As a result, individuals begin to acquire numerous health concerns, the most evident of which is eye damage in many cases.

Furthermore, the use of technological gadgets is increasing. This opens up a big possibility for the vision care sector in the future. As per Future Market Insights, the Asia Pacific is expected to grow at a CAGR of 3.5% in the assessment period 2023-2033.

How attractive are Growth Prospects for Age-Related Vision Dysfunction in North America?

Growing Senior Population to Accelerate Market Growth

According to FMI research, the North American age-related vision dysfunction market is predicted to develop at a CAGR of 3.6% during the forecast period. The market is likely to be driven by a growing senior population, favorable government policies, and an increase in the incidence of eye illnesses among individuals of all ages.

According to the Centers for Disease Control and Prevention, almost 12 million Americans over the age of 40 have vision impairment. This has been connected to an increase in diabetes incidence in the region. The government and several corporate entities are launching awareness campaigns to keep the issue under control.

Furthermore, the leading businesses are utilizing cutting-edge technology to provide the greatest products possible. Aside from that, the rapid expansion of the E-Commerce industry is predicted to fuel the market in the United States. The United States is predicted to be the top country in North America, with a market share of 33.8% in the area.

Get the data you need at a Fraction of the cost

Personalize your report by choosing insights you need
and save 40%!

Category-Wise Insights

Which Dysfunction Type is the Most Prevalent in the Age-Related Vision Dysfunction Market?

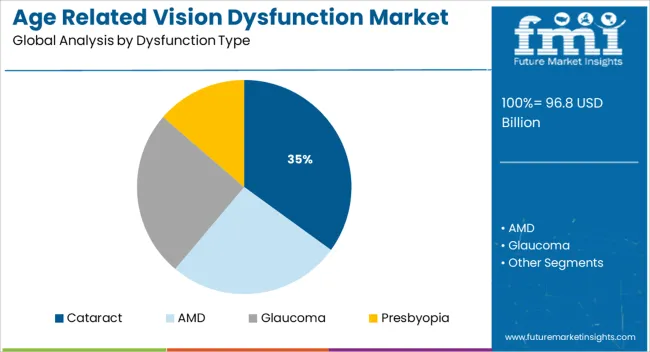
The Glaucoma Segment Trends to enhance Sales Prospects

The increasing incidence of glaucoma, rising attempts to raise awareness about glaucoma, and technical breakthroughs in the area of ophthalmology are the primary drivers driving the growth of the glaucoma treatment sector.

Glaucoma is the world's second-largest cause of blindness. This is usually caused by increased intraocular tension. The basic purpose of treatment is to reduce intraocular tension. This is accomplished by either decreasing aqueous fluid secretion or boosting its outflow. Although glaucoma medications alleviate symptoms, there is no cure for this ailment.

Start-Ups for Age Related Vision Dysfunction Market

Key start-up players in the age-related vision dysfunction are offering new and innovative product lines to consolidate their market presence, these aforementioned start-ups have left no stone unturned. Some specific instances of key age-related vision dysfunction start-ups are as follows:

  • Nanodropper, Inc. was established in 2018. It has created an eye drop bottle converter that reduces the capacity of large eyedrops by more than 60%. This is done with the goal of reducing waste and costs. 
  • Visus Therapeutics is a company that was created in 2019. Their primary goal has always been to provide fixed formulation eye drops for presbyopia sufferers.
Market Competition

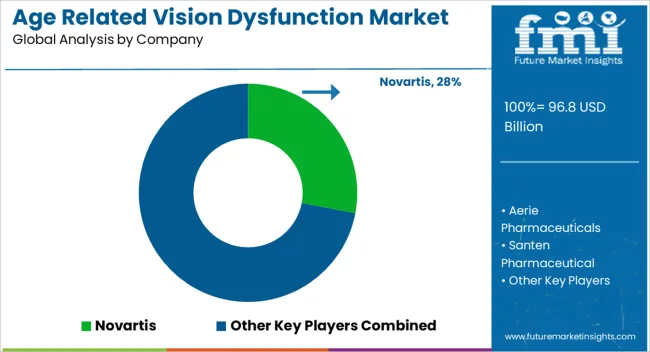
The main market participants are taking all feasible measures to execute the proper activities in order to lessen the rising number of age-related vision dysfunction sufferers globally. They are getting into strategic relationships with start-ups to solve some of the issues that patients confront when undergoing treatment for this purpose. The leading stakeholders are on a quest to create minimally invasive surgical treatments for this purpose. Key players in the age-related vision dysfunction market are:

  • Aerie Pharmaceuticals
  • Santen Pharmaceutical
  • Sun Pharma Advanced Research Company Limited
  • Bausch + Lomb
  • D Western Therapeutics Institute
  • Novartis
  • AbbVie
  • Eyenovia
  • Orasis Pharmaceuticals
  • IVERIC Bio

Recent Developments:

  • In May 2020, AbbVie Inc. finalized the strategic acquisition of Allergan plc. As a result of this purchase, AbbVie Inc. has positioned itself as a market leader in the age-related vision dysfunction business.
  • Santen Pharmaceutical Co. Ltd. launched DIQUAS® Ophthalmic Solution 3% (diquafosol sodium) in Japan in November 2022. The formulation contains a P2Y2 receptor agonist which stimulates tear production and improves eye tissue tear abnormalities.
  • Bausch + Lomb Corporation announced in December 2022 that it has received FDA clearance 510(k) for its Biotrue Hydration Boost Contact Lens Rehydrating Drops. These drops are preservative-free, multi-dose, and suitable for soft and rigid gas-permeable contact lenses

Report Scope

Report Attribute Details
Market Value in 2023 US$ 90 Billion
Market Value in 2033 US$ 130 Billion
Growth Rate CAGR of 3.7% from 2023 to 2033
Base Year for Estimation 2022
Historical Data 2018 to 2022
Forecast Period 2023 to 2033
Quantitative Units Revenue in US Billion and CAGR from 2023 to 2033
Report Coverage Revenue Forecast, Company Ranking, Competitive Landscape, Growth Factors, Trends, and Pricing Analysis
Segments Covered
  • Dysfunction Type
  • Drug
  • Region
Regions Covered
  • North America
  • Latin America
  • Europe
  • Asia Pacific
  • Middle East and Africa (MEA)
Key Countries Profiled
  • The USA
  • Canada
  • Brazil
  • Mexico
  • Germany
  • The UK
  • France
  • Spain
  • Italy
  • China
  • Japan
  • South Korea
  • India
  • Malaysia
  • Singapore
  • Thailand
  • Indonesia
  • Australia
  • New Zealand
  • GCC
  • South Africa
  • Israel
Key Companies Profiled
  • Aerie Pharmaceuticals
  • Santen Pharmaceutical
  • Sun Pharma Advanced Research Company Limited
  • Bausch + Lomb
  • D Western Therapeutics Institute
  • Novartis
  • AbbVie
  • Eyenovia
  • Orasis Pharmaceuticals
  • IVERIC Bio
Customization Available Upon Request

Key Segments Profiled in the Age Related Vision Dysfunction Market Industry Survey

Age Related Vision Dysfunction Market by Dysfunction Type:

  • Cataract
  • AMD
  • Glaucoma
  • Presbyopia

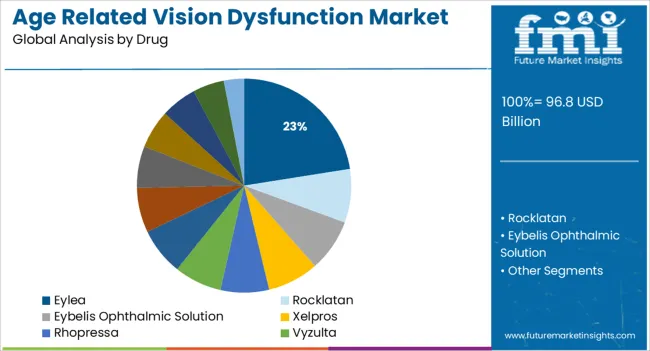
Age-Related Vision Dysfunction Market by Drug:

  • Rocklatan
  • Eybelis Ophthalmic Solution
  • Xelpros
  • Rhopressa
  • Vyzulta
  • Glanatec
  • Simbrinza
  • Tapcom/DE-111
  • Azarga/Azorga
  • Combigan
  • Lucentis
  • Eylea
  • Beovu

Age-Related Vision Dysfunction Market by Region:

  • North America
  • Latin America
  • Europe
  • Asia Pacific
  • Middle East & Africa (MEA)

Frequently Asked Questions

What is the anticipated growth of the age related vision dysfunction market until 2033?

FMI projects the global age-related vision dysfunction market to expand at a 3.7% value CAGR by 2033

What is the estimated market value of Age Related Vision Dysfunction market expected in 2023?

The global Age Related Vision Dysfunction market is estimated at a market value of US$ 90 Billion

What is the estimated market value of Age Related Vision Dysfunction market expected in 2033?

The global Age Related Vision Dysfunction market is expected to garner a market value of US$ 130 Billion

Which region is forecast to be the most lucrative for Age Related Vision Dysfunction market growth?

As per Future Market Insights, Asia Pacific is expected to grow at a CAGR of 3.5% in the assessment period 2023 to 2033.

Which are some prominent automotive axle manufacturers?

Aerie Pharmaceuticals, Santen Pharmaceutical, Sun Pharma Advanced Research Company Limited, Bausch + Lomb, D Western Therapeutics Institute, Novartis, AbbVie, Eyenovia, Orasis Pharmaceuticals and IVERIC Bio are some prominent Age Related Vision Dysfunction manufacturers

What is the expected market share of North America in the Age Related Vision Dysfunction market?

As per Future Market Insights, North America is expected to grow at a CAGR of 3.6% in the assessment period 2023 to 2033.

What is the expected market share of Europe for Age Related Vision Dysfunction?

As per Future Market Insights, Europe is expected to grow at a CAGR of 3.3% in the assessment period 2023 to 2033.

Which dysfunction type is expected to hold the largest market share for Age Related Vision Dysfunction in the forecast period 2023 to 2033?

The glaucoma segment is expected to hold the largest market share for Age Related Vision Dysfunction in the forecast period 2023-2033

Table of Content

1. Executive Summary | Age-Related Vision Dysfunction Market

    1.1. Global Market Outlook

    1.2. Demand-side Trends

    1.3. Supply-side Trends

    1.4. Technology Roadmap Analysis

    1.5. Analysis and Recommendations

2. Market Overview

    2.1. Market Coverage / Taxonomy

    2.2. Market Definition / Scope / Limitations

3. Market Background

    3.1. Market Dynamics

        3.1.1. Drivers

        3.1.2. Restraints

        3.1.3. Opportunity

        3.1.4. Trends

    3.2. Scenario Forecast

        3.2.1. Demand in Optimistic Scenario

        3.2.2. Demand in Likely Scenario

        3.2.3. Demand in Conservative Scenario

    3.3. Opportunity Map Analysis

    3.4. Investment Feasibility Matrix

    3.5. PESTLE and Porter’s Analysis

    3.6. Regulatory Landscape

        3.6.1. By Key Regions

        3.6.2. By Key Countries

    3.7. Regional Parent Market Outlook

4. Global Market Analysis 2018 to 2022 and Forecast, 2023 to 2033

    4.1. Historical Market Size Value (US$ Million) Analysis, 2018 to 2022

    4.2. Current and Future Market Size Value (US$ Million) Projections, 2023 to 2033

        4.2.1. Y-o-Y Growth Trend Analysis

        4.2.2. Absolute $ Opportunity Analysis

5. Global Market Analysis 2018 to 2022 and Forecast 2023 to 2033, By Dysfunction Type

    5.1. Introduction / Key Findings

    5.2. Historical Market Size Value (US$ Million) Analysis By Dysfunction Type, 2018 to 2022

    5.3. Current and Future Market Size Value (US$ Million) Analysis and Forecast By Dysfunction Type, 2023 to 2033

        5.3.1. Cataract

        5.3.2. AMD

        5.3.3. Glaucoma

        5.3.4. Presbyopia

    5.4. Y-o-Y Growth Trend Analysis By Dysfunction Type, 2018 to 2022

    5.5. Absolute $ Opportunity Analysis By Dysfunction Type, 2023 to 2033

6. Global Market Analysis 2018 to 2022 and Forecast 2023 to 2033, By Drug

    6.1. Introduction / Key Findings

    6.2. Historical Market Size Value (US$ Million) Analysis By Drug, 2018 to 2022

    6.3. Current and Future Market Size Value (US$ Million) Analysis and Forecast By Drug, 2023 to 2033

        6.3.1. Rocklatan

        6.3.2. Eybelis Ophthalmic Solution

        6.3.3. Xelpros

        6.3.4. Rhopressa

        6.3.5. Vyzulta

        6.3.6. Glanatec

        6.3.7. Simbrinza

        6.3.8. Tapcom/DE-111

        6.3.9. Azarga/Azorga

        6.3.10. Combigan

        6.3.11. Lucentis

        6.3.12. Eylea

        6.3.13. Beovu

    6.4. Y-o-Y Growth Trend Analysis By Drug, 2018 to 2022

    6.5. Absolute $ Opportunity Analysis By Drug, 2023 to 2033

7. Global Market Analysis 2018 to 2022 and Forecast 2023 to 2033, By Region

    7.1. Introduction

    7.2. Historical Market Size Value (US$ Million) Analysis By Region, 2018 to 2022

    7.3. Current Market Size Value (US$ Million) Analysis and Forecast By Region, 2023 to 2033

        7.3.1. North America

        7.3.2. Latin America

        7.3.3. Europe

        7.3.4. Asia Pacific

        7.3.5. Middle East & Africa (MEA)

    7.4. Market Attractiveness Analysis By Region

8. North America Market Analysis 2018 to 2022 and Forecast 2023 to 2033, By Country

    8.1. Historical Market Size Value (US$ Million) Trend Analysis By Market Taxonomy, 2018 to 2022

    8.2. Market Size Value (US$ Million) Forecast By Market Taxonomy, 2023 to 2033

        8.2.1. By Country

            8.2.1.1. The US

            8.2.1.2. Canada

        8.2.2. By Dysfunction Type

        8.2.3. By Drug

    8.3. Market Attractiveness Analysis

        8.3.1. By Country

        8.3.2. By Dysfunction Type

        8.3.3. By Drug

    8.4. Key Takeaways

9. Latin America Market Analysis 2018 to 2022 and Forecast 2023 to 2033, By Country

    9.1. Historical Market Size Value (US$ Million) Trend Analysis By Market Taxonomy, 2018 to 2022

    9.2. Market Size Value (US$ Million) Forecast By Market Taxonomy, 2023 to 2033

        9.2.1. By Country

            9.2.1.1. Brazil

            9.2.1.2. Mexico

            9.2.1.3. Rest of Latin America

        9.2.2. By Dysfunction Type

        9.2.3. By Drug

    9.3. Market Attractiveness Analysis

        9.3.1. By Country

        9.3.2. By Dysfunction Type

        9.3.3. By Drug

    9.4. Key Takeaways

10. Europe Market Analysis 2018 to 2022 and Forecast 2023 to 2033, By Country

    10.1. Historical Market Size Value (US$ Million) Trend Analysis By Market Taxonomy, 2018 to 2022

    10.2. Market Size Value (US$ Million) Forecast By Market Taxonomy, 2023 to 2033

        10.2.1. By Country

            10.2.1.1. Germany

            10.2.1.2. The UK

            10.2.1.3. France

            10.2.1.4. Spain

            10.2.1.5. Italy

            10.2.1.6. Rest of Europe

        10.2.2. By Dysfunction Type

        10.2.3. By Drug

    10.3. Market Attractiveness Analysis

        10.3.1. By Country

        10.3.2. By Dysfunction Type

        10.3.3. By Drug

    10.4. Key Takeaways

11. Asia Pacific Market Analysis 2018 to 2022 and Forecast 2023 to 2033, By Country

    11.1. Historical Market Size Value (US$ Million) Trend Analysis By Market Taxonomy, 2018 to 2022

    11.2. Market Size Value (US$ Million) Forecast By Market Taxonomy, 2023 to 2033

        11.2.1. By Country

            11.2.1.1. China

            11.2.1.2. Japan

            11.2.1.3. South Korea

            11.2.1.4. Singapore

            11.2.1.5. Thailand

            11.2.1.6. Indonesia

            11.2.1.7. Australia

            11.2.1.8. New Zealand

            11.2.1.9. Rest of Asia Pacific

        11.2.2. By Dysfunction Type

        11.2.3. By Drug

    11.3. Market Attractiveness Analysis

        11.3.1. By Country

        11.3.2. By Dysfunction Type

        11.3.3. By Drug

    11.4. Key Takeaways

12. MEA Market Analysis 2018 to 2022 and Forecast 2023 to 2033, By Country

    12.1. Historical Market Size Value (US$ Million) Trend Analysis By Market Taxonomy, 2018 to 2022

    12.2. Market Size Value (US$ Million) Forecast By Market Taxonomy, 2023 to 2033

        12.2.1. By Country

            12.2.1.1. GCC Countries

            12.2.1.2. South Africa

            12.2.1.3. Israel

            12.2.1.4. Rest of MEA

        12.2.2. By Dysfunction Type

        12.2.3. By Drug

    12.3. Market Attractiveness Analysis

        12.3.1. By Country

        12.3.2. By Dysfunction Type

        12.3.3. By Drug

    12.4. Key Takeaways

13. Key Countries Market Analysis

    13.1. The US

        13.1.1. Pricing Analysis

        13.1.2. Market Share Analysis, 2022

            13.1.2.1. By Dysfunction Type

            13.1.2.2. By Drug

    13.2. Canada

        13.2.1. Pricing Analysis

        13.2.2. Market Share Analysis, 2022

            13.2.2.1. By Dysfunction Type

            13.2.2.2. By Drug

    13.3. Brazil

        13.3.1. Pricing Analysis

        13.3.2. Market Share Analysis, 2022

            13.3.2.1. By Dysfunction Type

            13.3.2.2. By Drug

    13.4. Mexico

        13.4.1. Pricing Analysis

        13.4.2. Market Share Analysis, 2022

            13.4.2.1. By Dysfunction Type

            13.4.2.2. By Drug

    13.5. Germany

        13.5.1. Pricing Analysis

        13.5.2. Market Share Analysis, 2022

            13.5.2.1. By Dysfunction Type

            13.5.2.2. By Drug

    13.6. The UK

        13.6.1. Pricing Analysis

        13.6.2. Market Share Analysis, 2022

            13.6.2.1. By Dysfunction Type

            13.6.2.2. By Drug

    13.7. France

        13.7.1. Pricing Analysis

        13.7.2. Market Share Analysis, 2022

            13.7.2.1. By Dysfunction Type

            13.7.2.2. By Drug

    13.8. Spain

        13.8.1. Pricing Analysis

        13.8.2. Market Share Analysis, 2022

            13.8.2.1. By Dysfunction Type

            13.8.2.2. By Drug

    13.9. Italy

        13.9.1. Pricing Analysis

        13.9.2. Market Share Analysis, 2022

            13.9.2.1. By Dysfunction Type

            13.9.2.2. By Drug

    13.10. China

        13.10.1. Pricing Analysis

        13.10.2. Market Share Analysis, 2022

            13.10.2.1. By Dysfunction Type

            13.10.2.2. By Drug

    13.11. Japan

        13.11.1. Pricing Analysis

        13.11.2. Market Share Analysis, 2022

            13.11.2.1. By Dysfunction Type

            13.11.2.2. By Drug

    13.12. South Korea

        13.12.1. Pricing Analysis

        13.12.2. Market Share Analysis, 2022

            13.12.2.1. By Dysfunction Type

            13.12.2.2. By Drug

    13.13. Singapore

        13.13.1. Pricing Analysis

        13.13.2. Market Share Analysis, 2022

            13.13.2.1. By Dysfunction Type

            13.13.2.2. By Drug

    13.14. Thailand

        13.14.1. Pricing Analysis

        13.14.2. Market Share Analysis, 2022

            13.14.2.1. By Dysfunction Type

            13.14.2.2. By Drug

    13.15. Indonesia

        13.15.1. Pricing Analysis

        13.15.2. Market Share Analysis, 2022

            13.15.2.1. By Dysfunction Type

            13.15.2.2. By Drug

    13.16. Australia

        13.16.1. Pricing Analysis

        13.16.2. Market Share Analysis, 2022

            13.16.2.1. By Dysfunction Type

            13.16.2.2. By Drug

    13.17. New Zealand

        13.17.1. Pricing Analysis

        13.17.2. Market Share Analysis, 2022

            13.17.2.1. By Dysfunction Type

            13.17.2.2. By Drug

    13.18. GCC Countries

        13.18.1. Pricing Analysis

        13.18.2. Market Share Analysis, 2022

            13.18.2.1. By Dysfunction Type

            13.18.2.2. By Drug

    13.19. South Africa

        13.19.1. Pricing Analysis

        13.19.2. Market Share Analysis, 2022

            13.19.2.1. By Dysfunction Type

            13.19.2.2. By Drug

    13.20. Israel

        13.20.1. Pricing Analysis

        13.20.2. Market Share Analysis, 2022

            13.20.2.1. By Dysfunction Type

            13.20.2.2. By Drug

14. Market Structure Analysis

    14.1. Competition Dashboard

    14.2. Competition Benchmarking

    14.3. Market Share Analysis of Top Players

        14.3.1. By Regional

        14.3.2. By Dysfunction Type

        14.3.3. By Drug

15. Competition Analysis

    15.1. Competition Deep Dive

        15.1.1. Aerie Pharmaceuticals

            15.1.1.1. Overview

            15.1.1.2. Product Portfolio

            15.1.1.3. Profitability by Market Segments

            15.1.1.4. Sales Footprint

            15.1.1.5. Strategy Overview

                15.1.1.5.1. Marketing Strategy

        15.1.2. Santen Pharmaceutical

            15.1.2.1. Overview

            15.1.2.2. Product Portfolio

            15.1.2.3. Profitability by Market Segments

            15.1.2.4. Sales Footprint

            15.1.2.5. Strategy Overview

                15.1.2.5.1. Marketing Strategy

        15.1.3. Sun Pharma Advanced Research Company Limited

            15.1.3.1. Overview

            15.1.3.2. Product Portfolio

            15.1.3.3. Profitability by Market Segments

            15.1.3.4. Sales Footprint

            15.1.3.5. Strategy Overview

                15.1.3.5.1. Marketing Strategy

        15.1.4. Bausch + Lomb

            15.1.4.1. Overview

            15.1.4.2. Product Portfolio

            15.1.4.3. Profitability by Market Segments

            15.1.4.4. Sales Footprint

            15.1.4.5. Strategy Overview

                15.1.4.5.1. Marketing Strategy

        15.1.5. D Western Therapeutics Institute

            15.1.5.1. Overview

            15.1.5.2. Product Portfolio

            15.1.5.3. Profitability by Market Segments

            15.1.5.4. Sales Footprint

            15.1.5.5. Strategy Overview

                15.1.5.5.1. Marketing Strategy

        15.1.6. Novartis

            15.1.6.1. Overview

            15.1.6.2. Product Portfolio

            15.1.6.3. Profitability by Market Segments

            15.1.6.4. Sales Footprint

            15.1.6.5. Strategy Overview

                15.1.6.5.1. Marketing Strategy

        15.1.7. AbbVie

            15.1.7.1. Overview

            15.1.7.2. Product Portfolio

            15.1.7.3. Profitability by Market Segments

            15.1.7.4. Sales Footprint

            15.1.7.5. Strategy Overview

                15.1.7.5.1. Marketing Strategy

        15.1.8. Eyenovia

            15.1.8.1. Overview

            15.1.8.2. Product Portfolio

            15.1.8.3. Profitability by Market Segments

            15.1.8.4. Sales Footprint

            15.1.8.5. Strategy Overview

                15.1.8.5.1. Marketing Strategy

        15.1.9. Orasis Pharmaceuticals

            15.1.9.1. Overview

            15.1.9.2. Product Portfolio

            15.1.9.3. Profitability by Market Segments

            15.1.9.4. Sales Footprint

            15.1.9.5. Strategy Overview

                15.1.9.5.1. Marketing Strategy

        15.1.10. IVERIC Bio

            15.1.10.1. Overview

            15.1.10.2. Product Portfolio

            15.1.10.3. Profitability by Market Segments

            15.1.10.4. Sales Footprint

            15.1.10.5. Strategy Overview

                15.1.10.5.1. Marketing Strategy

16. Assumptions & Acronyms Used

17. Research Methodology

List of Tables

Table 1: Global Market Value (US$ Million) Forecast by Region, 2018 to 2033

Table 2: Global Market Value (US$ Million) Forecast by Dysfunction Type, 2018 to 2033

Table 3: Global Market Value (US$ Million) Forecast by Drug, 2018 to 2033

Table 4: North America Market Value (US$ Million) Forecast by Country, 2018 to 2033

Table 5: North America Market Value (US$ Million) Forecast by Dysfunction Type, 2018 to 2033

Table 6: North America Market Value (US$ Million) Forecast by Drug, 2018 to 2033

Table 7: Latin America Market Value (US$ Million) Forecast by Country, 2018 to 2033

Table 8: Latin America Market Value (US$ Million) Forecast by Dysfunction Type, 2018 to 2033

Table 9: Latin America Market Value (US$ Million) Forecast by Drug, 2018 to 2033

Table 10: Europe Market Value (US$ Million) Forecast by Country, 2018 to 2033

Table 11: Europe Market Value (US$ Million) Forecast by Dysfunction Type, 2018 to 2033

Table 12: Europe Market Value (US$ Million) Forecast by Drug, 2018 to 2033

Table 13: Asia Pacific Market Value (US$ Million) Forecast by Country, 2018 to 2033

Table 14: Asia Pacific Market Value (US$ Million) Forecast by Dysfunction Type, 2018 to 2033

Table 15: Asia Pacific Market Value (US$ Million) Forecast by Drug, 2018 to 2033

Table 16: MEA Market Value (US$ Million) Forecast by Country, 2018 to 2033

Table 17: MEA Market Value (US$ Million) Forecast by Dysfunction Type, 2018 to 2033

Table 18: MEA Market Value (US$ Million) Forecast by Drug, 2018 to 2033

List of Charts

Figure 1: Global Market Value (US$ Million) by Dysfunction Type, 2023 to 2033

Figure 2: Global Market Value (US$ Million) by Drug, 2023 to 2033

Figure 3: Global Market Value (US$ Million) by Region, 2023 to 2033

Figure 4: Global Market Value (US$ Million) Analysis by Region, 2018 to 2033

Figure 5: Global Market Value Share (%) and BPS Analysis by Region, 2023 to 2033

Figure 6: Global Market Y-o-Y Growth (%) Projections by Region, 2023 to 2033

Figure 7: Global Market Value (US$ Million) Analysis by Dysfunction Type, 2018 to 2033

Figure 8: Global Market Value Share (%) and BPS Analysis by Dysfunction Type, 2023 to 2033

Figure 9: Global Market Y-o-Y Growth (%) Projections by Dysfunction Type, 2023 to 2033

Figure 10: Global Market Value (US$ Million) Analysis by Drug, 2018 to 2033

Figure 11: Global Market Value Share (%) and BPS Analysis by Drug, 2023 to 2033

Figure 12: Global Market Y-o-Y Growth (%) Projections by Drug, 2023 to 2033

Figure 13: Global Market Attractiveness by Dysfunction Type, 2023 to 2033

Figure 14: Global Market Attractiveness by Drug, 2023 to 2033

Figure 15: Global Market Attractiveness by Region, 2023 to 2033

Figure 16: North America Market Value (US$ Million) by Dysfunction Type, 2023 to 2033

Figure 17: North America Market Value (US$ Million) by Drug, 2023 to 2033

Figure 18: North America Market Value (US$ Million) by Country, 2023 to 2033

Figure 19: North America Market Value (US$ Million) Analysis by Country, 2018 to 2033

Figure 20: North America Market Value Share (%) and BPS Analysis by Country, 2023 to 2033

Figure 21: North America Market Y-o-Y Growth (%) Projections by Country, 2023 to 2033

Figure 22: North America Market Value (US$ Million) Analysis by Dysfunction Type, 2018 to 2033

Figure 23: North America Market Value Share (%) and BPS Analysis by Dysfunction Type, 2023 to 2033

Figure 24: North America Market Y-o-Y Growth (%) Projections by Dysfunction Type, 2023 to 2033

Figure 25: North America Market Value (US$ Million) Analysis by Drug, 2018 to 2033

Figure 26: North America Market Value Share (%) and BPS Analysis by Drug, 2023 to 2033

Figure 27: North America Market Y-o-Y Growth (%) Projections by Drug, 2023 to 2033

Figure 28: North America Market Attractiveness by Dysfunction Type, 2023 to 2033

Figure 29: North America Market Attractiveness by Drug, 2023 to 2033

Figure 30: North America Market Attractiveness by Country, 2023 to 2033

Figure 31: Latin America Market Value (US$ Million) by Dysfunction Type, 2023 to 2033

Figure 32: Latin America Market Value (US$ Million) by Drug, 2023 to 2033

Figure 33: Latin America Market Value (US$ Million) by Country, 2023 to 2033

Figure 34: Latin America Market Value (US$ Million) Analysis by Country, 2018 to 2033

Figure 35: Latin America Market Value Share (%) and BPS Analysis by Country, 2023 to 2033

Figure 36: Latin America Market Y-o-Y Growth (%) Projections by Country, 2023 to 2033

Figure 37: Latin America Market Value (US$ Million) Analysis by Dysfunction Type, 2018 to 2033

Figure 38: Latin America Market Value Share (%) and BPS Analysis by Dysfunction Type, 2023 to 2033

Figure 39: Latin America Market Y-o-Y Growth (%) Projections by Dysfunction Type, 2023 to 2033

Figure 40: Latin America Market Value (US$ Million) Analysis by Drug, 2018 to 2033

Figure 41: Latin America Market Value Share (%) and BPS Analysis by Drug, 2023 to 2033

Figure 42: Latin America Market Y-o-Y Growth (%) Projections by Drug, 2023 to 2033

Figure 43: Latin America Market Attractiveness by Dysfunction Type, 2023 to 2033

Figure 44: Latin America Market Attractiveness by Drug, 2023 to 2033

Figure 45: Latin America Market Attractiveness by Country, 2023 to 2033

Figure 46: Europe Market Value (US$ Million) by Dysfunction Type, 2023 to 2033

Figure 47: Europe Market Value (US$ Million) by Drug, 2023 to 2033

Figure 48: Europe Market Value (US$ Million) by Country, 2023 to 2033

Figure 49: Europe Market Value (US$ Million) Analysis by Country, 2018 to 2033

Figure 50: Europe Market Value Share (%) and BPS Analysis by Country, 2023 to 2033

Figure 51: Europe Market Y-o-Y Growth (%) Projections by Country, 2023 to 2033

Figure 52: Europe Market Value (US$ Million) Analysis by Dysfunction Type, 2018 to 2033

Figure 53: Europe Market Value Share (%) and BPS Analysis by Dysfunction Type, 2023 to 2033

Figure 54: Europe Market Y-o-Y Growth (%) Projections by Dysfunction Type, 2023 to 2033

Figure 55: Europe Market Value (US$ Million) Analysis by Drug, 2018 to 2033

Figure 56: Europe Market Value Share (%) and BPS Analysis by Drug, 2023 to 2033

Figure 57: Europe Market Y-o-Y Growth (%) Projections by Drug, 2023 to 2033

Figure 58: Europe Market Attractiveness by Dysfunction Type, 2023 to 2033

Figure 59: Europe Market Attractiveness by Drug, 2023 to 2033

Figure 60: Europe Market Attractiveness by Country, 2023 to 2033

Figure 61: Asia Pacific Market Value (US$ Million) by Dysfunction Type, 2023 to 2033

Figure 62: Asia Pacific Market Value (US$ Million) by Drug, 2023 to 2033

Figure 63: Asia Pacific Market Value (US$ Million) by Country, 2023 to 2033

Figure 64: Asia Pacific Market Value (US$ Million) Analysis by Country, 2018 to 2033

Figure 65: Asia Pacific Market Value Share (%) and BPS Analysis by Country, 2023 to 2033

Figure 66: Asia Pacific Market Y-o-Y Growth (%) Projections by Country, 2023 to 2033

Figure 67: Asia Pacific Market Value (US$ Million) Analysis by Dysfunction Type, 2018 to 2033

Figure 68: Asia Pacific Market Value Share (%) and BPS Analysis by Dysfunction Type, 2023 to 2033

Figure 69: Asia Pacific Market Y-o-Y Growth (%) Projections by Dysfunction Type, 2023 to 2033

Figure 70: Asia Pacific Market Value (US$ Million) Analysis by Drug, 2018 to 2033

Figure 71: Asia Pacific Market Value Share (%) and BPS Analysis by Drug, 2023 to 2033

Figure 72: Asia Pacific Market Y-o-Y Growth (%) Projections by Drug, 2023 to 2033

Figure 73: Asia Pacific Market Attractiveness by Dysfunction Type, 2023 to 2033

Figure 74: Asia Pacific Market Attractiveness by Drug, 2023 to 2033

Figure 75: Asia Pacific Market Attractiveness by Country, 2023 to 2033

Figure 76: MEA Market Value (US$ Million) by Dysfunction Type, 2023 to 2033

Figure 77: MEA Market Value (US$ Million) by Drug, 2023 to 2033

Figure 78: MEA Market Value (US$ Million) by Country, 2023 to 2033

Figure 79: MEA Market Value (US$ Million) Analysis by Country, 2018 to 2033

Figure 80: MEA Market Value Share (%) and BPS Analysis by Country, 2023 to 2033

Figure 81: MEA Market Y-o-Y Growth (%) Projections by Country, 2023 to 2033

Figure 82: MEA Market Value (US$ Million) Analysis by Dysfunction Type, 2018 to 2033

Figure 83: MEA Market Value Share (%) and BPS Analysis by Dysfunction Type, 2023 to 2033

Figure 84: MEA Market Y-o-Y Growth (%) Projections by Dysfunction Type, 2023 to 2033

Figure 85: MEA Market Value (US$ Million) Analysis by Drug, 2018 to 2033

Figure 86: MEA Market Value Share (%) and BPS Analysis by Drug, 2023 to 2033

Figure 87: MEA Market Y-o-Y Growth (%) Projections by Drug, 2023 to 2033

Figure 88: MEA Market Attractiveness by Dysfunction Type, 2023 to 2033

Figure 89: MEA Market Attractiveness by Drug, 2023 to 2033

Figure 90: MEA Market Attractiveness by Country, 2023 to 2033

Recommendations

Healthcare

Ophthalmic Diagnostic Equipment Market

Published : March 2024

Healthcare

Dry Eye Syndrome Treatment Market

Published : October 2023

Healthcare

Vision Care Market

Published : August 2023

Healthcare

Myopia and Presbyopia Treatment Market

Published : June 2022

Explore Healthcare Insights

View Reports

Age Related Vision Dysfunction Market