Sage Extract Market Size and Share Forecast Outlook 2025 to 2035

The Sage Extract Market is estimated to be valued at USD 5.3 billion in 2025 and is projected to reach USD 8.7 billion by 2035, registering a compound annual growth rate (CAGR) of 5.2% over the forecast period.
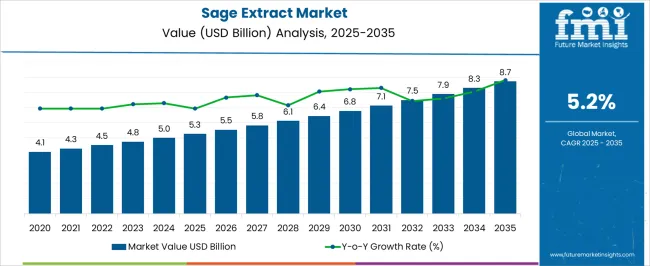
Quick Stats for Sage Extract Market

  • Sage Extract Market Value (2025): USD 5.3 billion
  • Sage Extract Market Forecast Value (2035): USD 8.7 billion
  • Sage Extract Market Forecast CAGR: 5.2%
  • Leading Segment in Sage Extract Market in 2025: Sage Extract for Food And Beverage (40.0%)
  • Key Growth Regions in Sage Extract Market: North America, Asia-Pacific, Europe
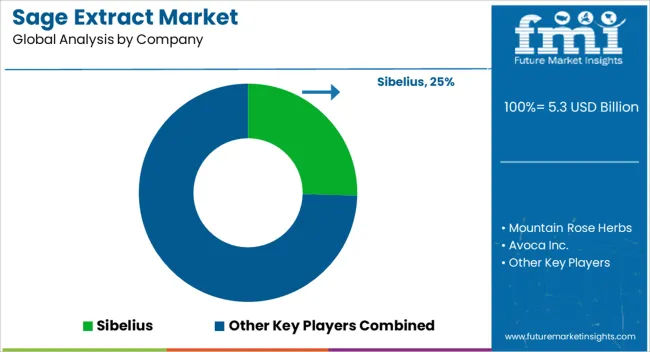
  • Top Key Players in Sage Extract Market: Sibelius, Mountain Rose Herbs, Avoca Inc., Aphios Corporation, Wuhan Dahua, App Chem-Bio, Greenlife, Shanxi Jinjin, Haotian, Capot, Sami Labs Limited

Sage Extract Market Market Value Analysis

Sage Extract Market Key Takeaways

Metric Value
Sage Extract Market Estimated Value in (2025 E) USD 5.3 billion
Sage Extract Market Forecast Value in (2035 F) USD 8.7 billion
Forecast CAGR (2025 to 2035) 5.2%

Why is the Sage Extract Market Growing?

The Sage Extract market is experiencing steady growth driven by rising consumer preference for natural and plant-based ingredients across food, beverage, and nutraceutical industries. Increasing awareness regarding the health benefits of sage, including its antioxidant, anti-inflammatory, and cognitive support properties, is further enhancing demand.

Growth is also supported by the trend toward clean-label products and the incorporation of herbal extracts in functional foods and beverages. Investments in organic farming and sustainable sourcing of sage are enabling manufacturers to meet the demand for high-quality extracts.

The market is further shaped by innovation in processing technologies, which allow the production of highly concentrated and standardized extracts with consistent efficacy As consumer interest in wellness and natural alternatives continues to expand, the Sage Extract market is poised for ongoing growth, with opportunities emerging in product diversification, functional ingredient applications, and premium packaging solutions that enhance product stability and shelf life.

Segmental Analysis

The sage extract market is segmented by end use industries, nature of production, packaging, distribution channel, and geographic regions. By end use industries, sage extract market is divided into Sage Extract for Food And Beverage, Sage Extract for Pharmaceuticals, and Sage Extract for Cosmeceuticals. In terms of nature of production, sage extract market is classified into Organic Sage Extract and Conventional Sage Extract. Based on packaging, sage extract market is segmented into Amber Glass Sage Extract Bottle, Sage Extract Bottle with Dropper, and Plastic Sage Extract Bottle. By distribution channel, sage extract market is segmented into Sage Extract Sales via Online Retailers, Sage Extract Sales via Supermarkets, Sage Extract Sales via Specialty Stores, Sage Extract Sales via Grocery Stores, and Sage Extract Sales via Other Distribution Channels. Regionally, the sage extract industry is classified into North America, Latin America, Western Europe, Eastern Europe, Balkan & Baltic Countries, Russia & Belarus, Central Asia, East Asia, South Asia & Pacific, and the Middle East & Africa.
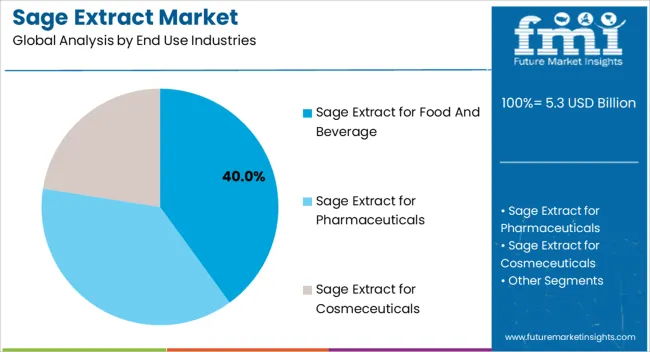
Insights into the Sage Extract for Food And Beverage Segment

Sage Extract Market Analysis By End Use Industries

The Sage Extract for Food and Beverage end-use industry is projected to hold 40.00% of the market revenue share in 2025, making it the leading segment. This prominence is being driven by the increasing incorporation of sage extract as a natural flavoring, preservative, and functional ingredient in various food and beverage formulations. The segment’s growth has been reinforced by the rising consumer demand for natural and plant-based ingredients, particularly in health-conscious and wellness-oriented products.

Manufacturers are adopting sage extract in beverages, dairy products, confectionery, and culinary applications to enhance taste and deliver additional health benefits. The versatility of sage extract allows it to be blended seamlessly with other natural ingredients, increasing its utility in product innovation.

Additionally, food and beverage companies are increasingly seeking organic and sustainably sourced ingredients, which aligns with the market’s trend toward cleaner, more natural formulations The segment’s growth trajectory is expected to continue as end-users prioritize ingredient transparency, functional benefits, and product differentiation through natural extracts.
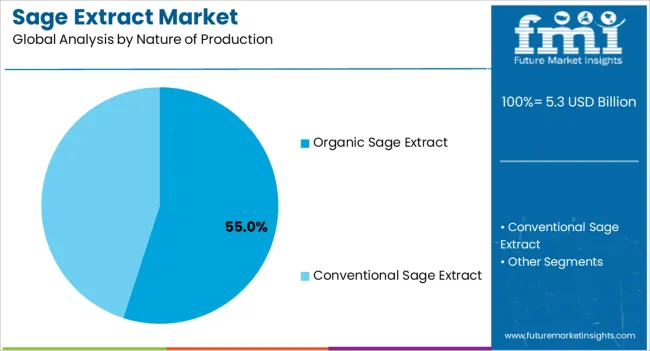
Insights into the Organic Sage Extract Segment

Sage Extract Market Analysis By Nature Of Production

The Organic Sage Extract segment is anticipated to capture 55.00% of the Sage Extract market revenue in 2025, positioning it as the largest production type segment. The segment’s leadership is being supported by consumer preference for organically produced herbal ingredients that are free from synthetic additives, pesticides, and chemical residues.

Demand for organic sage extract is being reinforced by health-conscious consumers who associate organic products with higher quality and improved safety profiles. Additionally, manufacturers are increasingly sourcing organic sage extract to meet regulatory standards and to appeal to premium product segments in the food, beverage, and nutraceutical industries.

Organic production practices also allow for sustainable farming and traceability, which are becoming critical purchasing criteria for both businesses and end consumers The growth of this segment is expected to continue as awareness regarding the benefits of organic ingredients rises, supported by the expansion of retail and online distribution channels that promote natural and sustainable herbal extracts.
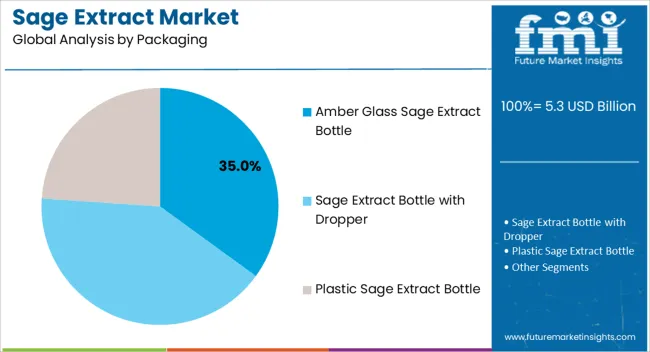
Insights into the Amber Glass Sage Extract Bottle Segment

Sage Extract Market Analysis By Packaging

The Amber Glass Sage Extract Bottle packaging segment is projected to hold 35.00% of the market revenue share in 2025, emerging as the leading packaging format. This dominance is being driven by its ability to protect sage extract from light and oxidation, thereby preserving its potency, flavor, and shelf life.

Amber glass packaging is preferred for high-quality and premium extract products, as it enhances product stability and aligns with consumer expectations for natural and safe packaging materials. The segment’s growth has been supported by increasing adoption in food, beverage, nutraceutical, and cosmetic industries, where maintaining extract integrity is critical.

Additionally, amber glass bottles are compatible with sustainable and recyclable packaging initiatives, making them attractive to environmentally conscious manufacturers and consumers The segment is expected to continue its growth trajectory as the market focuses on premiumization, product safety, and environmentally responsible packaging solutions that support both brand positioning and product efficacy.

Market Overview

Sage Extract Market Overview

Sage is a low-growing evergreen shrub that has been known for centuries for its traditional uses in culinary and herbal medicines. It belongs to the mint family alongside herbs such as rosemary, thyme, basil, and oregano. The leaves of sage can be used for various purposes in different forms. For instance, they can be chewed whole.

They can also be dried and ground into powder or prepared as a fluid extract, tincture, or essential oil. The extract obtained from sage is colorless to a yellow clear liquid. The usage of sage extract in liquid form is trending nowadays. It is used as a dietary supplement and food ingredient in the USA
Analysis of Sage Extract Market By Key Countries

Sage Extract Market Cagr Analysis By Country

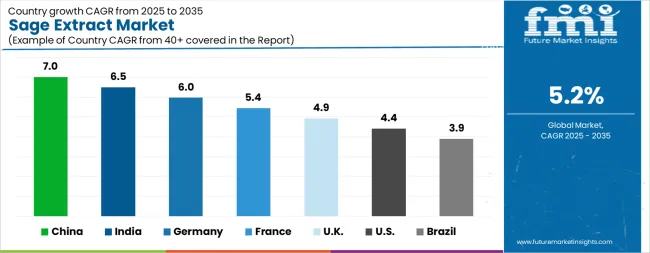
Country CAGR
China 7.0%
India 6.5%
Germany 6.0%
France 5.4%
UK 4.9%
USA 4.4%
Brazil 3.9%

Country-wise Analysis

The Sage Extract Market is expected to register a CAGR of 5.2% during the forecast period, exhibiting varied country level momentum. China leads with the highest CAGR of 7.0%, followed by India at 6.5%. Developed markets such as Germany, France, and the UK continue to expand steadily, while the USA is likely to grow at consistent rates. Brazil posts the lowest CAGR at 3.9%, yet still underscores a broadly positive trajectory for the global Sage Extract Market. In 2024, Germany held a dominant revenue in the Western Europe market and is expected to grow with a CAGR of 6.0%. The USA Sage Extract Market is estimated to be valued at USD 1.9 billion in 2025 and is anticipated to reach a valuation of USD 3.0 billion by 2035. Sales are projected to rise at a CAGR of 4.4% over the forecast period between 2025 and 2035. While Japan and South Korea markets are estimated to be valued at USD 250.8 million and USD 161.6 million respectively in 2025.
Key Players in the Sage Extract Market

Sage Extract Market Analysis By Company

  • Sibelius
  • Mountain Rose Herbs
  • Avoca Inc.
  • Aphios Corporation
  • Wuhan Dahua
  • App Chem-Bio
  • Greenlife
  • Shanxi Jinjin
  • Haotian
  • Capot
  • Sami Labs Limited

Scope of the Report

Item Value
Quantitative Units USD 5.3 Billion
End Use Industries Sage Extract for Food And Beverage, Sage Extract for Pharmaceuticals, and Sage Extract for Cosmeceuticals
Nature of Production Organic Sage Extract and Conventional Sage Extract
Packaging Amber Glass Sage Extract Bottle, Sage Extract Bottle with Dropper, and Plastic Sage Extract Bottle
Distribution Channel Sage Extract Sales via Online Retailers, Sage Extract Sales via Supermarkets, Sage Extract Sales via Specialty Stores, Sage Extract Sales via Grocery Stores, and Sage Extract Sales via Other Distribution Channels
Regions Covered North America, Europe, Asia-Pacific, Latin America, Middle East & Africa
Country Covered United States, Canada, Germany, France, United Kingdom, China, Japan, India, Brazil, South Africa
Key Companies Profiled Sibelius, Mountain Rose Herbs, Avoca Inc., Aphios Corporation, Wuhan Dahua, App Chem-Bio, Greenlife, Shanxi Jinjin, Haotian, Capot, and Sami Labs Limited

Sage Extract Market by Segments

End Use Industries:

  • Sage Extract for Food And Beverage
  • Sage Extract for Pharmaceuticals
  • Sage Extract for Cosmeceuticals

Nature of Production:

  • Organic Sage Extract
  • Conventional Sage Extract

Packaging:

  • Amber Glass Sage Extract Bottle
  • Sage Extract Bottle with Dropper
  • Plastic Sage Extract Bottle

Distribution Channel:

  • Sage Extract Sales via Online Retailers
  • Sage Extract Sales via Supermarkets
  • Sage Extract Sales via Specialty Stores
  • Sage Extract Sales via Grocery Stores
  • Sage Extract Sales via Other Distribution Channels

Region:

  • North America
    • USA
    • Canada
    • Mexico
  • Latin America
    • Brazil
    • Chile
    • Rest of Latin America
  • Western Europe
    • Germany
    • UK
    • Italy
    • Spain
    • France
    • Nordic
    • BENELUX
    • Rest of Western Europe
  • Eastern Europe
    • Russia
    • Poland
    • Hungary
    • Balkan & Baltic
    • Rest of Eastern Europe
  • East Asia
    • China
    • Japan
    • South Korea
  • South Asia and Pacific
    • India
    • ASEAN
    • Australia & New Zealand
    • Rest of South Asia and Pacific
  • Middle East & Africa
    • Kingdom of Saudi Arabia
    • Other GCC Countries
    • Turkiye
    • South Africa
    • Other African Union
    • Rest of Middle East & Africa

Table of Content

  1. Executive Summary
    • Global Market Outlook
    • Demand-side Trends
    • Supply-side Trends
    • Technology Roadmap Analysis
    • Analysis and Recommendations
  2. Market Overview
    • Market Coverage / Taxonomy
    • Market Definition / Scope / Limitations
  3. Market Background
    • Market Dynamics
      • Drivers
      • Restraints
      • Opportunity
      • Trends
    • Scenario Forecast
      • Demand in Optimistic Scenario
      • Demand in Likely Scenario
      • Demand in Conservative Scenario
    • Opportunity Map Analysis
    • Product Life Cycle Analysis
    • Supply Chain Analysis
    • Investment Feasibility Matrix
    • Value Chain Analysis
    • PESTLE and Porter’s Analysis
    • Regulatory Landscape
    • Regional Parent Market Outlook
    • Production and Consumption Statistics
    • Import and Export Statistics
  4. Global Market Analysis 2020 to 2024 and Forecast, 2025 to 2035
    • Historical Market Size Value (USD Million) Analysis, 2020 to 2024
    • Current and Future Market Size Value (USD Million) Projections, 2025 to 2035
      • Y-o-Y Growth Trend Analysis
      • Absolute $ Opportunity Analysis
  5. Global Market Pricing Analysis 2020 to 2024 and Forecast 2025 to 2035
  6. Global Market Analysis 2020 to 2024 and Forecast 2025 to 2035, By End Use Industries
    • Introduction / Key Findings
    • Historical Market Size Value (USD Million) Analysis By End Use Industries , 2020 to 2024
    • Current and Future Market Size Value (USD Million) Analysis and Forecast By End Use Industries , 2025 to 2035
      • for Food And Beverage
      • for Pharmaceuticals
      • for Cosmeceuticals
    • Y-o-Y Growth Trend Analysis By End Use Industries , 2020 to 2024
    • Absolute $ Opportunity Analysis By End Use Industries , 2025 to 2035
  7. Global Market Analysis 2020 to 2024 and Forecast 2025 to 2035, By Nature of Production
    • Introduction / Key Findings
    • Historical Market Size Value (USD Million) Analysis By Nature of Production, 2020 to 2024
    • Current and Future Market Size Value (USD Million) Analysis and Forecast By Nature of Production, 2025 to 2035
      • Organic Sage Extract
      • Conventional Sage Extract
    • Y-o-Y Growth Trend Analysis By Nature of Production, 2020 to 2024
    • Absolute $ Opportunity Analysis By Nature of Production, 2025 to 2035
  8. Global Market Analysis 2020 to 2024 and Forecast 2025 to 2035, By Packaging
    • Introduction / Key Findings
    • Historical Market Size Value (USD Million) Analysis By Packaging, 2020 to 2024
    • Current and Future Market Size Value (USD Million) Analysis and Forecast By Packaging, 2025 to 2035
      • Amber Glass Bottle
      • Bottle with Dropper
      • Plastic Bottle
    • Y-o-Y Growth Trend Analysis By Packaging, 2020 to 2024
    • Absolute $ Opportunity Analysis By Packaging, 2025 to 2035
  9. Global Market Analysis 2020 to 2024 and Forecast 2025 to 2035, By Distribution Channel
    • Introduction / Key Findings
    • Historical Market Size Value (USD Million) Analysis By Distribution Channel, 2020 to 2024
    • Current and Future Market Size Value (USD Million) Analysis and Forecast By Distribution Channel, 2025 to 2035
      • Sales via Online Retailers
      • Sales via Supermarkets
      • Sales via Specialty Stores
      • Sales via Grocery Stores
      • Sales via Other Distribution Channels
    • Y-o-Y Growth Trend Analysis By Distribution Channel, 2020 to 2024
    • Absolute $ Opportunity Analysis By Distribution Channel, 2025 to 2035
  10. Global Market Analysis 2020 to 2024 and Forecast 2025 to 2035, By Region
    • Introduction
    • Historical Market Size Value (USD Million) Analysis By Region, 2020 to 2024
    • Current Market Size Value (USD Million) Analysis and Forecast By Region, 2025 to 2035
      • North America
      • Latin America
      • Western Europe
      • Eastern Europe
      • East Asia
      • South Asia and Pacific
      • Middle East & Africa
    • Market Attractiveness Analysis By Region
  11. North America Market Analysis 2020 to 2024 and Forecast 2025 to 2035, By Country
    • Historical Market Size Value (USD Million) Trend Analysis By Market Taxonomy, 2020 to 2024
    • Market Size Value (USD Million) Forecast By Market Taxonomy, 2025 to 2035
      • By Country
        • USA
        • Canada
        • Mexico
      • By End Use Industries
      • By Nature of Production
      • By Packaging
      • By Distribution Channel
    • Market Attractiveness Analysis
      • By Country
      • By End Use Industries
      • By Nature of Production
      • By Packaging
      • By Distribution Channel
    • Key Takeaways
  12. Latin America Market Analysis 2020 to 2024 and Forecast 2025 to 2035, By Country
    • Historical Market Size Value (USD Million) Trend Analysis By Market Taxonomy, 2020 to 2024
    • Market Size Value (USD Million) Forecast By Market Taxonomy, 2025 to 2035
      • By Country
        • Brazil
        • Chile
        • Rest of Latin America
      • By End Use Industries
      • By Nature of Production
      • By Packaging
      • By Distribution Channel
    • Market Attractiveness Analysis
      • By Country
      • By End Use Industries
      • By Nature of Production
      • By Packaging
      • By Distribution Channel
    • Key Takeaways
  13. Western Europe Market Analysis 2020 to 2024 and Forecast 2025 to 2035, By Country
    • Historical Market Size Value (USD Million) Trend Analysis By Market Taxonomy, 2020 to 2024
    • Market Size Value (USD Million) Forecast By Market Taxonomy, 2025 to 2035
      • By Country
        • Germany
        • UK
        • Italy
        • Spain
        • France
        • Nordic
        • BENELUX
        • Rest of Western Europe
      • By End Use Industries
      • By Nature of Production
      • By Packaging
      • By Distribution Channel
    • Market Attractiveness Analysis
      • By Country
      • By End Use Industries
      • By Nature of Production
      • By Packaging
      • By Distribution Channel
    • Key Takeaways
  14. Eastern Europe Market Analysis 2020 to 2024 and Forecast 2025 to 2035, By Country
    • Historical Market Size Value (USD Million) Trend Analysis By Market Taxonomy, 2020 to 2024
    • Market Size Value (USD Million) Forecast By Market Taxonomy, 2025 to 2035
      • By Country
        • Russia
        • Poland
        • Hungary
        • Balkan & Baltic
        • Rest of Eastern Europe
      • By End Use Industries
      • By Nature of Production
      • By Packaging
      • By Distribution Channel
    • Market Attractiveness Analysis
      • By Country
      • By End Use Industries
      • By Nature of Production
      • By Packaging
      • By Distribution Channel
    • Key Takeaways
  15. East Asia Market Analysis 2020 to 2024 and Forecast 2025 to 2035, By Country
    • Historical Market Size Value (USD Million) Trend Analysis By Market Taxonomy, 2020 to 2024
    • Market Size Value (USD Million) Forecast By Market Taxonomy, 2025 to 2035
      • By Country
        • China
        • Japan
        • South Korea
      • By End Use Industries
      • By Nature of Production
      • By Packaging
      • By Distribution Channel
    • Market Attractiveness Analysis
      • By Country
      • By End Use Industries
      • By Nature of Production
      • By Packaging
      • By Distribution Channel
    • Key Takeaways
  16. South Asia and Pacific Market Analysis 2020 to 2024 and Forecast 2025 to 2035, By Country
    • Historical Market Size Value (USD Million) Trend Analysis By Market Taxonomy, 2020 to 2024
    • Market Size Value (USD Million) Forecast By Market Taxonomy, 2025 to 2035
      • By Country
        • India
        • ASEAN
        • Australia & New Zealand
        • Rest of South Asia and Pacific
      • By End Use Industries
      • By Nature of Production
      • By Packaging
      • By Distribution Channel
    • Market Attractiveness Analysis
      • By Country
      • By End Use Industries
      • By Nature of Production
      • By Packaging
      • By Distribution Channel
    • Key Takeaways
  17. Middle East & Africa Market Analysis 2020 to 2024 and Forecast 2025 to 2035, By Country
    • Historical Market Size Value (USD Million) Trend Analysis By Market Taxonomy, 2020 to 2024
    • Market Size Value (USD Million) Forecast By Market Taxonomy, 2025 to 2035
      • By Country
        • Kingdom of Saudi Arabia
        • Other GCC Countries
        • Turkiye
        • South Africa
        • Other African Union
        • Rest of Middle East & Africa
      • By End Use Industries
      • By Nature of Production
      • By Packaging
      • By Distribution Channel
    • Market Attractiveness Analysis
      • By Country
      • By End Use Industries
      • By Nature of Production
      • By Packaging
      • By Distribution Channel
    • Key Takeaways
  18. Key Countries Market Analysis
    • USA
      • Pricing Analysis
      • Market Share Analysis, 2024
        • By End Use Industries
        • By Nature of Production
        • By Packaging
        • By Distribution Channel
    • Canada
      • Pricing Analysis
      • Market Share Analysis, 2024
        • By End Use Industries
        • By Nature of Production
        • By Packaging
        • By Distribution Channel
    • Mexico
      • Pricing Analysis
      • Market Share Analysis, 2024
        • By End Use Industries
        • By Nature of Production
        • By Packaging
        • By Distribution Channel
    • Brazil
      • Pricing Analysis
      • Market Share Analysis, 2024
        • By End Use Industries
        • By Nature of Production
        • By Packaging
        • By Distribution Channel
    • Chile
      • Pricing Analysis
      • Market Share Analysis, 2024
        • By End Use Industries
        • By Nature of Production
        • By Packaging
        • By Distribution Channel
    • Germany
      • Pricing Analysis
      • Market Share Analysis, 2024
        • By End Use Industries
        • By Nature of Production
        • By Packaging
        • By Distribution Channel
    • UK
      • Pricing Analysis
      • Market Share Analysis, 2024
        • By End Use Industries
        • By Nature of Production
        • By Packaging
        • By Distribution Channel
    • Italy
      • Pricing Analysis
      • Market Share Analysis, 2024
        • By End Use Industries
        • By Nature of Production
        • By Packaging
        • By Distribution Channel
    • Spain
      • Pricing Analysis
      • Market Share Analysis, 2024
        • By End Use Industries
        • By Nature of Production
        • By Packaging
        • By Distribution Channel
    • France
      • Pricing Analysis
      • Market Share Analysis, 2024
        • By End Use Industries
        • By Nature of Production
        • By Packaging
        • By Distribution Channel
    • India
      • Pricing Analysis
      • Market Share Analysis, 2024
        • By End Use Industries
        • By Nature of Production
        • By Packaging
        • By Distribution Channel
    • ASEAN
      • Pricing Analysis
      • Market Share Analysis, 2024
        • By End Use Industries
        • By Nature of Production
        • By Packaging
        • By Distribution Channel
    • Australia & New Zealand
      • Pricing Analysis
      • Market Share Analysis, 2024
        • By End Use Industries
        • By Nature of Production
        • By Packaging
        • By Distribution Channel
    • China
      • Pricing Analysis
      • Market Share Analysis, 2024
        • By End Use Industries
        • By Nature of Production
        • By Packaging
        • By Distribution Channel
    • Japan
      • Pricing Analysis
      • Market Share Analysis, 2024
        • By End Use Industries
        • By Nature of Production
        • By Packaging
        • By Distribution Channel
    • South Korea
      • Pricing Analysis
      • Market Share Analysis, 2024
        • By End Use Industries
        • By Nature of Production
        • By Packaging
        • By Distribution Channel
    • Russia
      • Pricing Analysis
      • Market Share Analysis, 2024
        • By End Use Industries
        • By Nature of Production
        • By Packaging
        • By Distribution Channel
    • Poland
      • Pricing Analysis
      • Market Share Analysis, 2024
        • By End Use Industries
        • By Nature of Production
        • By Packaging
        • By Distribution Channel
    • Hungary
      • Pricing Analysis
      • Market Share Analysis, 2024
        • By End Use Industries
        • By Nature of Production
        • By Packaging
        • By Distribution Channel
    • Kingdom of Saudi Arabia
      • Pricing Analysis
      • Market Share Analysis, 2024
        • By End Use Industries
        • By Nature of Production
        • By Packaging
        • By Distribution Channel
    • Turkiye
      • Pricing Analysis
      • Market Share Analysis, 2024
        • By End Use Industries
        • By Nature of Production
        • By Packaging
        • By Distribution Channel
    • South Africa
      • Pricing Analysis
      • Market Share Analysis, 2024
        • By End Use Industries
        • By Nature of Production
        • By Packaging
        • By Distribution Channel
  19. Market Structure Analysis
    • Competition Dashboard
    • Competition Benchmarking
    • Market Share Analysis of Top Players
      • By Regional
      • By End Use Industries
      • By Nature of Production
      • By Packaging
      • By Distribution Channel
  20. Competition Analysis
    • Competition Deep Dive
      • Sibelius
        • Overview
        • Product Portfolio
        • Profitability by Market Segments (Product/Age /Sales Channel/Region)
        • Sales Footprint
        • Strategy Overview
          • Marketing Strategy
          • Product Strategy
          • Channel Strategy
      • Mountain Rose Herbs
      • Avoca Inc.
      • Aphios Corporation
      • Wuhan Dahua
      • App Chem-Bio
      • Greenlife
      • Shanxi Jinjin
      • Haotian
      • Capot
      • Sami Labs Limited
  21. Assumptions & Acronyms Used
  22. Research Methodology

List of Tables

  • Table 1: Global Market Value (USD Million) Forecast by Region, 2020 to 2035
  • Table 2: Global Market Value (USD Million) Forecast by End Use Industries , 2020 to 2035
  • Table 3: Global Market Value (USD Million) Forecast by Nature of Production, 2020 to 2035
  • Table 4: Global Market Value (USD Million) Forecast by Packaging, 2020 to 2035
  • Table 5: Global Market Value (USD Million) Forecast by Distribution Channel, 2020 to 2035
  • Table 6: North America Market Value (USD Million) Forecast by Country, 2020 to 2035
  • Table 7: North America Market Value (USD Million) Forecast by End Use Industries , 2020 to 2035
  • Table 8: North America Market Value (USD Million) Forecast by Nature of Production, 2020 to 2035
  • Table 9: North America Market Value (USD Million) Forecast by Packaging, 2020 to 2035
  • Table 10: North America Market Value (USD Million) Forecast by Distribution Channel, 2020 to 2035
  • Table 11: Latin America Market Value (USD Million) Forecast by Country, 2020 to 2035
  • Table 12: Latin America Market Value (USD Million) Forecast by End Use Industries , 2020 to 2035
  • Table 13: Latin America Market Value (USD Million) Forecast by Nature of Production, 2020 to 2035
  • Table 14: Latin America Market Value (USD Million) Forecast by Packaging, 2020 to 2035
  • Table 15: Latin America Market Value (USD Million) Forecast by Distribution Channel, 2020 to 2035
  • Table 16: Western Europe Market Value (USD Million) Forecast by Country, 2020 to 2035
  • Table 17: Western Europe Market Value (USD Million) Forecast by End Use Industries , 2020 to 2035
  • Table 18: Western Europe Market Value (USD Million) Forecast by Nature of Production, 2020 to 2035
  • Table 19: Western Europe Market Value (USD Million) Forecast by Packaging, 2020 to 2035
  • Table 20: Western Europe Market Value (USD Million) Forecast by Distribution Channel, 2020 to 2035
  • Table 21: Eastern Europe Market Value (USD Million) Forecast by Country, 2020 to 2035
  • Table 22: Eastern Europe Market Value (USD Million) Forecast by End Use Industries , 2020 to 2035
  • Table 23: Eastern Europe Market Value (USD Million) Forecast by Nature of Production, 2020 to 2035
  • Table 24: Eastern Europe Market Value (USD Million) Forecast by Packaging, 2020 to 2035
  • Table 25: Eastern Europe Market Value (USD Million) Forecast by Distribution Channel, 2020 to 2035
  • Table 26: East Asia Market Value (USD Million) Forecast by Country, 2020 to 2035
  • Table 27: East Asia Market Value (USD Million) Forecast by End Use Industries , 2020 to 2035
  • Table 28: East Asia Market Value (USD Million) Forecast by Nature of Production, 2020 to 2035
  • Table 29: East Asia Market Value (USD Million) Forecast by Packaging, 2020 to 2035
  • Table 30: East Asia Market Value (USD Million) Forecast by Distribution Channel, 2020 to 2035
  • Table 31: South Asia and Pacific Market Value (USD Million) Forecast by Country, 2020 to 2035
  • Table 32: South Asia and Pacific Market Value (USD Million) Forecast by End Use Industries , 2020 to 2035
  • Table 33: South Asia and Pacific Market Value (USD Million) Forecast by Nature of Production, 2020 to 2035
  • Table 34: South Asia and Pacific Market Value (USD Million) Forecast by Packaging, 2020 to 2035
  • Table 35: South Asia and Pacific Market Value (USD Million) Forecast by Distribution Channel, 2020 to 2035
  • Table 36: Middle East & Africa Market Value (USD Million) Forecast by Country, 2020 to 2035
  • Table 37: Middle East & Africa Market Value (USD Million) Forecast by End Use Industries , 2020 to 2035
  • Table 38: Middle East & Africa Market Value (USD Million) Forecast by Nature of Production, 2020 to 2035
  • Table 39: Middle East & Africa Market Value (USD Million) Forecast by Packaging, 2020 to 2035
  • Table 40: Middle East & Africa Market Value (USD Million) Forecast by Distribution Channel, 2020 to 2035

List of Figures

  • Figure 1: Global Market Pricing Analysis
  • Figure 2: Global Market Value (USD Million) Forecast 2020 to 2035
  • Figure 3: Global Market Value Share and BPS Analysis by End Use Industries , 2025 and 2035
  • Figure 4: Global Market Y-o-Y Growth Comparison by End Use Industries , 2025 to 2035
  • Figure 5: Global Market Attractiveness Analysis by End Use Industries
  • Figure 6: Global Market Value Share and BPS Analysis by Nature of Production, 2025 and 2035
  • Figure 7: Global Market Y-o-Y Growth Comparison by Nature of Production, 2025 to 2035
  • Figure 8: Global Market Attractiveness Analysis by Nature of Production
  • Figure 9: Global Market Value Share and BPS Analysis by Packaging, 2025 and 2035
  • Figure 10: Global Market Y-o-Y Growth Comparison by Packaging, 2025 to 2035
  • Figure 11: Global Market Attractiveness Analysis by Packaging
  • Figure 12: Global Market Value Share and BPS Analysis by Distribution Channel, 2025 and 2035
  • Figure 13: Global Market Y-o-Y Growth Comparison by Distribution Channel, 2025 to 2035
  • Figure 14: Global Market Attractiveness Analysis by Distribution Channel
  • Figure 15: Global Market Value (USD Million) Share and BPS Analysis by Region, 2025 and 2035
  • Figure 16: Global Market Y-o-Y Growth Comparison by Region, 2025 to 2035
  • Figure 17: Global Market Attractiveness Analysis by Region
  • Figure 18: North America Market Incremental Dollar Opportunity, 2025 to 2035
  • Figure 19: Latin America Market Incremental Dollar Opportunity, 2025 to 2035
  • Figure 20: Western Europe Market Incremental Dollar Opportunity, 2025 to 2035
  • Figure 21: Eastern Europe Market Incremental Dollar Opportunity, 2025 to 2035
  • Figure 22: East Asia Market Incremental Dollar Opportunity, 2025 to 2035
  • Figure 23: South Asia and Pacific Market Incremental Dollar Opportunity, 2025 to 2035
  • Figure 24: Middle East & Africa Market Incremental Dollar Opportunity, 2025 to 2035
  • Figure 25: North America Market Value Share and BPS Analysis by Country, 2025 and 2035
  • Figure 26: North America Market Value Share and BPS Analysis by End Use Industries , 2025 and 2035
  • Figure 27: North America Market Y-o-Y Growth Comparison by End Use Industries , 2025 to 2035
  • Figure 28: North America Market Attractiveness Analysis by End Use Industries
  • Figure 29: North America Market Value Share and BPS Analysis by Nature of Production, 2025 and 2035
  • Figure 30: North America Market Y-o-Y Growth Comparison by Nature of Production, 2025 to 2035
  • Figure 31: North America Market Attractiveness Analysis by Nature of Production
  • Figure 32: North America Market Value Share and BPS Analysis by Packaging, 2025 and 2035
  • Figure 33: North America Market Y-o-Y Growth Comparison by Packaging, 2025 to 2035
  • Figure 34: North America Market Attractiveness Analysis by Packaging
  • Figure 35: North America Market Value Share and BPS Analysis by Distribution Channel, 2025 and 2035
  • Figure 36: North America Market Y-o-Y Growth Comparison by Distribution Channel, 2025 to 2035
  • Figure 37: North America Market Attractiveness Analysis by Distribution Channel
  • Figure 38: Latin America Market Value Share and BPS Analysis by Country, 2025 and 2035
  • Figure 39: Latin America Market Value Share and BPS Analysis by End Use Industries , 2025 and 2035
  • Figure 40: Latin America Market Y-o-Y Growth Comparison by End Use Industries , 2025 to 2035
  • Figure 41: Latin America Market Attractiveness Analysis by End Use Industries
  • Figure 42: Latin America Market Value Share and BPS Analysis by Nature of Production, 2025 and 2035
  • Figure 43: Latin America Market Y-o-Y Growth Comparison by Nature of Production, 2025 to 2035
  • Figure 44: Latin America Market Attractiveness Analysis by Nature of Production
  • Figure 45: Latin America Market Value Share and BPS Analysis by Packaging, 2025 and 2035
  • Figure 46: Latin America Market Y-o-Y Growth Comparison by Packaging, 2025 to 2035
  • Figure 47: Latin America Market Attractiveness Analysis by Packaging
  • Figure 48: Latin America Market Value Share and BPS Analysis by Distribution Channel, 2025 and 2035
  • Figure 49: Latin America Market Y-o-Y Growth Comparison by Distribution Channel, 2025 to 2035
  • Figure 50: Latin America Market Attractiveness Analysis by Distribution Channel
  • Figure 51: Western Europe Market Value Share and BPS Analysis by Country, 2025 and 2035
  • Figure 52: Western Europe Market Value Share and BPS Analysis by End Use Industries , 2025 and 2035
  • Figure 53: Western Europe Market Y-o-Y Growth Comparison by End Use Industries , 2025 to 2035
  • Figure 54: Western Europe Market Attractiveness Analysis by End Use Industries
  • Figure 55: Western Europe Market Value Share and BPS Analysis by Nature of Production, 2025 and 2035
  • Figure 56: Western Europe Market Y-o-Y Growth Comparison by Nature of Production, 2025 to 2035
  • Figure 57: Western Europe Market Attractiveness Analysis by Nature of Production
  • Figure 58: Western Europe Market Value Share and BPS Analysis by Packaging, 2025 and 2035
  • Figure 59: Western Europe Market Y-o-Y Growth Comparison by Packaging, 2025 to 2035
  • Figure 60: Western Europe Market Attractiveness Analysis by Packaging
  • Figure 61: Western Europe Market Value Share and BPS Analysis by Distribution Channel, 2025 and 2035
  • Figure 62: Western Europe Market Y-o-Y Growth Comparison by Distribution Channel, 2025 to 2035
  • Figure 63: Western Europe Market Attractiveness Analysis by Distribution Channel
  • Figure 64: Eastern Europe Market Value Share and BPS Analysis by Country, 2025 and 2035
  • Figure 65: Eastern Europe Market Value Share and BPS Analysis by End Use Industries , 2025 and 2035
  • Figure 66: Eastern Europe Market Y-o-Y Growth Comparison by End Use Industries , 2025 to 2035
  • Figure 67: Eastern Europe Market Attractiveness Analysis by End Use Industries
  • Figure 68: Eastern Europe Market Value Share and BPS Analysis by Nature of Production, 2025 and 2035
  • Figure 69: Eastern Europe Market Y-o-Y Growth Comparison by Nature of Production, 2025 to 2035
  • Figure 70: Eastern Europe Market Attractiveness Analysis by Nature of Production
  • Figure 71: Eastern Europe Market Value Share and BPS Analysis by Packaging, 2025 and 2035
  • Figure 72: Eastern Europe Market Y-o-Y Growth Comparison by Packaging, 2025 to 2035
  • Figure 73: Eastern Europe Market Attractiveness Analysis by Packaging
  • Figure 74: Eastern Europe Market Value Share and BPS Analysis by Distribution Channel, 2025 and 2035
  • Figure 75: Eastern Europe Market Y-o-Y Growth Comparison by Distribution Channel, 2025 to 2035
  • Figure 76: Eastern Europe Market Attractiveness Analysis by Distribution Channel
  • Figure 77: East Asia Market Value Share and BPS Analysis by Country, 2025 and 2035
  • Figure 78: East Asia Market Value Share and BPS Analysis by End Use Industries , 2025 and 2035
  • Figure 79: East Asia Market Y-o-Y Growth Comparison by End Use Industries , 2025 to 2035
  • Figure 80: East Asia Market Attractiveness Analysis by End Use Industries
  • Figure 81: East Asia Market Value Share and BPS Analysis by Nature of Production, 2025 and 2035
  • Figure 82: East Asia Market Y-o-Y Growth Comparison by Nature of Production, 2025 to 2035
  • Figure 83: East Asia Market Attractiveness Analysis by Nature of Production
  • Figure 84: East Asia Market Value Share and BPS Analysis by Packaging, 2025 and 2035
  • Figure 85: East Asia Market Y-o-Y Growth Comparison by Packaging, 2025 to 2035
  • Figure 86: East Asia Market Attractiveness Analysis by Packaging
  • Figure 87: East Asia Market Value Share and BPS Analysis by Distribution Channel, 2025 and 2035
  • Figure 88: East Asia Market Y-o-Y Growth Comparison by Distribution Channel, 2025 to 2035
  • Figure 89: East Asia Market Attractiveness Analysis by Distribution Channel
  • Figure 90: South Asia and Pacific Market Value Share and BPS Analysis by Country, 2025 and 2035
  • Figure 91: South Asia and Pacific Market Value Share and BPS Analysis by End Use Industries , 2025 and 2035
  • Figure 92: South Asia and Pacific Market Y-o-Y Growth Comparison by End Use Industries , 2025 to 2035
  • Figure 93: South Asia and Pacific Market Attractiveness Analysis by End Use Industries
  • Figure 94: South Asia and Pacific Market Value Share and BPS Analysis by Nature of Production, 2025 and 2035
  • Figure 95: South Asia and Pacific Market Y-o-Y Growth Comparison by Nature of Production, 2025 to 2035
  • Figure 96: South Asia and Pacific Market Attractiveness Analysis by Nature of Production
  • Figure 97: South Asia and Pacific Market Value Share and BPS Analysis by Packaging, 2025 and 2035
  • Figure 98: South Asia and Pacific Market Y-o-Y Growth Comparison by Packaging, 2025 to 2035
  • Figure 99: South Asia and Pacific Market Attractiveness Analysis by Packaging
  • Figure 100: South Asia and Pacific Market Value Share and BPS Analysis by Distribution Channel, 2025 and 2035
  • Figure 101: South Asia and Pacific Market Y-o-Y Growth Comparison by Distribution Channel, 2025 to 2035
  • Figure 102: South Asia and Pacific Market Attractiveness Analysis by Distribution Channel
  • Figure 103: Middle East & Africa Market Value Share and BPS Analysis by Country, 2025 and 2035
  • Figure 104: Middle East & Africa Market Value Share and BPS Analysis by End Use Industries , 2025 and 2035
  • Figure 105: Middle East & Africa Market Y-o-Y Growth Comparison by End Use Industries , 2025 to 2035
  • Figure 106: Middle East & Africa Market Attractiveness Analysis by End Use Industries
  • Figure 107: Middle East & Africa Market Value Share and BPS Analysis by Nature of Production, 2025 and 2035
  • Figure 108: Middle East & Africa Market Y-o-Y Growth Comparison by Nature of Production, 2025 to 2035
  • Figure 109: Middle East & Africa Market Attractiveness Analysis by Nature of Production
  • Figure 110: Middle East & Africa Market Value Share and BPS Analysis by Packaging, 2025 and 2035
  • Figure 111: Middle East & Africa Market Y-o-Y Growth Comparison by Packaging, 2025 to 2035
  • Figure 112: Middle East & Africa Market Attractiveness Analysis by Packaging
  • Figure 113: Middle East & Africa Market Value Share and BPS Analysis by Distribution Channel, 2025 and 2035
  • Figure 114: Middle East & Africa Market Y-o-Y Growth Comparison by Distribution Channel, 2025 to 2035
  • Figure 115: Middle East & Africa Market Attractiveness Analysis by Distribution Channel
  • Figure 116: Global Market – Tier Structure Analysis
  • Figure 117: Global Market – Company Share Analysis

Frequently Asked Questions

How big is the sage extract market in 2025?

The global sage extract market is estimated to be valued at USD 5.3 billion in 2025.

What will be the size of sage extract market in 2035?

The market size for the sage extract market is projected to reach USD 8.7 billion by 2035.

How much will be the sage extract market growth between 2025 and 2035?

The sage extract market is expected to grow at a 5.2% CAGR between 2025 and 2035.

What are the key product types in the sage extract market?

The key product types in sage extract market are sage extract for food and beverage, sage extract for pharmaceuticals and sage extract for cosmeceuticals.

Which nature of production segment to contribute significant share in the sage extract market in 2025?

In terms of nature of production, organic sage extract segment to command 55.0% share in the sage extract market in 2025.

Explore Similar Insights

Future Market Insights

Sage Extract Market

Chat With MaRIA

Chat With

MaRIA

Hi There, I am MaRIA, Your Market Research Intelligence Assistant. How may I help you?