Dosage Cups Market Outlook (2023 to 2033)

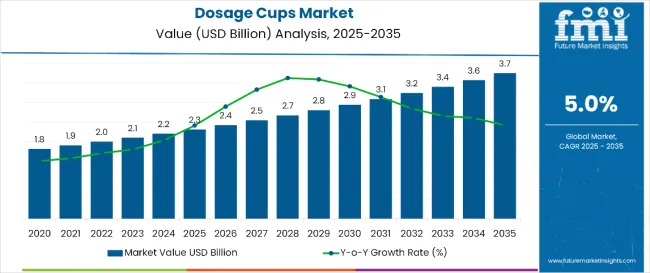
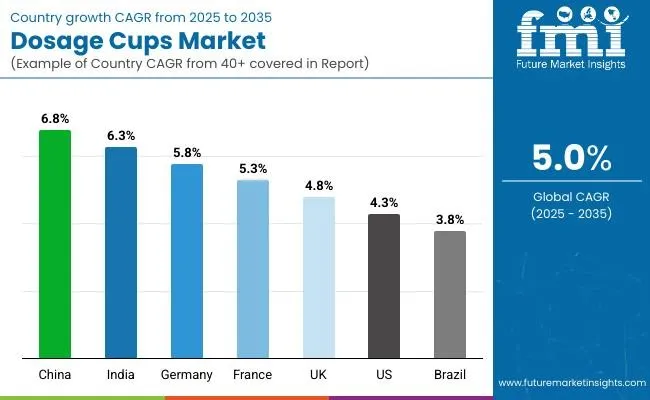
The global dosage cups market size is forecast to reach US$ 2.3 billion in 2023, and further expand at a CAGR of 5.0% between 2023 and 2033. Total dosage cup sales are predicted to total a valuation of US$ 3.7 billion by 2033. Growing demand for reliable and accurate drug measuring instruments is a key factor driving dosage cup demand globally.

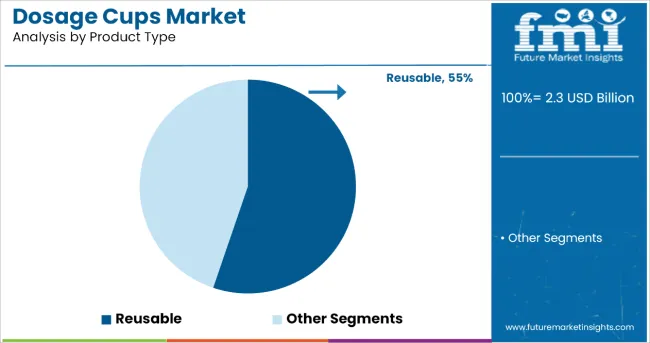
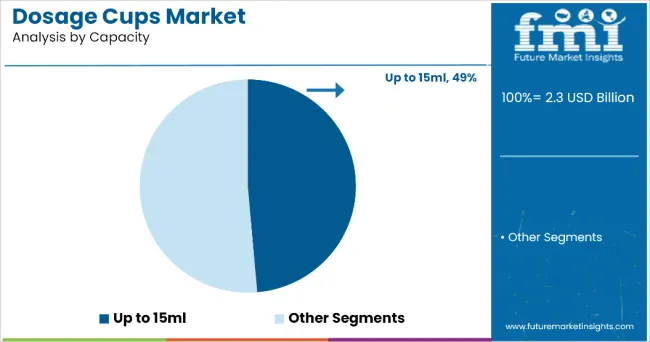
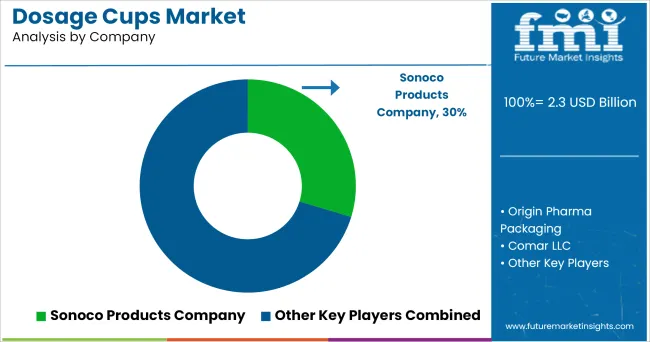
The sales of the dosage cups are anticipated to bolster with top 5 companies expected to hold around 25% of the market in 2023. Based on capacity, above 35ml dosage cups segment is projected to remain the leading among the other dosage cups used for measurement. By product type, the reusable dosage cups segment is estimated to create an incremental opportunity of US$ 1.0 billion during the forecast period.

With the propelling demand from various end-use sectors, the global market for dosage cups is poised to create an absolute incremental growth opportunity of US$ 1.5 billion during the assessment period.

Drug dosage has become a critical step in the management and treatment of diseases. Any error in drug dosage can have negative consequences on the human body, besides acting as an impediment to getting quick results. Numerous errors can be made when administering liquid medication. To reduce this, various pharmaceutical measuring equipment or drug dosing devices are being used, and one such device is dosage cups.

Dosage cups are packaging solutions or measuring instruments used for dispensing liquid and dry medications. These cups help end users to accurately measure the volume of medicine they need to take at a specific time and therefore reduce the risk of a drug overdose.

Dosage cups are lightweight and cost-effective and are being increasingly used in hospitals, medical institutions, clinical labs, and households or homecare settings. Rising prevalence of chronic diseases and increasing pediatric and geriatric population worldwide are expected to boost the global dosage cups industry during the forecast period.

Similarly, growing production and consumption of over-the-counter liquid drug products such as syrups, elixirs, and suspensions coupled with growing demand for safe, accurate, and lightweight measurement devices will boost dosage cup sales over the next ten years.

Demand is particularly rising for disposable dosage cups due to their low cost and ability to reduce the spread of infections. This growing popularity of disposable dosage cups will create lucrative opportunities for dosage cup manufacturers during the assessment period.

Attribute Key Insights
Dosage Cups Market Estimated Value (2023) US$ 2.3 Billion
Projected Market Value (2033) US$ 3.7 Billion
Value CAGR (2022 to 2032) 5.0%
Collective Value Share: Top 3 Countries (2022) 40% to 45%

Don't pay for what you don't need

Customize your report by selecting specific countries or regions and save 30%!

Demand Analysis of Dosage Cups (2015 to 2022) Vs Sales Forecast (2023 to 2033)

The global dosage cups market witnessed a CAGR of 3.8% during the historic period (2017 to 2021) and reached around US$ 2.1 billion in 2022. However, for the forecast period of 2023 to 2033, a steady CAGR of 5.0% has been predicted by Future Market Insights for the global dosage cups industry.

Dosage cups refer to a particular type of measurement cup used to measure the amount of an oral drug or other medication patients, or healthcare professionals have to take. These cups have made medication dispersion easy and accurate, and are gaining wider popularity globally.

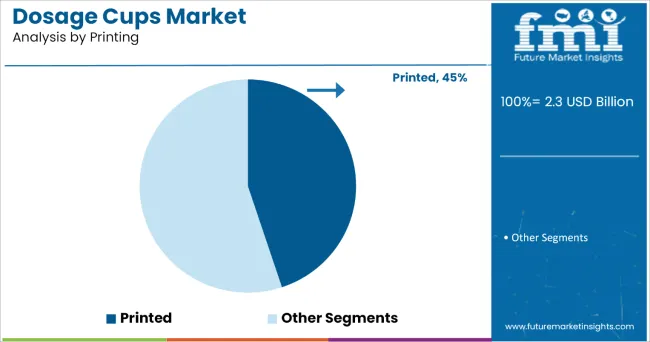
For accurate measurement, which reduces the possibility of error while consuming liquid-based medicines, the dosage cups may be printed, non-printed, or embossed. Dosage cups are frequently utilized in the pharmaceutical industry as a result of the trend toward convenient and easy-to-use packaging and goods. In overall, the trend toward dosage cups is being driven by the pharmaceutical industry's growing preference for portable, affordable, and convenient packaging.

Increasing incidence of chronic diseases and rising spending on medications are expected to play key roles in fostering dosage cup sales during the forecast period.

Growing geriatric population, rising preference for liquid medication, and increasing popularity of disposable cups will also play a crucial role in elevating dosage cup demand during the next ten years.

What are the Key Trends Driving the Global Dosage Cups Industry?

Rising Demand for Cough Syrups Driving the Dosage Cups Industry

The growing popularity of cough syrups among kids, grandparents, and others is due to their ease of use and the benefit of taking a fixed dose of medication using dosage cups, which lowers the chance of overdosing. The market for dosage cups is expanding due to the rising need for easy-to-use medicines such as syrups. Consequently, growing need for convenience when taking medications will propel dosage cups demand during the forecast period.

Dosage cups are easily disposed of, biodegrade, or can be recycled. They are not harmful to the environment. Demand is particularly growing for disposable dosage cups in the market. Growing prevalence of infectious viruses including the coronavirus, influenza, typhoid, etc. is fuelling the adoption of disposable dosage cups as they significantly reduce the spread of viruses.

Ismail Sutaria
Ismail Sutaria

Principal Consultant

Talk to Analyst

Find your sweet spots for generating winning opportunities in this market.

Comparative View of Adjacent Dosage Cups Market

Dosage Cups Market:

Attributes Dosage Cups Market
CAGR (2022 to 2032) 5.0%
Market Value (2023) US$ 2.3 billion
Growth Factor Convenience offered by dosage cups in measuring the dose of drugs is expected to boost the global market during the forecast period.
Key Trend Increasing sales of over-the-counter drugs is expected to fuel dosage cups demand.

Paper Cone Cup Market:

Attributes Paper Cone Cup Market
CAGR (2022 to 2032) 4.8%
Market Value (2022) US$ 2.2 billion
Growth Factor Rising usage across commercial and residential sectors is expected to boost the global cone cup market during the forecast period.
Key Trend Implementation of stringent government regulations on plastic usage and increasing demand for sustainable packaging solutions will boost paper cone cup sales over the next ten years.

Disposable Cup Market:

Attributes Disposable Cup Market
CAGR (2022 to 2032) 5.7%
Market Value (2022) US$ 10.9 billion
Growth Factor Rising concerns about health and hygiene coupled with increasing need for preventing the spread of infection is driving demand for disposable cups globally.
Key Trend Increasing popularity of disposable cups across foodservice industry due to their lightweight and cost-effective features will boost disposable cup sales during the forthcoming decade.

Country-wise Insights

Country USA
Market Share (2023) 15.1%
Market Share (2033) 12.7%
Basis Points (BPS) Analysis -240
Country China
Market Share (2023) 10.0%
Market Share (2033) 10.6%
Basis Points (BPS) Analysis 60
Country India
Market Share (2023) 5.4%
Market Share (2033) 5.9%
Basis Points (BPS) Analysis 50
Country Germany
Market Share (2023) 3.9%
Market Share (2033) 4.0%
Basis Points (BPS) Analysis 10
Country United Kingdom
Market Share (2023) 2.0%
Market Share (2033) 2.1%
Basis Points (BPS) Analysis 10

How will Dosage Cups Market Progress in the United Kingdom During the Next Ten Years?

Rising Prevalence of Chronic Diseases to Boot Dosage Cups Sales in the United Kingdom

According to Future Market Insights’ latest analysis, the United Kingdom dosage cups industry is expected to generate lucrative revenues during the forecast period owing to increasing geriatric population, rising prevalence of chronic and infectious diseases, and growing awareness about the benefits of using dosage cups.

Similarly, increasing awareness about the adverse impact of overdose of medication among patients and rising government focus on developing healthcare and pharmaceutical industries will elevate dosage cup demand across the country during the projection period.

In 2020, General Pharmaceutical Council (GPhC) launched its strategic plan 2030, which describes the 10-year visionary plans towards fitness and the quick action to protect patients whenever needed. This is expected to create lucrative opportunities for dosage cup manufacturers in the country.

Will the USA Retain its Dominance over the Global Dosage Cups Industry?

Increasing Consumption of Liquid Medication (Syrups) Fostering Market Expansion in the USA

The USA dosage cups market is poised to exhibit a steady growth rate during the projection period, generating substantial revenues by the end of 2033. FMI predicts the USA to hold around 15.1% share of the global dosage cups industry in 2023, making it the most dominant market.

Rising production and consumption of medicines such as cough syrups, presence of the world’s leading pharmaceutical companies, and increasing healthcare spending are a few of the factors expected to drive demand for dosage cups across the USA during the assessment period.

According to the Consumer Healthcare Products Association (CHPA), the demand for children’s chest pain, cough syrups, and other products increased by 65% from the last year (2021).

Factors such as increasing flu cases in the country and presence of high levels of health awareness have increased demand for cough syrups and other medical products and the trend is expected to continue during the forecast period. This is expected to boost dosage cup sales in the USA.

Subsequently, increasing government expenditure on pharmaceuticals and health sector in the country will aid create growth prospects for the market during the assessment period.

Get the data you need at a Fraction of the cost

Personalize your report by choosing insights you need
and save 40%!

Category-wise Insights

Which is the Most Popular Product Type in the Market?

Reusable Dosage Cups Remain the Highly Sought-After Product Type

According to Future Market Insight, reusable dosage cups segment is expected to hold a prominent share of around 80% in the global dosage cups industry in 2023. Overall sales of reusable dosage cups are slated to rise at 4.1% CAGR during the assessment period. This is attributed to rising end user preference for reusable dosage cups due to their cost-effectiveness and recyclable features.

The reusable dosage cups are cost-effective and provide accurate measurements of a medical dose. They are gaining wider popularity across the world because of their reusability, ease-to-use nature, and pollution-free features.

Which End User Segment will Create Maximum Growth Opportunities for Dosage Cup Manufacturers?

Pharmaceutical Sector to Generate Maximum Growth Opportunities for Manufacturers

Based on end users, the pharmaceutical segment is anticipated to accelerate at a CAGR of 5.7% during the forecast period. Rising production and consumption of pharmaceuticals and increasing geriatric population associated with their dependency on medicines are key factors driving demand for dosage cups globally.

Similarly, growing prevalence of various diseases coupled with high spending on pharmaceuticals and increasing popularity of over-the-counter products will elevate demand for dosage cups across pharmaceutical sector during the forecast period.

Competitive Landscape

Key dosage cup manufacturers are aiming at increasing their sales and revenues by launching new products, expanding their production capabilities, and adopting merger & acquisition strategy. They are also upgrading their facilities by installing novel manufacturing machinery. Few of the recent key developments by the leading players are as follows:

  • In February 2022, Automatic Plastics Ltd. was acquired by Comar LLC. The union of APL and Comar strengthens Comar's manufacturing capabilities for medical device and pharmaceutical packaging.
  • In December 2021, H&T Presspart Manufacturing Ltd. collaborated with BIOCORP, a French-based company specializing in the development and manufacture of medical devices and providing healthcare solutions. This collaboration will work on TM digital technology, a smart sensor that converts inhalers into connected systems to assist asthma patients in delivering their medication.
  • In January 2020, LLC Farmmash started production of SD-15, its new dosing cup which can be equipped with a child-resistant cap.

 Scope of the Report

Attribute Details
Estimated Market Size (2023) US$ 2.3 billion
Projected Market Size (2033) US$ 3.7 billion
Anticipated Growth Rate (2023 to 2033) 5.0% CAGR
Base Year for Estimation 2023
Historical Data 2015 to 2022
Forecast Period 2023 to 2033
Quantitative Units Revenue in US$ Billion, Volume in Units, and CAGR from 2022 to 2032
Segments Covered
  • Capacity
  • Product Type
  • Printing
  • End Users
  • Region
Regions Covered
  • North America
  • Latin America
  • Europe
  • East Asia
  • South Asia
  • Middle East and Africa
  • Oceania
Key Countries Covered
  • USA
  • Canada
  • Mexico
  • Brazil
  • Germany
  • United Kingdom
  • France
  • Italy
  • Spain
  • Russia
  • China
  • Japan
  • India
  • GCC countries
  • Australia
Key Companies Profiled
  • Sonoco Products Company
  • Origin Pharma Packaging
  • Comar LLC
  • Adelphi Healthcare Packaging
  • SGH Healthcaring
  • Gerresheimer AG
  • Hammarplast Medical AB
  • Plastic Bubbles
  • Hiwalt (Pty) Ltd
  • H&T Presspart Manufacturing Ltd.
  • LLC Farmmash
  • Phormpak SA
  • Techplas Aust Pty Ltd.
  • Parekhplast India Limited
  • UD Pharma Rubber Products
Report Coverage Revenue Forecast, Volume Forecast, Company Ranking, Competitive Landscape, Growth Factors, Trends, and Pricing Analysis

Dosage Cups Industry by Category

By Capacity:

  • Up to 15ml
  • 16ml to 35ml
  • Above 35ml

By Product Type:

  • Reusable
  • Disposable

By Printing:

  • Printed
  • Non-printed
  • Embossed

By End Users:

  • Hospitals
  • Clinical Labs
  • Medical Institutes
  • Households
  • Pharmaceuticals
  • Others

By Region:

  • North America
  • Latin America
  • Europe
  • South Asia
  • East Asia
  • Middle East & Africa
  • Oceania

Frequently Asked Questions

What is the Current Dosage Cups Market Valuation?

The dosage cups market is valued at US$ 2.3 billion in 2023.

What is the Projected Size of the Dosage Cups Market by 2033?

The dosage cups market is projected to attain a value of US$ 3.7 billion by 2033.

What is the Estimated CAGR for the Dosage Cups Market?

The dosage cups market is anticipated to surge at a robust 5.0% CAGR through 2033.

Which Country Demonstrates Significant Profit Potential for Dosage Cups?

The United States shines, commanding a substantial 15.1% revenue share in 2023.

Which is the Key Segment in the Dosage Cups Market by Product Type?

The reusable dosage cups segment is poised to dominate the market, with 4.1% CAGR through 2033.

Table of Content
1. Executive Summary | Dosage Cups Marke

    1.1. Global Market Outlook

    1.2. Demand-side Trends

    1.3. Supply-side Trends

    1.4. Product Type Roadmap Analysis

    1.5. Analysis and Recommendations

2. Market Overview

    2.1. Market Coverage / Taxonomy

    2.2. Market Definition / Scope / Limitations

3. Market Background

    3.1. Market Dynamics

        3.1.1. Drivers

        3.1.2. Restraints

        3.1.3. Opportunity

        3.1.4. Trends

    3.2. Impact of Covid-19

        3.2.1. Demand in Optimistic Scenario

        3.2.2. Demand in Likely Scenario

        3.2.3. Demand in Conservative Scenario

    3.3. Macro Factors and Forecast Factors

    3.4. Value Chain Analysis

        3.4.1. Profit Margin Analysis

        3.4.2. Raw Capacity Suppliers

        3.4.3. Manufacturers, Wholesalers and Distributors

        3.4.4. End Users/ Customers

    3.5. Regional Parent Market Outlook

    3.6. Production and Consumption Statistics

    3.7. Global Average Pricing Analysis Benchmark

4. Global Analysis 2015 to 2022 and Forecast, 2023 to 2033

    4.1. Historical Market Size Value (US$ Billion) & Volume (Million Units) Analysis, 2015 to 2022

    4.2. Current and Future Market Size Value (US$ Billion) & Volume (Million Units) Projections, 2023 to 2033

        4.2.1. Y-o-Y Growth Trend Analysis

        4.2.2. Absolute $ Opportunity Analysis

5. Global Analysis 2015 to 2022 and Forecast 2023 to 2033, By Capacity

    5.1. Introduction / Key Findings

    5.2. Historical Market Size Value (US$ Billion) & Volume (Million Units) Analysis By Capacity, 2015 to 2022

    5.3. Current and Future Market Size Value (US$ Billion) & Volume (Million Units) Analysis and Forecast By Capacity, 2023 to 2033

        5.3.1. Up to 15ml

        5.3.2. 16ml to 35ml

        5.3.3. Above 35ml

    5.4. Y-o-Y Growth Trend Analysis by Capacity, 2015 to 2022

    5.5. Absolute $ Opportunity Analysis by Capacity, 2023 to 2033

6. Global Analysis 2015 to 2022 and Forecast 2023 to 2033, By Product Type

    6.1. Introduction / Key Findings

    6.2. Historical Market Size Value (US$ Billion) & Volume (Million Units) Analysis by Product Type, 2015 to 2022

    6.3. Current and Future Market Size Value (US$ Billion) & Volume (Million Units) Analysis and Forecast by Product Type, 2023 to 2033

        6.3.1. Reusable

        6.3.2. Disposable

    6.4. Y-o-Y Growth Trend Analysis by Product Type, 2015 to 2022

    6.5. Absolute $ Opportunity Analysis by Product Type, 2023 to 2033

7. Global Analysis 2015 to 2022 and Forecast 2023 to 2033, By Printing

    7.1. Introduction / Key Findings

    7.2. Historical Market Size Value (US$ Billion) & Volume (Million Units) Analysis by Printing, 2015 to 2022

    7.3. Current and Future Market Size Value (US$ Billion) & Volume (Million Units) Analysis and Forecast by Printing, 2023 to 2033

        7.3.1. Printed

        7.3.2. Non-printed

        7.3.3. Embossed

    7.4. Y-o-Y Growth Trend Analysis by Printing, 2015 to 2022

    7.5. Absolute $ Opportunity Analysis by Printing, 2023 to 2033

8. Global Analysis 2015 to 2022 and Forecast 2023 to 2033, By End Users

    8.1. Introduction / Key Findings

    8.2. Historical Market Size Value (US$ Billion) & Volume (Million Units) Analysis by End Users, 2015 to 2022

    8.3. Current and Future Market Size Value (US$ Billion) & Volume (Million Units) Analysis and Forecast by End Users, 2023 to 2033

        8.3.1. Hospitals

        8.3.2. Clinical Labs

        8.3.3. Medical Institutes

        8.3.4. Households

        8.3.5. Pharmaceuticals

        8.3.6. Others

    8.4. Y-o-Y Growth Trend Analysis by End Users, 2015 to 2022

    8.5. Absolute $ Opportunity Analysis by End Users, 2023 to 2033

9. Global Analysis 2015 to 2022 and Forecast 2023 to 2033, by Region

    9.1. Introduction / Key Findings

    9.2. Historical Market Size Value (US$ Billion) & Volume (Million Units) Analysis by Region, 2015 to 2022

    9.3. Current and Future Market Size Value (US$ Billion) & Volume (Million Units) Analysis and Forecast by Region, 2023 to 2033

        9.3.1. North America

        9.3.2. Latin America

        9.3.3. Europe

        9.3.4. East Asia

        9.3.5. South Asia

        9.3.6. Oceania

        9.3.7. Middle East and Africa (The Middle East & Africa)

    9.4. Market Attractiveness Analysis, by Region

10. North America Analysis 2015 to 2022 and Forecast 2023 to 2033, By Country

    10.1. Historical Market Size Value (US$ Billion) & Volume (Million Units) Trend Analysis by Market Taxonomy, 2015 to 2022

    10.2. Market Size Value (US$ Billion) & Volume (Million Units) Forecast by Market Taxonomy, 2023 to 2033

        10.2.1. By Country

            10.2.1.1. USA

            10.2.1.2. Canada

        10.2.2. By Capacity

        10.2.3. By Product Type

        10.2.4. By Printing

        10.2.5. By End Users

    10.3. Market Attractiveness Analysis

        10.3.1. By Country

        10.3.2. By Capacity

        10.3.3. By Product Type

        10.3.4. By Printing

        10.3.5. By End Users

    10.4. Key Takeaways

11. Latin America Analysis 2015 to 2022 and Forecast 2023 to 2033, By Country

    11.1. Historical Market Size Value (US$ Billion) & Volume (Million Units) Trend Analysis By Market Taxonomy, 2015 to 2022

    11.2. Market Size Value (US$ Billion) & Volume (Million Units) Forecast By Market Taxonomy, 2023 to 2033

        11.2.1. By Country

            11.2.1.1. Brazil

            11.2.1.2. Mexico

            11.2.1.3. Argentina

            11.2.1.4. Chile

            11.2.1.5. Peru

            11.2.1.6. Rest of Latin America

        11.2.2. By Capacity

        11.2.3. By Product Type

        11.2.4. By Printing

        11.2.5. By End Users

    11.3. Market Attractiveness Analysis

        11.3.1. By Country

        11.3.2. By Capacity

        11.3.3. By Product Type

        11.3.4. By Printing

        11.3.5. By End Users

    11.4. Key Takeaways

12. Europe Analysis 2015 to 2022 and Forecast 2023 to 2033, By Country

    12.1. Historical Market Size Value (US$ Billion) & Volume (Million Units) Trend Analysis By Market Taxonomy, 2015 to 2022

    12.2. Market Size Value (US$ Billion) & Volume (Million Units) Forecast By Market Taxonomy, 2023 to 2033

        12.2.1. By Country

            12.2.1.1. Germany

            12.2.1.2. Italy

            12.2.1.3. France

            12.2.1.4. United Kingdom

            12.2.1.5. Spain

            12.2.1.6. BENELUX

            12.2.1.7. Nordic

            12.2.1.8. Russia

            12.2.1.9. Poland

            12.2.1.10. Rest of Europe

        12.2.2. By Capacity

        12.2.3. By Product Type

        12.2.4. By Printing

        12.2.5. By End Users

    12.3. Market Attractiveness Analysis

        12.3.1. By Country

        12.3.2. By Capacity

        12.3.3. By Product Type

        12.3.4. By Printing

        12.3.5. By End Users

    12.4. Key Takeaways

13. East Asia Analysis 2015 to 2022 and Forecast 2023 to 2033, By Country

    13.1. Historical Market Size Value (US$ Billion) & Volume (Million Units) Trend Analysis By Market Taxonomy, 2015 to 2022

    13.2. Market Size Value (US$ Billion) & Volume (Million Units) Forecast By Market Taxonomy, 2023 to 2033

        13.2.1. By Country

            13.2.1.1. China

            13.2.1.2. Japan

            13.2.1.3. South Korea

        13.2.2. By Capacity

        13.2.3. By Product Type

        13.2.4. By Printing

        13.2.5. By End Users

    13.3. Market Attractiveness Analysis

        13.3.1. By Country

        13.3.2. By Capacity

        13.3.3. By Product Type

        13.3.4. By Printing

        13.3.5. By End Users

    13.4. Key Takeaways

14. South Asia Analysis 2015 to 2022 and Forecast 2023 to 2033, By Country

    14.1. Historical Market Size Value (US$ Billion) & Volume (Million Units) Trend Analysis By Market Taxonomy, 2015 to 2022

    14.2. Market Size Value (US$ Billion) & Volume (Million Units) Forecast By Market Taxonomy, 2023 to 2033

        14.2.1. By Country

            14.2.1.1. India

            14.2.1.2. Thailand

            14.2.1.3. Malaysia

            14.2.1.4. Indonesia

            14.2.1.5. Rest of South Asia

        14.2.2. By Capacity

        14.2.3. By Product Type

        14.2.4. By Printing

        14.2.5. By End Users

    14.3. Market Attractiveness Analysis

        14.3.1. By Country

        14.3.2. By Capacity

        14.3.3. By Product Type

        14.3.4. By Printing

        14.3.5. By End Users

    14.4. Key Takeaways

15. Oceania Analysis 2015 to 2022 and Forecast 2023 to 2033, By Country

    15.1. Historical Market Size Value (US$ Billion) & Volume (Million Units) Trend Analysis By Market Taxonomy, 2015 to 2022

    15.2. Market Size Value (US$ Billion) & Volume (Million Units) Forecast By Market Taxonomy, 2023 to 2033

        15.2.1. By Country

            15.2.1.1. Australia

            15.2.1.2. New Zealand

        15.2.2. By Capacity

        15.2.3. By Product Type

        15.2.4. By Printing

        15.2.5. By End Users

    15.3. Market Attractiveness Analysis

        15.3.1. By Country

        15.3.2. By Capacity

        15.3.3. By Product Type

        15.3.4. By Printing

        15.3.5. By End Users

    15.4. Key Takeaways

16. Middle East & Africa Analysis 2015 to 2022 and Forecast 2023 to 2033, By Country

    16.1. Historical Market Size Value (US$ Billion) & Volume (Million Units) Trend Analysis By Market Taxonomy, 2015 to 2022

    16.2. Market Size Value (US$ Billion) & Volume (Million Units) Forecast By Market Taxonomy, 2023 to 2033

        16.2.1. By Country

            16.2.1.1. GCC Countries

            16.2.1.2. Türkiye

            16.2.1.3. Northern Africa

            16.2.1.4. South Africa

            16.2.1.5. Rest of The Middle East & Africa

        16.2.2. By Capacity

        16.2.3. By Product Type

        16.2.4. By Printing

        16.2.5. By End Users

    16.3. Market Attractiveness Analysis

        16.3.1. By Country

        16.3.2. By Capacity

        16.3.3. By Product Type

        16.3.4. By Printing

        16.3.5. By End Users

    16.4. Key Takeaways

17. Country wise Analysis 

    17.1. United States of America (USA)

        17.1.1. Market Share Analysis, 2023

        17.1.2. By Capacity

        17.1.3. By Product Type

        17.1.4. By Printing

        17.1.5. By End Users

    17.2. Canada

        17.2.1. Market Share Analysis, 2023

        17.2.2. By Capacity

        17.2.3. By Product Type

        17.2.4. By Printing

        17.2.5. By End Users

    17.3. Brazil

        17.3.1. Market Share Analysis, 2023

        17.3.2. By Capacity

        17.3.3. By Product Type

        17.3.4. By Printing

        17.3.5. By End Users

    17.4. Mexico

        17.4.1. Market Share Analysis, 2023

        17.4.2. By Capacity

        17.4.3. By Product Type

        17.4.4. By Printing

        17.4.5. By End Users

    17.5. Germany

        17.5.1. Market Share Analysis, 2023

        17.5.2. By Capacity

        17.5.3. By Product Type

        17.5.4. By Printing

        17.5.5. By End Users

    17.6. Italy

        17.6.1. Market Share Analysis, 2023

        17.6.2. By Capacity

        17.6.3. By Product Type

        17.6.4. By Printing

        17.6.5. By End Users

    17.7. France

        17.7.1. Market Share Analysis, 2023

        17.7.2. By Capacity

        17.7.3. By Product Type

        17.7.4. By Printing

        17.7.5. By End Users

    17.8. Spain

        17.8.1. Market Share Analysis, 2023

        17.8.2. By Capacity

        17.8.3. By Product Type

        17.8.4. By Printing

        17.8.5. By End Users

    17.9. United Kingdom

        17.9.1. Market Share Analysis, 2023

        17.9.2. By Capacity

        17.9.3. By Product Type

        17.9.4. By Printing

        17.9.5. By End Users

    17.10. Russia

        17.10.1. Market Share Analysis, 2023

        17.10.2. By Capacity

        17.10.3. By Product Type

        17.10.4. By Printing

        17.10.5. By End Users

    17.11. China

        17.11.1. Market Share Analysis, 2023

        17.11.2. By Capacity

        17.11.3. By Product Type

        17.11.4. By Printing

        17.11.5. By End Users

    17.12. Japan

        17.12.1. Market Share Analysis, 2023

        17.12.2. By Capacity

        17.12.3. By Product Type

        17.12.4. By Printing

        17.12.5. By End Users

    17.13. India

        17.13.1. Market Share Analysis, 2023

        17.13.2. By Capacity

        17.13.3. By Product Type

        17.13.4. By Printing

        17.13.5. By End Users

    17.14. GCC Countries

        17.14.1. Market Share Analysis, 2023

        17.14.2. By Capacity

        17.14.3. By Product Type

        17.14.4. By Printing

        17.14.5. By End Users

    17.15. Australia

        17.15.1. Market Share Analysis, 2023

        17.15.2. By Capacity

        17.15.3. By Product Type

        17.15.4. By Printing

        17.15.5. By End Users

18. Market Structure Analysis

    18.1. Competition Dashboard

    18.2. Competition Benchmarking

    18.3. Market Share Analysis of Top Players

        18.3.1. By Region

        18.3.2. By Product Portfolio

19. Competition Analysis

    19.1. Competition Deep Dive

        19.1.1.  Sonoco Products Company

            19.1.1.1. Overview

            19.1.1.2. Product Portfolio

            19.1.1.3. Profitability by Market Segments (Capacity/Product Type/Printing/End Users/Region)

            19.1.1.4. Sales Footprint

            19.1.1.5. Strategy Overview

                19.1.1.5.1. Marketing Strategy

                19.1.1.5.2. Product Strategy

                19.1.1.5.3. Channel Strategy

        19.1.2. Origin Pharma Packaging

            19.1.2.1. Overview

            19.1.2.2. Product Portfolio

            19.1.2.3. Profitability by Market Segments (Capacity/Product Type/Printing/End Users/Region)

            19.1.2.4. Sales Footprint

            19.1.2.5. Strategy Overview

                19.1.2.5.1. Marketing Strategy

                19.1.2.5.2. Product Strategy

                19.1.2.5.3. Channel Strategy

        19.1.3. Comar LLC

            19.1.3.1. Overview

            19.1.3.2. Product Portfolio

            19.1.3.3. Profitability by Market Segments (Capacity/Product Type/Printing/End Users/Region)

            19.1.3.4. Sales Footprint

            19.1.3.5. Strategy Overview

                19.1.3.5.1. Marketing Strategy

                19.1.3.5.2. Product Strategy

                19.1.3.5.3. Channel Strategy

        19.1.4. Adelphi Healthcare Packaging

            19.1.4.1. Overview

            19.1.4.2. Product Portfolio

            19.1.4.3. Profitability by Market Segments (Capacity/Product Type/Printing/End Users/Region)

            19.1.4.4. Sales Footprint

            19.1.4.5. Strategy Overview

                19.1.4.5.1. Marketing Strategy

                19.1.4.5.2. Product Strategy

                19.1.4.5.3. Channel Strategy

        19.1.5. SGH Healthcaring

            19.1.5.1. Overview

            19.1.5.2. Product Portfolio

            19.1.5.3. Profitability by Market Segments (Capacity/Product Type/Printing/End Users/Region)

            19.1.5.4. Sales Footprint

            19.1.5.5. Strategy Overview

                19.1.5.5.1. Marketing Strategy

                19.1.5.5.2. Product Strategy

                19.1.5.5.3. Channel Strategy

        19.1.6. Gerresheimer AG

            19.1.6.1. Overview

            19.1.6.2. Product Portfolio

            19.1.6.3. Profitability by Market Segments (Capacity/Product Type/Printing/End Users/Region)

            19.1.6.4. Sales Footprint

            19.1.6.5. Strategy Overview

                19.1.6.5.1. Marketing Strategy

                19.1.6.5.2. Product Strategy

                19.1.6.5.3. Channel Strategy

        19.1.7. Hammarplast Medical AB

            19.1.7.1. Overview

            19.1.7.2. Product Portfolio

            19.1.7.3. Profitability by Market Segments (Capacity/Product Type/Printing/End Users/Region)

            19.1.7.4. Sales Footprint

            19.1.7.5. Strategy Overview

                19.1.7.5.1. Marketing Strategy

                19.1.7.5.2. Product Strategy

                19.1.7.5.3. Channel Strategy

        19.1.8. Plastic Bubbles

            19.1.8.1. Overview

            19.1.8.2. Product Portfolio

            19.1.8.3. Profitability by Market Segments (Capacity/Product Type/Printing/End Users/Region)

            19.1.8.4. Sales Footprint

            19.1.8.5. Strategy Overview

                19.1.8.5.1. Marketing Strategy

                19.1.8.5.2. Product Strategy

                19.1.8.5.3. Channel Strategy

        19.1.9.  Hiwalt (Pty) Ltd

            19.1.9.1. Overview

            19.1.9.2. Product Portfolio

            19.1.9.3. Profitability by Market Segments (Capacity/Product Type/Printing/End Users/Region)

            19.1.9.4. Sales Footprint

            19.1.9.5. Strategy Overview

                19.1.9.5.1. Marketing Strategy

                19.1.9.5.2. Product Strategy

                19.1.9.5.3. Channel Strategy

        19.1.10. H&T Presspart Manufacturing Ltd.

            19.1.10.1. Overview

            19.1.10.2. Product Portfolio

            19.1.10.3. Profitability by Market Segments (Capacity/Product Type/Printing/End Users/Region)

            19.1.10.4. Sales Footprint

            19.1.10.5. Strategy Overview

                19.1.10.5.1. Marketing Strategy

                19.1.10.5.2. Product Strategy

                19.1.10.5.3. Channel Strategy

        19.1.11. LLC Farmmash

            19.1.11.1. Overview

            19.1.11.2. Product Portfolio

            19.1.11.3. Profitability by Market Segments (Capacity/Product Type/Printing/End Users/Region)

            19.1.11.4. Sales Footprint

            19.1.11.5. Strategy Overview

                19.1.11.5.1. Marketing Strategy

                19.1.11.5.2. Product Strategy

                19.1.11.5.3. Channel Strategy

        19.1.12. Phormpak SA

            19.1.12.1. Overview

            19.1.12.2. Product Portfolio

            19.1.12.3. Profitability by Market Segments (Capacity/Product Type/Printing/End Users/Region)

            19.1.12.4. Sales Footprint

            19.1.12.5. Strategy Overview

                19.1.12.5.1. Marketing Strategy

                19.1.12.5.2. Product Strategy

                19.1.12.5.3. Channel Strategy

        19.1.13. Techplas Aust Pty Ltd.

            19.1.13.1. Overview

            19.1.13.2. Product Portfolio

            19.1.13.3. Profitability by Market Segments (Capacity/Product Type/Printing/End Users/Region)

            19.1.13.4. Sales Footprint

            19.1.13.5. Strategy Overview

                19.1.13.5.1. Marketing Strategy

                19.1.13.5.2. Product Strategy

                19.1.13.5.3. Channel Strategy

        19.1.14. Parekhplast India Limited

            19.1.14.1. Overview

            19.1.14.2. Product Portfolio

            19.1.14.3. Profitability by Market Segments (Capacity/Product Type/Printing/End Users/Region)

            19.1.14.4. Sales Footprint

            19.1.14.5. Strategy Overview

                19.1.14.5.1. Marketing Strategy

                19.1.14.5.2. Product Strategy

                19.1.14.5.3. Channel Strategy

        19.1.15. UD Pharma Rubber Products

            19.1.15.1. Overview

            19.1.15.2. Product Portfolio

            19.1.15.3. Profitability by Market Segments (Capacity/Product Type/Printing/End Users/Region)

            19.1.15.4. Sales Footprint

            19.1.15.5. Strategy Overview

                19.1.15.5.1. Marketing Strategy

                19.1.15.5.2. Product Strategy

                19.1.15.5.3. Channel Strategy

20. Assumptions and Acronyms Used

21. Research Methodology
Recommendations

Packaging

Pharmaceutical Plastic Bottle Market

June 2021

REP-GB-7750

May 2024

420 pages

Packaging

Pharmaceutical Packaging Market

May 2021

REP-GB-6150

April 2024

304 pages

Packaging

Dosage Spoon Market

June 2019

REP-GB-9644

December 2022

199 pages

Packaging

Grab and Go Bottles Market

December 2021

REP-GB-10673

December 2022

315 pages

Explore Packaging Insights

View Reports