Reports

- Global Locations -

Headquarters

Future Market Insights, Inc.

Christiana Corporate, 200
Continental Drive, Suite 401,
Newark, Delaware - 19713,
United States

T: +1-845-579-5705

Americas

Future Market Insights, Inc.

616 Corporate Way, Suite 2-9018,
Valley Cottage, NY 10989, United States

T: +1-347-918-3531

MEA

Future Market Insights

1602-6 Jumeirah Bay X2 Tower, Plot No: JLT-PH2-X2A,
Jumeirah Lakes Towers, Dubai,
United Arab Emirates

Europe

Future Market Insights

3rd Floor, 207 Regent Street,
W1B 3HH London
United Kingdom

T: + 44 (0) 20 8123 9659
D: +44 (0) 20 3287 4268

Asia Pacific

Future Market Insights

IndiaLand Global Tech Park, Unit UG-1, Behind Grand HighStreet, Phase 1, Hinjawadi, MH, Pune – 411057, India

Edible Cups Market Outlook (2023 to 2033)

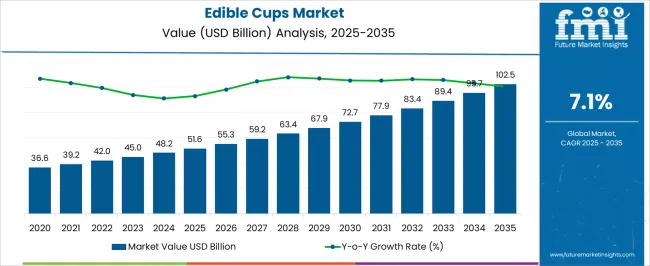
The edible cups market size is projected to be valued at US$ 45 million in 2023 and is expected to rise to US$ 89 million by 2033. The sales of edible cups are expected to record a significant CAGR of 7.1% during the forecast period.

In a world where sustainability and culinary creativity intersect, edible cups are emerging as the next big thing. These innovative cups are capturing the attention of food enthusiasts, environmentalists, and anyone seeking a delightful twist to their dining experience.

Key Trends Influencing the Edible Cups Market

  • Sustainable Solution: With growing concerns about plastic pollution and waste, edible cups offer an eco-friendly alternative. Made from edible materials, these cups eliminate the need for single-use plastic or paper cups, reducing environmental impact.
  • Culinary Versatility: Edible cups bring a whole new dimension to culinary creations. From sweet to savory, the possibilities are endless. Edible cups not only enhance the taste but also add an element of surprise and culinary ingenuity. Whether it's a social gathering, a family dinner, or a special occasion, edible cups become a focal point of conversation and fun. Guests can engage in the sensory delight of eating their cups, savoring the unique flavors and textures while sharing their experiences.
  • Customization and Personalization: Edible cups offer endless opportunities for customization and personalization. From selecting different flavors and ingredients to shaping them into unique designs, the possibilities are limited only by imagination.
  • Social Media Influence: In today's social media-driven world, edible cups offer a perfect backdrop for shareable moments. Their visual appeal and novelty factor make them generate buzz and excitement among food enthusiasts.
Attribute Details
Edible Cups Market Estimated Size (2023) US$ 45 million
Edible Cups Market CAGR (2023 to 2033) 7.1%
Edible Cups Market Forecasted Size (2033) US$ 89 million

Don't pay for what you don't need

Customize your report by selecting specific countries or regions and save 30%!

2018 to 2022 Edible Cups Market Outlook in Comparison to 2023 to 2033 Growth Forecast

Historically, the edible cups market has experienced a steady rise in sales. Initially, the concept of edible cups was relatively unknown, limiting their market penetration. However, with the increasing focus on sustainability and eco-friendly alternatives, the demand for edible cups gained momentum.

In the early years, sales were driven by niche markets, specialty cafes, and food enthusiasts who appreciated the novelty and sustainable aspects of edible cups. As awareness grew, edible cups began to make appearances at events, festivals, and eco-conscious gatherings, further expanding their consumer base.

The market is estimated to expand at 7.1% CAGR between 2023 and 2033, in comparison to the 3.8% CAGR registered from 2018 to 2022.

Looking ahead, the future demand outlook for the edible cups market is highly promising.

The adoption of edible cups by the food and beverage industry is set to expand significantly. Restaurants, cafes, and even large-scale events and festivals are recognizing the appeal and novelty of serving beverages and dishes in edible cups. As businesses strive to differentiate themselves and offer unique dining experiences, edible cups provide an opportunity to captivate customers and create memorable moments.

While the edible cups market has seen growth in various regions, there is still ample room for expansion into new markets. As awareness spreads and consumer demand increases, edible cups are likely to gain traction in emerging economies where sustainable practices and eco-consciousness are gaining momentum.

The above-mentioned factors are likely to assist the market to surpass the value of US$ 89.0 million by 2033.

To Scale their Businesses in the Edible Cups Market, Manufacturers and Service Providers can Adopt Several Strategies that Leverage Market Opportunities and Maximize Growth Potential

  • Expand Product Range: To cater to diverse consumer preferences, manufacturers can expand their product range by offering a variety of edible cup options. This includes different flavors, materials, sizes, and designs.
  • Enhance Production Efficiency: Increasing production efficiency is crucial for scaling operations. Manufacturers can invest in advanced machinery, automation, and optimized production processes to improve output, reduce costs, and meet growing demand.
  • Explore New Market Segments: While the food and beverage industry remains a primary market for edible cups, there are opportunities to explore other sectors. Manufacturers can target specific industries such as hospitality, catering, airlines, and even retail.
  • Invest in Marketing and Branding: A robust marketing and branding strategy is crucial for scaling in a competitive market. Businesses can invest in digital marketing campaigns, social media presence, and influencer partnerships to raise awareness and generate interest in their edible cups.
  • Foster Innovation and Research: Staying at the forefront of innovation is essential for long-term success. Manufacturers can invest in research and development to explore new edible cup materials, flavors, and production techniques.
  • Monitor Market Trends: Keeping a close eye on market trends, consumer preferences, and emerging technologies is crucial for scaling the edible cups market. Manufacturers and service providers should stay informed about changing customer demands, industry developments, and regulatory requirements.
Ismail Sutaria
Ismail Sutaria

Principal Consultant

Talk to Analyst

Find your sweet spots for generating winning opportunities in this market.

Comparative View of Edible Cups Market

Edible Cups Market:

Attributes Edible Cups Market
CAGR (2023 to 2033) 7.1%
Market Value (2033) US$ 89 million
Growth Factor Restaurants, cafes, and even large-scale events and festivals are recognizing the appeal and novelty of serving beverages and dishes in edible cups.
Opportunity As awareness spreads and consumer demand increases, edible cups are likely to gain traction in emerging economies where sustainable practices and eco-consciousness are gaining momentum
Key Trends Technological advancements in manufacturing procedures.

Bamboo Cups Market:

Attributes Bamboo Cups Market
CAGR (2023 to 2033) 14.7%
Market Value (2033) US$ 190 million
Growth Factor Growing e-commerce retailers due to rising urbanization
Opportunity Demand for sustainable solutions
Key Trends Rising trend of customization

PET Bottles Market:

Attributes PET Bottles Market
CAGR (2023 to 2033) 4.46%
Market Value (2033) US$ 49.63 billion
Growth Factor In order to compete in the market, manufacturers are also collaborating with recognized logistics and transportation companies to deliver goods on time.
Opportunity The manufacture of pet jars or pet bottles is one of the lucrative and effective manufacturing opportunities in the plastic and polymer business.
Key Trends The market outlook for PET bottles has improved as a result of technological developments.

Category-wise Insights of Edible Cups

Cold Beverages Registered a Significant Share of 52.5% in 2022 due to their Beneficial and Unique Characteristics

Cold beverages in edible cups offer a range of opportunities for businesses in the edible cups market. They provide a refreshing experience, offer novelty and visual appeal, and align with sustainability and eco-consciousness. They allow for customization and personalization is ideal for event catering and special occasions, and are well-suited for outdoor and on-the-go consumption. These factors make cold beverages in edible cups an attractive option for businesses looking to provide unique and engaging experiences for customers. While also demonstrating their commitment to sustainability.

Commercial End Users, such as the Food and Beverage Industry, have High Shares in the Edible Cups Market

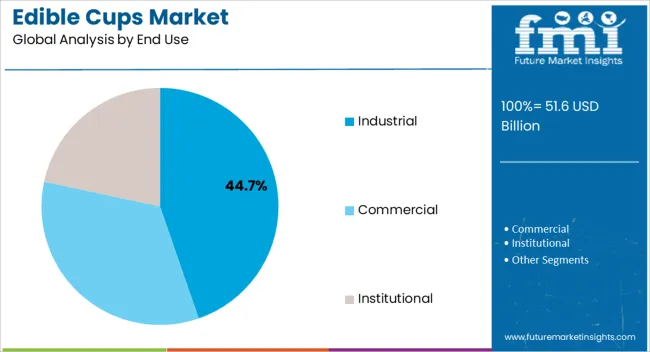
The commercial segment captured 75.8% of the market share in 2022. Commercial establishments, such as restaurants, cafes, and fast-food chains, serve a large volume of customers daily. As a result, they require a significant quantity of cups for their operations. Edible cups provide a practical and sustainable solution to meet the demand for serving beverages, desserts, and other food items, especially in high-traffic settings.

Edible cups have a high social media appeal. Customers often share their experiences and visually appealing food and beverages on social media platforms. Commercial end users leverage this trend by serving their offerings in edible cups, encouraging customers to take photos and share them online. This leads to free promotion and increased visibility, attracting new customers and generating buzz around their establishment.
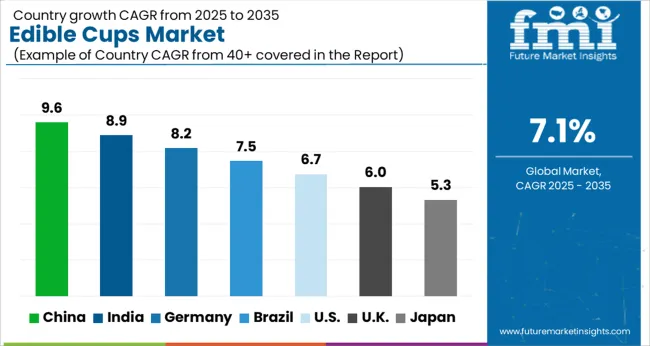
Get the data you need at a Fraction of the cost

Personalize your report by choosing insights you need
and save 40%!

Regional Analysis of Edible Cups Market

Increasing Need for Sustainable and Eco-friendly Packaging Options Influencing Europe in the Edible Cups Market

Europe is often regarded as a prominent market holding a market share of 23.5% in the edible cups market. Europe has a strong emphasis on sustainability and environmental consciousness. This focus has propelled the demand for eco-friendly alternatives to traditional single-use cups. Europe has a thriving food and beverage industry, comprising restaurants, cafes, and hospitality sectors. These establishments have been quick to embrace the concept of edible cups, integrating them into their menus and offering unique experiences to their customers.

European cultures place a significant emphasis on food and its presentation. Edible cups add a creative and visually appealing element to the dining experience, resonating with European consumers who appreciate unique and aesthetically pleasing food concepts.
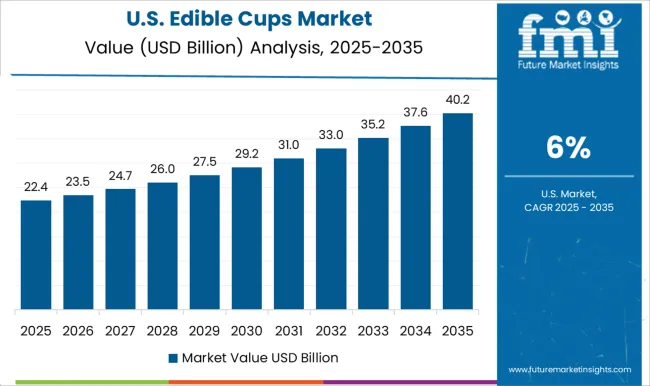
North America is a Profitable Market for Environmentally Friendly and Sustainable Products

United States conquered 13.0% of the global market share in 2022. The United States is known for its entrepreneurial spirit and focus on innovation. In the edible cups market, American manufacturers and startups have been at the forefront of developing new and creative edible cup options.

The United States has a strong social media culture, where visual appeal plays a significant role. Edible cups, with their vibrant colors and Instagram-worthy presentation, have gained popularity among social media-savvy consumers. The visually captivating nature of edible cups has contributed to their market success, as customers share their experiences online, driving further demand.

India Creates a Favorable Climate for Edible Cup Enterprises

India is showing all the signs of being a lucrative market with a growth rate of 8.0% during the analysis period. The food and beverage sector in India is rapidly expanding, owing to changing lifestyles, urbanization, and rising disposable incomes. The demand for inventive and one-of-a-kind dining experiences is increasing, creating an ideal market for edible cups.

To promote sustainable practices and reduce plastic waste, the Indian government has sponsored initiatives and campaigns. These initiatives, in conjunction with regulatory measures, encourage firms to investigate alternatives to standard single-use plastics.
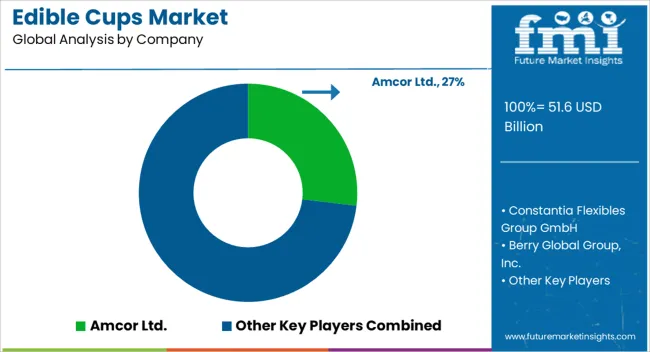
Well-established Manufacturers with a Strong Market Presence Play a Significant Role in the Industry

These companies have established production capabilities, extensive distribution networks, and brand recognition. They often offer a diverse range of edible cup options and enjoy customer loyalty due to their reputation and quality.

Loliware: Loliware is a leading company that specializes in creating edible cups and straws made from seaweed-based materials.

Bakeys: Bakeys is an Indian company that produces edible cutlery, including edible cups. Their products are made from natural ingredients like rice, wheat, and sorghum, offering a unique and eco-friendly alternative to traditional cups.

Cupffee: Cupffee is a Bulgarian company that manufactures edible cups made from natural grain ingredients.

Sweets by Milka: Sweets by Milka is a company that produces edible dessert cups. While primarily focused on dessert cups, they offer a range of options suitable for serving cold beverages.

Smart Planet: Smart Planet is a global brand that offers a range of innovative and eco-friendly products, including edible cups.

Overall, the competitive landscape in the edible cup market is diverse, with a range of companies offering different designs, features, and sustainability commitments. As the demand for eco-friendly and sustainable products continues to grow, new players are likely likely to enter the market. Moreover, existing companies continue to innovate and expand their product offerings.

Scope of the Report

Attribute Details
Growth Rate CAGR of 7.1% from 2023 to 2033
Base Year of Estimation 2023
Historical Data 2018 to 2022
Forecast Period 2023 to 2033
Quantitative Units Revenue in US$ million and Volume in Units and F-CAGR from 2023 to 2033
Report Coverage Revenue Forecast, Volume Forecast, Company Ranking, Competitive Landscape, growth factors, Trends, and Pricing Analysis
Key Segments Covered
  • By Material
  • By Capacity
  • By Application
  • By End Use
  • By Region
Regions Covered
  • North America
  • Latin America
  • Europe
  • East Asia
  • South Asia
  • The Middle East & Africa
  • Oceania
Key Countries Profiled
  • United States
  • Canada
  • Brazil
  • Mexico
  • Germany
  • Italy
  • France
  • United Kingdom
  • Spain
  • Russia
  • China
  • Japan
  • India
  • GCC Countries
  • Australia
Key Companies Profiled
  • Amcor Ltd.
  • Constantia Flexibles Group GmbH
  • Berry Global Group, Inc.
  • Huhtamäki Oyj
  • Sonoco Products Company
  • Bemis Company, Inc.
  • Sealed Air Corporation
  • AR Packaging Group AB
  • Mondi Group
  • DS Smith Plc
  • CCL Industries Inc.
Customization & Pricing Available upon Request

Key Segments Covered in the Edible Cups Market Report

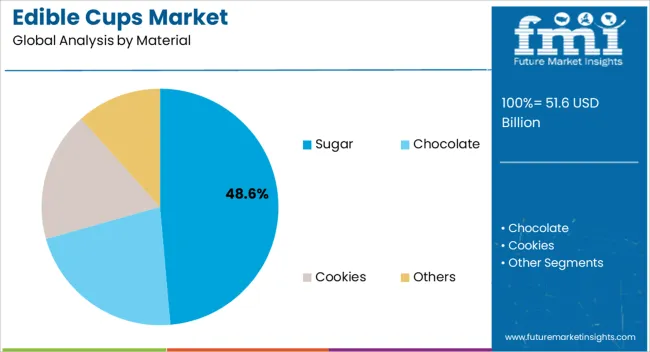
By Material:

  • Sugar
  • Chocolate
  • Cookies
  • Others

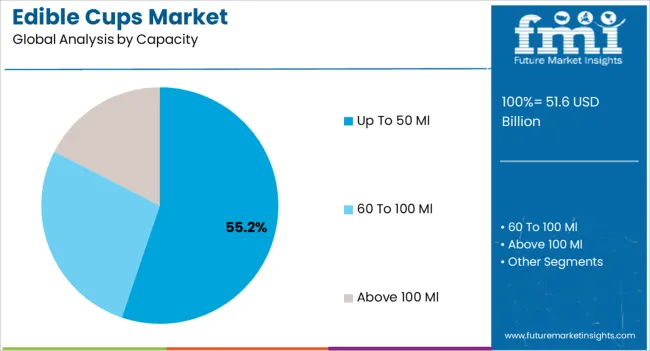
By Capacity:

  • Up to 50 ml
  • 60 to 100 ml
  • Above 100 ml

By End Use:

  • Industrial
  • Commercial
  • Institutional

By Region:

  • North America
  • Latin America
  • Western Europe
  • Eastern Europe
  • Asia Pacific Excluding Japan (APEJ)
  • Japan
  • The Middle East & Africa (MEA)

Frequently Asked Questions

How Big is the Edible Cups market?

The market is valued at US$ 45 million in 2023.

Who are the key Edible Cups Players?

Amcor Ltd., Constantia Flexibles Group GmbH and Berry Global Group, Inc. are key market players.

What is the growth forecast for Edible Cups Market?

The market is forecast to register a CAGR of 7.1% through 2033.

What is Europe’s expected share in 2023?

Europe is likely to generate 23.5% revenue.

Which is the top trend in the Edible Cups Market?

Growing social media influence is encouraging the edible cups adoption.

Table of Content

1. Executive Summary

    1.1. Global Market Outlook

    1.2. Demand-side Trends

    1.3. Supply-side Trends

    1.4. Technology Roadmap Analysis

    1.5. Analysis and Recommendations

2. Market Overview

    2.1. Market Coverage / Taxonomy

    2.2. Market Definition / Scope / Limitations

3. Market Background

    3.1. Market Dynamics

        3.1.1. Drivers

        3.1.2. Restraints

        3.1.3. Opportunity

        3.1.4. Trends

    3.2. Scenario Forecast

        3.2.1. Demand in Optimistic Scenario

        3.2.2. Demand in Likely Scenario

        3.2.3. Demand in Conservative Scenario

    3.3. Product launches & Recent Developments

    3.4. Product Life Cycle Analysis

    3.5. Value Chain Analysis

        3.5.1. Supply Side Participants and their Roles

            3.5.1.1. Producers

            3.5.1.2. Mid-Level Participants (Traders/ Agents/ Brokers)

            3.5.1.3. Wholesalers and Distributors

        3.5.2. % of Operating Margin Analysis

        3.5.3. List of Existing and Potential Buyer’s

    3.6. Pricing Analysis

        3.6.1. Price Point Assessment by Region

        3.6.2. Price Point Assessment by production

        3.6.3. Price Forecast till 2033

        3.6.4. Factors affecting pricing

    3.7. Forecast Factors - Relevance & Impact

    3.8. Regulatory Landscape

    3.9. Regional Parent Market Outlook

    3.10. Production and Consumption Statistics

    3.11. Consumers Survey Analysis

    3.12. Macro-Economic Factors

4. Global Analysis 2018 to 2022 and Forecast, 2023 to 2033

    4.1. Historical Market Size Value (US$ Million) & Volume (Tonnes) Analysis, 2018 to 2022

    4.2. Current and Future Market Size Value (US$ Million) & Volume (Tonnes) Projections, 2023 to 2033

        4.2.1. Y-o-Y Growth Trend Analysis

        4.2.2. Absolute $ Opportunity Analysis

5. Global Analysis 2018 to 2022 and Forecast 2023 to 2033, By Material

    5.1. Introduction / Key Findings

    5.2. Historical Market Size Value (US$ Million) & Volume (Tonnes) Analysis By Material, 2018 to 2022

    5.3. Current and Future Market Size Value (US$ Million) & Volume (Tonnes) Analysis and Forecast By Material, 2023 to 2033

        5.3.1. Sugar

        5.3.2. Chocolate

        5.3.3. Cookie

        5.3.4. Others (Rice, Seaweed, Edible Plant-based material, etc.)

    5.4. Y-o-Y Growth Trend Analysis By Material, 2018 to 2022

    5.5. Absolute $ Opportunity Analysis By Material, 2023 to 2033

6. Global Analysis 2018 to 2022 and Forecast 2023 to 2033, By Capacity

    6.1. Introduction / Key Findings

    6.2. Historical Market Size Value (US$ Million) & Volume (Tonnes) Analysis By Capacity, 2018 to 2022

    6.3. Current and Future Market Size Value (US$ Million) & Volume (Tonnes) Analysis and Forecast By Capacity, 2023 to 2033

        6.3.1. Up to 50 ml

        6.3.2. 60 to 100 ml

        6.3.3. Above 110 ml

    6.4. Y-o-Y Growth Trend Analysis By Capacity, 2018 to 2022

    6.5. Absolute $ Opportunity Analysis By Capacity, 2023 to 2033

7. Global Analysis 2018 to 2022 and Forecast 2023 to 2033, By Application

    7.1. Introduction / Key Findings

    7.2. Historical Market Size Value (US$ Million) & Volume (Tonnes) Analysis By Application , 2018 to 2022

    7.3. Current and Future Market Size Value (US$ Million) & Volume (Tonnes) Analysis and Forecast By Application , 2023 to 2033

        7.3.1. Hot Beverages

        7.3.2. Cold Beverages

        7.3.3. Desserts

    7.4. Y-o-Y Growth Trend Analysis By Application , 2018 to 2022

    7.5. Absolute $ Opportunity Analysis By Application , 2023 to 2033

8. Global Analysis 2018 to 2022 and Forecast 2023 to 2033, By End User

    8.1. Introduction / Key Findings

    8.2. Historical Market Size Value (US$ Million) & Volume (Tonnes) Analysis By End User, 2018 to 2022

    8.3. Current and Future Market Size Value (US$ Million) & Volume (Tonnes) Analysis and Forecast By End User, 2023 to 2033

        8.3.1. Household

        8.3.2. Commercial

    8.4. Y-o-Y Growth Trend Analysis By End User, 2018 to 2022

    8.5. Absolute $ Opportunity Analysis By End User, 2023 to 2033

9. Global Analysis 2018 to 2022 and Forecast 2023 to 2033, By Region

    9.1. Introduction

    9.2. Historical Market Size Value (US$ Million) & Volume (Tonnes) Analysis By Region, 2018 to 2022

    9.3. Current Market Size Value (US$ Million) & Volume (Tonnes) Analysis and Forecast By Region, 2023 to 2033

        9.3.1. North America

        9.3.2. Latin America

        9.3.3. Europe

        9.3.4. East Asia

        9.3.5. South Asia

        9.3.6. Oceania

        9.3.7. MEA

    9.4. Market Attractiveness Analysis By Region

10. North America Analysis 2018 to 2022 and Forecast 2023 to 2033, By Country

    10.1. Historical Market Size Value (US$ Million) & Volume (Tonnes) Trend Analysis By Market Taxonomy, 2018 to 2022

    10.2. Market Size Value (US$ Million) & Volume (Tonnes) Forecast By Market Taxonomy, 2023 to 2033

        10.2.1. By Country

            10.2.1.1. The USA

            10.2.1.2. Canada

        10.2.2. By Material

        10.2.3. By Capacity

        10.2.4. By Application

        10.2.5. By End User

    10.3. Market Attractiveness Analysis

        10.3.1. By Country

        10.3.2. By Material

        10.3.3. By Capacity

        10.3.4. By Application

        10.3.5. By End User

    10.4. Key Takeaways

11. Latin America Analysis 2018 to 2022 and Forecast 2023 to 2033, By Country

    11.1. Historical Market Size Value (US$ Million) & Volume (Tonnes) Trend Analysis By Market Taxonomy, 2018 to 2022

    11.2. Market Size Value (US$ Million) & Volume (Tonnes) Forecast By Market Taxonomy, 2023 to 2033

        11.2.1. By Country

            11.2.1.1. Brazil

            11.2.1.2. Mexico

            11.2.1.3. Argentina

            11.2.1.4. Chile

            11.2.1.5. Peru

            11.2.1.6. Rest of Latin America

        11.2.2. By Material

        11.2.3. By Capacity

        11.2.4. By Application

        11.2.5. By End User

    11.3. Market Attractiveness Analysis

        11.3.1. By Country

        11.3.2. By Material

        11.3.3. By Capacity

        11.3.4. By Application

        11.3.5. By End User

    11.4. Key Takeaways

12. Europe Analysis 2018 to 2022 and Forecast 2023 to 2033, By Country

    12.1. Historical Market Size Value (US$ Million) & Volume (Tonnes) Trend Analysis By Market Taxonomy, 2018 to 2022

    12.2. Market Size Value (US$ Million) & Volume (Tonnes) Forecast By Market Taxonomy, 2023 to 2033

        12.2.1. By Country

            12.2.1.1. Germany

            12.2.1.2. Italy

            12.2.1.3. France

            12.2.1.4. United Kingdom

            12.2.1.5. Spain

            12.2.1.6. Russia

            12.2.1.7. BENELUX

            12.2.1.8. Poland

            12.2.1.9. Nordic Countries

            12.2.1.10. Rest of Europe

        12.2.2. By Material

        12.2.3. By Capacity

        12.2.4. By Application

        12.2.5. By End User

    12.3. Market Attractiveness Analysis

        12.3.1. By Country

        12.3.2. By Material

        12.3.3. By Capacity

        12.3.4. By Application

        12.3.5. By End User

    12.4. Key Takeaways

13. East Asia Analysis 2018 to 2022 and Forecast 2023 to 2033, By Country

    13.1. Historical Market Size Value (US$ Million) & Volume (Tonnes) Trend Analysis By Market Taxonomy, 2018 to 2022

    13.2. Market Size Value (US$ Million) & Volume (Tonnes) Forecast By Market Taxonomy, 2023 to 2033

        13.2.1. By Country

            13.2.1.1. China

            13.2.1.2. Japan

            13.2.1.3. South Korea

        13.2.2. By Material

        13.2.3. By Capacity

        13.2.4. By Application

        13.2.5. By End User

    13.3. Market Attractiveness Analysis

        13.3.1. By Country

        13.3.2. By Material

        13.3.3. By Capacity

        13.3.4. By Application

        13.3.5. By End User

    13.4. Key Takeaways

14. South Asia Analysis 2018 to 2022 and Forecast 2023 to 2033, By Country

    14.1. Historical Market Size Value (US$ Million) & Volume (Tonnes) Trend Analysis By Market Taxonomy, 2018 to 2022

    14.2. Market Size Value (US$ Million) & Volume (Tonnes) Forecast By Market Taxonomy, 2023 to 2033

        14.2.1. By Country

            14.2.1.1. India

            14.2.1.2. Thailand

            14.2.1.3. Malaysia

            14.2.1.4. Indonesia

            14.2.1.5. Singapore

            14.2.1.6. Rest of South Asia

        14.2.2. By Material

        14.2.3. By Capacity

        14.2.4. By Application

        14.2.5. By End User

    14.3. Market Attractiveness Analysis

        14.3.1. By Country

        14.3.2. By Material

        14.3.3. By Capacity

        14.3.4. By Application

        14.3.5. By End User

    14.4. Key Takeaways

15. Oceania Analysis 2018 to 2022 and Forecast 2023 to 2033, By Country

    15.1. Historical Market Size Value (US$ Million) & Volume (Tonnes) Trend Analysis By Market Taxonomy, 2018 to 2022

    15.2. Market Size Value (US$ Million) & Volume (Tonnes) Forecast By Market Taxonomy, 2023 to 2033

        15.2.1. By Country

            15.2.1.1. Australia

            15.2.1.2. New Zealand

        15.2.2. By Material

        15.2.3. By Capacity

        15.2.4. By Application

        15.2.5. By End User

    15.3. Market Attractiveness Analysis

        15.3.1. By Country

        15.3.2. By Material

        15.3.3. By Capacity

        15.3.4. By Application

        15.3.5. By End User

    15.4. Key Takeaways

16. MEA Analysis 2018 to 2022 and Forecast 2023 to 2033, By Country

    16.1. Historical Market Size Value (US$ Million) & Volume (Tonnes) Trend Analysis By Market Taxonomy, 2018 to 2022

    16.2. Market Size Value (US$ Million) & Volume (Tonnes) Forecast By Market Taxonomy, 2023 to 2033

        16.2.1. By Country

            16.2.1.1. GCC Countries

            16.2.1.2. South Africa

            16.2.1.3. Central Africa

            16.2.1.4. North Africa

        16.2.2. By Material

        16.2.3. By Capacity

        16.2.4. By Application

        16.2.5. By End User

    16.3. Market Attractiveness Analysis

        16.3.1. By Country

        16.3.2. By Material

        16.3.3. By Capacity

        16.3.4. By Application

        16.3.5. By End User

    16.4. Key Takeaways

17. Key Countries Analysis

    17.1. USA

        17.1.1. Pricing Analysis

        17.1.2. Market Share Analysis, 2023

            17.1.2.1. By Material

            17.1.2.2. By Capacity

            17.1.2.3. By Application

            17.1.2.4. By End User

    17.2. Canada

        17.2.1. Pricing Analysis

        17.2.2. Market Share Analysis, 2023

            17.2.2.1. By Material

            17.2.2.2. By Capacity

            17.2.2.3. By Application

            17.2.2.4. By End User

    17.3. Brazil

        17.3.1. Pricing Analysis

        17.3.2. Market Share Analysis, 2023

            17.3.2.1. By Material

            17.3.2.2. By Capacity

            17.3.2.3. By Application

            17.3.2.4. By End User

    17.4. Mexico

        17.4.1. Pricing Analysis

        17.4.2. Market Share Analysis, 2023

            17.4.2.1. By Material

            17.4.2.2. By Capacity

            17.4.2.3. By Application

            17.4.2.4. By End User

    17.5. Argentina

        17.5.1. Pricing Analysis

        17.5.2. Market Share Analysis, 2023

            17.5.2.1. By Material

            17.5.2.2. By Capacity

            17.5.2.3. By Application

            17.5.2.4. By End User

    17.6. Chile

        17.6.1. Pricing Analysis

        17.6.2. Market Share Analysis, 2023

            17.6.2.1. By Material

            17.6.2.2. By Capacity

            17.6.2.3. By Application

            17.6.2.4. By End User

    17.7. Peru

        17.7.1. Pricing Analysis

        17.7.2. Market Share Analysis, 2023

            17.7.2.1. By Material

            17.7.2.2. By Capacity

            17.7.2.3. By Application

            17.7.2.4. By End User

    17.8. Germany

        17.8.1. Pricing Analysis

        17.8.2. Market Share Analysis, 2023

            17.8.2.1. By Material

            17.8.2.2. By Capacity

            17.8.2.3. By Application

            17.8.2.4. By End User

    17.9. Italy

        17.9.1. Pricing Analysis

        17.9.2. Market Share Analysis, 2023

            17.9.2.1. By Material

            17.9.2.2. By Capacity

            17.9.2.3. By Application

            17.9.2.4. By End User

    17.10. France

        17.10.1. Pricing Analysis

        17.10.2. Market Share Analysis, 2023

            17.10.2.1. By Material

            17.10.2.2. By Capacity

            17.10.2.3. By Application

            17.10.2.4. By End User

    17.11. Spain

        17.11.1. Pricing Analysis

        17.11.2. Market Share Analysis, 2023

            17.11.2.1. By Material

            17.11.2.2. By Capacity

            17.11.2.3. By Application

            17.11.2.4. By End User

    17.12. United Kingdom

        17.12.1. Pricing Analysis

        17.12.2. Market Share Analysis, 2023

            17.12.2.1. By Material

            17.12.2.2. By Capacity

            17.12.2.3. By Application

            17.12.2.4. By End User

    17.13. Russia

        17.13.1. Pricing Analysis

        17.13.2. Market Share Analysis, 2023

            17.13.2.1. By Material

            17.13.2.2. By Capacity

            17.13.2.3. By Application

            17.13.2.4. By End User

    17.14. Poland

        17.14.1. Pricing Analysis

        17.14.2. Market Share Analysis, 2023

            17.14.2.1. By Material

            17.14.2.2. By Capacity

            17.14.2.3. By Application

            17.14.2.4. By End User

    17.15. BENELUX

        17.15.1. Pricing Analysis

        17.15.2. Market Share Analysis, 2023

            17.15.2.1. By Material

            17.15.2.2. By Capacity

            17.15.2.3. By Application

            17.15.2.4. By End User

    17.16. Nordic Countries

        17.16.1. Pricing Analysis

        17.16.2. Market Share Analysis, 2023

            17.16.2.1. By Material

            17.16.2.2. By Capacity

            17.16.2.3. By Application

            17.16.2.4. By End User

    17.17. China

        17.17.1. Pricing Analysis

        17.17.2. Market Share Analysis, 2023

            17.17.2.1. By Material

            17.17.2.2. By Capacity

            17.17.2.3. By Application

            17.17.2.4. By End User

    17.18. Japan

        17.18.1. Pricing Analysis

        17.18.2. Market Share Analysis, 2023

            17.18.2.1. By Material

            17.18.2.2. By Capacity

            17.18.2.3. By Application

            17.18.2.4. By End User

    17.19. South Korea

        17.19.1. Pricing Analysis

        17.19.2. Market Share Analysis, 2023

            17.19.2.1. By Material

            17.19.2.2. By Capacity

            17.19.2.3. By Application

            17.19.2.4. By End User

    17.20. India

        17.20.1. Pricing Analysis

        17.20.2. Market Share Analysis, 2023

            17.20.2.1. By Material

            17.20.2.2. By Capacity

            17.20.2.3. By Application

            17.20.2.4. By End User

    17.21. Thailand

        17.21.1. Pricing Analysis

        17.21.2. Market Share Analysis, 2023

            17.21.2.1. By Material

            17.21.2.2. By Capacity

            17.21.2.3. By Application

            17.21.2.4. By End User

    17.22. Indonesia

        17.22.1. Pricing Analysis

        17.22.2. Market Share Analysis, 2023

            17.22.2.1. By Material

            17.22.2.2. By Capacity

            17.22.2.3. By Application

            17.22.2.4. By End User

    17.23. Malaysia

        17.23.1. Pricing Analysis

        17.23.2. Market Share Analysis, 2023

            17.23.2.1. By Material

            17.23.2.2. By Capacity

            17.23.2.3. By Application

            17.23.2.4. By End User

    17.24. Singapore

        17.24.1. Pricing Analysis

        17.24.2. Market Share Analysis, 2023

            17.24.2.1. By Material

            17.24.2.2. By Capacity

            17.24.2.3. By Application

            17.24.2.4. By End User

    17.25. Australia

        17.25.1. Pricing Analysis

        17.25.2. Market Share Analysis, 2023

            17.25.2.1. By Material

            17.25.2.2. By Capacity

            17.25.2.3. By Application

            17.25.2.4. By End User

    17.26. New Zealand

        17.26.1. Pricing Analysis

        17.26.2. Market Share Analysis, 2023

            17.26.2.1. By Material

            17.26.2.2. By Capacity

            17.26.2.3. By Application

            17.26.2.4. By End User

    17.27. GCC Countries

        17.27.1. Pricing Analysis

        17.27.2. Market Share Analysis, 2023

            17.27.2.1. By Material

            17.27.2.2. By Capacity

            17.27.2.3. By Application

            17.27.2.4. By End User

    17.28. South Africa

        17.28.1. Pricing Analysis

        17.28.2. Market Share Analysis, 2023

            17.28.2.1. By Material

            17.28.2.2. By Capacity

            17.28.2.3. By Application

            17.28.2.4. By End User

    17.29. North Africa

        17.29.1. Pricing Analysis

        17.29.2. Market Share Analysis, 2023

            17.29.2.1. By Material

            17.29.2.2. By Capacity

            17.29.2.3. By Application

            17.29.2.4. By End User

    17.30. Central Africa

        17.30.1. Pricing Analysis

        17.30.2. Market Share Analysis, 2023

            17.30.2.1. By Material

            17.30.2.2. By Capacity

            17.30.2.3. By Application

            17.30.2.4. By End User

18. Market Structure Analysis

    18.1. Competition Dashboard

    18.2. Competition Benchmarking

    18.3. Market Share Analysis of Top Players

        18.3.1. By Regional

        18.3.2. By Material

        18.3.3. By Capacity

        18.3.4. By Application

        18.3.5. By End User

19. Competition Analysis

    19.1. Competition Deep Dive

        19.1.1. Edco India

            19.1.1.1. Overview

            19.1.1.2. Product Portfolio

            19.1.1.3. Profitability by Market Segments (Product/Age /Sales Channel/Region)

            19.1.1.4. Sales Footprint

            19.1.1.5. Strategy Overview

                19.1.1.5.1. Marketing Strategy

                19.1.1.5.2. Product Strategy

                19.1.1.5.3. Channel Strategy

        19.1.2. Wayris

            19.1.2.1. Overview

            19.1.2.2. Product Portfolio

            19.1.2.3. Profitability by Market Segments (Product/Age /Sales Channel/Region)

            19.1.2.4. Sales Footprint

            19.1.2.5. Strategy Overview

                19.1.2.5.1. Marketing Strategy

                19.1.2.5.2. Product Strategy

                19.1.2.5.3. Channel Strategy

        19.1.3. Cupffee

            19.1.3.1. Overview

            19.1.3.2. Product Portfolio

            19.1.3.3. Profitability by Market Segments (Product/Age /Sales Channel/Region)

            19.1.3.4. Sales Footprint

            19.1.3.5. Strategy Overview

                19.1.3.5.1. Marketing Strategy

                19.1.3.5.2. Product Strategy

                19.1.3.5.3. Channel Strategy

        19.1.4. AmaiEarth

            19.1.4.1. Overview

            19.1.4.2. Product Portfolio

            19.1.4.3. Profitability by Market Segments (Product/Age /Sales Channel/Region)

            19.1.4.4. Sales Footprint

            19.1.4.5. Strategy Overview

                19.1.4.5.1. Marketing Strategy

                19.1.4.5.2. Product Strategy

                19.1.4.5.3. Channel Strategy

        19.1.5. Evoware

            19.1.5.1. Overview

            19.1.5.2. Product Portfolio

            19.1.5.3. Profitability by Market Segments (Product/Age /Sales Channel/Region)

            19.1.5.4. Sales Footprint

            19.1.5.5. Strategy Overview

                19.1.5.5.1. Marketing Strategy

                19.1.5.5.2. Product Strategy

                19.1.5.5.3. Channel Strategy

        19.1.6. Greenvent Technology

            19.1.6.1. Overview

            19.1.6.2. Product Portfolio

            19.1.6.3. Profitability by Market Segments (Product/Age /Sales Channel/Region)

            19.1.6.4. Sales Footprint

            19.1.6.5. Strategy Overview

                19.1.6.5.1. Marketing Strategy

                19.1.6.5.2. Product Strategy

                19.1.6.5.3. Channel Strategy

        19.1.7. Good Edi

            19.1.7.1. Overview

            19.1.7.2. Product Portfolio

            19.1.7.3. Profitability by Market Segments (Product/Age /Sales Channel/Region)

            19.1.7.4. Sales Footprint

            19.1.7.5. Strategy Overview

                19.1.7.5.1. Marketing Strategy

                19.1.7.5.2. Product Strategy

                19.1.7.5.3. Channel Strategy

        19.1.8. Edibles

            19.1.8.1. Overview

            19.1.8.2. Product Portfolio

            19.1.8.3. Profitability by Market Segments (Product/Age /Sales Channel/Region)

            19.1.8.4. Sales Footprint

            19.1.8.5. Strategy Overview

                19.1.8.5.1. Marketing Strategy

                19.1.8.5.2. Product Strategy

                19.1.8.5.3. Channel Strategy

        19.1.9. Stroodles

            19.1.9.1. Overview

            19.1.9.2. Product Portfolio

            19.1.9.3. Profitability by Market Segments (Product/Age /Sales Channel/Region)

            19.1.9.4. Sales Footprint

            19.1.9.5. Strategy Overview

                19.1.9.5.1. Marketing Strategy

                19.1.9.5.2. Product Strategy

                19.1.9.5.3. Channel Strategy

        19.1.10. Twiice

            19.1.10.1. Overview

            19.1.10.2. Product Portfolio

            19.1.10.3. Profitability by Market Segments (Product/Age /Sales Channel/Region)

            19.1.10.4. Sales Footprint

            19.1.10.5. Strategy Overview

                19.1.10.5.1. Marketing Strategy

                19.1.10.5.2. Product Strategy

                19.1.10.5.3. Channel Strategy

        19.1.11. Aitkens & Co Ltd

            19.1.11.1. Overview

            19.1.11.2. Product Portfolio

            19.1.11.3. Profitability by Market Segments (Product/Age /Sales Channel/Region)

            19.1.11.4. Sales Footprint

            19.1.11.5. Strategy Overview

                19.1.11.5.1. Marketing Strategy

                19.1.11.5.2. Product Strategy

                19.1.11.5.3. Channel Strategy

        19.1.12. Loliware

            19.1.12.1. Overview

            19.1.12.2. Product Portfolio

            19.1.12.3. Profitability by Market Segments (Product/Age /Sales Channel/Region)

            19.1.12.4. Sales Footprint

            19.1.12.5. Strategy Overview

                19.1.12.5.1. Marketing Strategy

                19.1.12.5.2. Product Strategy

                19.1.12.5.3. Channel Strategy

        19.1.13. Matt's Cones

            19.1.13.1. Overview

            19.1.13.2. Product Portfolio

            19.1.13.3. Profitability by Market Segments (Product/Age /Sales Channel/Region)

            19.1.13.4. Sales Footprint

            19.1.13.5. Strategy Overview

                19.1.13.5.1. Marketing Strategy

                19.1.13.5.2. Product Strategy

                19.1.13.5.3. Channel Strategy

20. Assumptions & Acronyms Used

21. Research Methodology

List of Tables

Table 1: Global Value (US$ Million) Forecast by Region, 2018 to 2033

Table 2: Global Volume (Tonnes) Forecast by Region, 2018 to 2033

Table 3: Global Value (US$ Million) Forecast by Material, 2018 to 2033

Table 4: Global Volume (Tonnes) Forecast by Material, 2018 to 2033

Table 5: Global Value (US$ Million) Forecast by Capacity, 2018 to 2033

Table 6: Global Volume (Tonnes) Forecast by Capacity, 2018 to 2033

Table 7: Global Value (US$ Million) Forecast by Application , 2018 to 2033

Table 8: Global Volume (Tonnes) Forecast by Application , 2018 to 2033

Table 9: Global Value (US$ Million) Forecast by End User, 2018 to 2033

Table 10: Global Volume (Tonnes) Forecast by End User, 2018 to 2033

Table 11: North America Value (US$ Million) Forecast by Country, 2018 to 2033

Table 12: North America Volume (Tonnes) Forecast by Country, 2018 to 2033

Table 13: North America Value (US$ Million) Forecast by Material, 2018 to 2033

Table 14: North America Volume (Tonnes) Forecast by Material, 2018 to 2033

Table 15: North America Value (US$ Million) Forecast by Capacity, 2018 to 2033

Table 16: North America Volume (Tonnes) Forecast by Capacity, 2018 to 2033

Table 17: North America Value (US$ Million) Forecast by Application , 2018 to 2033

Table 18: North America Volume (Tonnes) Forecast by Application , 2018 to 2033

Table 19: North America Value (US$ Million) Forecast by End User, 2018 to 2033

Table 20: North America Volume (Tonnes) Forecast by End User, 2018 to 2033

Table 21: Latin America Value (US$ Million) Forecast by Country, 2018 to 2033

Table 22: Latin America Volume (Tonnes) Forecast by Country, 2018 to 2033

Table 23: Latin America Value (US$ Million) Forecast by Material, 2018 to 2033

Table 24: Latin America Volume (Tonnes) Forecast by Material, 2018 to 2033

Table 25: Latin America Value (US$ Million) Forecast by Capacity, 2018 to 2033

Table 26: Latin America Volume (Tonnes) Forecast by Capacity, 2018 to 2033

Table 27: Latin America Value (US$ Million) Forecast by Application , 2018 to 2033

Table 28: Latin America Volume (Tonnes) Forecast by Application , 2018 to 2033

Table 29: Latin America Value (US$ Million) Forecast by End User, 2018 to 2033

Table 30: Latin America Volume (Tonnes) Forecast by End User, 2018 to 2033

Table 31: Europe Value (US$ Million) Forecast by Country, 2018 to 2033

Table 32: Europe Volume (Tonnes) Forecast by Country, 2018 to 2033

Table 33: Europe Value (US$ Million) Forecast by Material, 2018 to 2033

Table 34: Europe Volume (Tonnes) Forecast by Material, 2018 to 2033

Table 35: Europe Value (US$ Million) Forecast by Capacity, 2018 to 2033

Table 36: Europe Volume (Tonnes) Forecast by Capacity, 2018 to 2033

Table 37: Europe Value (US$ Million) Forecast by Application , 2018 to 2033

Table 38: Europe Volume (Tonnes) Forecast by Application , 2018 to 2033

Table 39: Europe Value (US$ Million) Forecast by End User, 2018 to 2033

Table 40: Europe Volume (Tonnes) Forecast by End User, 2018 to 2033

Table 41: East Asia Value (US$ Million) Forecast by Country, 2018 to 2033

Table 42: East Asia Volume (Tonnes) Forecast by Country, 2018 to 2033

Table 43: East Asia Value (US$ Million) Forecast by Material, 2018 to 2033

Table 44: East Asia Volume (Tonnes) Forecast by Material, 2018 to 2033

Table 45: East Asia Value (US$ Million) Forecast by Capacity, 2018 to 2033

Table 46: East Asia Volume (Tonnes) Forecast by Capacity, 2018 to 2033

Table 47: East Asia Value (US$ Million) Forecast by Application , 2018 to 2033

Table 48: East Asia Volume (Tonnes) Forecast by Application , 2018 to 2033

Table 49: East Asia Value (US$ Million) Forecast by End User, 2018 to 2033

Table 50: East Asia Volume (Tonnes) Forecast by End User, 2018 to 2033

Table 51: South Asia Value (US$ Million) Forecast by Country, 2018 to 2033

Table 52: South Asia Volume (Tonnes) Forecast by Country, 2018 to 2033

Table 53: South Asia Value (US$ Million) Forecast by Material, 2018 to 2033

Table 54: South Asia Volume (Tonnes) Forecast by Material, 2018 to 2033

Table 55: South Asia Value (US$ Million) Forecast by Capacity, 2018 to 2033

Table 56: South Asia Volume (Tonnes) Forecast by Capacity, 2018 to 2033

Table 57: South Asia Value (US$ Million) Forecast by Application , 2018 to 2033

Table 58: South Asia Volume (Tonnes) Forecast by Application , 2018 to 2033

Table 59: South Asia Value (US$ Million) Forecast by End User, 2018 to 2033

Table 60: South Asia Volume (Tonnes) Forecast by End User, 2018 to 2033

Table 61: Oceania Value (US$ Million) Forecast by Country, 2018 to 2033

Table 62: Oceania Volume (Tonnes) Forecast by Country, 2018 to 2033

Table 63: Oceania Value (US$ Million) Forecast by Material, 2018 to 2033

Table 64: Oceania Volume (Tonnes) Forecast by Material, 2018 to 2033

Table 65: Oceania Value (US$ Million) Forecast by Capacity, 2018 to 2033

Table 66: Oceania Volume (Tonnes) Forecast by Capacity, 2018 to 2033

Table 67: Oceania Value (US$ Million) Forecast by Application , 2018 to 2033

Table 68: Oceania Volume (Tonnes) Forecast by Application , 2018 to 2033

Table 69: Oceania Value (US$ Million) Forecast by End User, 2018 to 2033

Table 70: Oceania Volume (Tonnes) Forecast by End User, 2018 to 2033

Table 71: MEA Value (US$ Million) Forecast by Country, 2018 to 2033

Table 72: MEA Volume (Tonnes) Forecast by Country, 2018 to 2033

Table 73: MEA Value (US$ Million) Forecast by Material, 2018 to 2033

Table 74: MEA Volume (Tonnes) Forecast by Material, 2018 to 2033

Table 75: MEA Value (US$ Million) Forecast by Capacity, 2018 to 2033

Table 76: MEA Volume (Tonnes) Forecast by Capacity, 2018 to 2033

Table 77: MEA Value (US$ Million) Forecast by Application , 2018 to 2033

Table 78: MEA Volume (Tonnes) Forecast by Application , 2018 to 2033

Table 79: MEA Value (US$ Million) Forecast by End User, 2018 to 2033

Table 80: MEA Volume (Tonnes) Forecast by End User, 2018 to 2033

List of Charts

Figure 1: Global Value (US$ Million) by Material, 2023 to 2033

Figure 2: Global Value (US$ Million) by Capacity, 2023 to 2033

Figure 3: Global Value (US$ Million) by Application , 2023 to 2033

Figure 4: Global Value (US$ Million) by End User, 2023 to 2033

Figure 5: Global Value (US$ Million) by Region, 2023 to 2033

Figure 6: Global Value (US$ Million) Analysis by Region, 2018 to 2033

Figure 7: Global Volume (Tonnes) Analysis by Region, 2018 to 2033

Figure 8: Global Value Share (%) and BPS Analysis by Region, 2023 to 2033

Figure 9: Global Y-o-Y Growth (%) Projections by Region, 2023 to 2033

Figure 10: Global Value (US$ Million) Analysis by Material, 2018 to 2033

Figure 11: Global Volume (Tonnes) Analysis by Material, 2018 to 2033

Figure 12: Global Value Share (%) and BPS Analysis by Material, 2023 to 2033

Figure 13: Global Y-o-Y Growth (%) Projections by Material, 2023 to 2033

Figure 14: Global Value (US$ Million) Analysis by Capacity, 2018 to 2033

Figure 15: Global Volume (Tonnes) Analysis by Capacity, 2018 to 2033

Figure 16: Global Value Share (%) and BPS Analysis by Capacity, 2023 to 2033

Figure 17: Global Y-o-Y Growth (%) Projections by Capacity, 2023 to 2033

Figure 18: Global Value (US$ Million) Analysis by Application , 2018 to 2033

Figure 19: Global Volume (Tonnes) Analysis by Application , 2018 to 2033

Figure 20: Global Value Share (%) and BPS Analysis by Application , 2023 to 2033

Figure 21: Global Y-o-Y Growth (%) Projections by Application , 2023 to 2033

Figure 22: Global Value (US$ Million) Analysis by End User, 2018 to 2033

Figure 23: Global Volume (Tonnes) Analysis by End User, 2018 to 2033

Figure 24: Global Value Share (%) and BPS Analysis by End User, 2023 to 2033

Figure 25: Global Y-o-Y Growth (%) Projections by End User, 2023 to 2033

Figure 26: Global Attractiveness by Material, 2023 to 2033

Figure 27: Global Attractiveness by Capacity, 2023 to 2033

Figure 28: Global Attractiveness by Application , 2023 to 2033

Figure 29: Global Attractiveness by End User, 2023 to 2033

Figure 30: Global Attractiveness by Region, 2023 to 2033

Figure 31: North America Value (US$ Million) by Material, 2023 to 2033

Figure 32: North America Value (US$ Million) by Capacity, 2023 to 2033

Figure 33: North America Value (US$ Million) by Application , 2023 to 2033

Figure 34: North America Value (US$ Million) by End User, 2023 to 2033

Figure 35: North America Value (US$ Million) by Country, 2023 to 2033

Figure 36: North America Value (US$ Million) Analysis by Country, 2018 to 2033

Figure 37: North America Volume (Tonnes) Analysis by Country, 2018 to 2033

Figure 38: North America Value Share (%) and BPS Analysis by Country, 2023 to 2033

Figure 39: North America Y-o-Y Growth (%) Projections by Country, 2023 to 2033

Figure 40: North America Value (US$ Million) Analysis by Material, 2018 to 2033

Figure 41: North America Volume (Tonnes) Analysis by Material, 2018 to 2033

Figure 42: North America Value Share (%) and BPS Analysis by Material, 2023 to 2033

Figure 43: North America Y-o-Y Growth (%) Projections by Material, 2023 to 2033

Figure 44: North America Value (US$ Million) Analysis by Capacity, 2018 to 2033

Figure 45: North America Volume (Tonnes) Analysis by Capacity, 2018 to 2033

Figure 46: North America Value Share (%) and BPS Analysis by Capacity, 2023 to 2033

Figure 47: North America Y-o-Y Growth (%) Projections by Capacity, 2023 to 2033

Figure 48: North America Value (US$ Million) Analysis by Application , 2018 to 2033

Figure 49: North America Volume (Tonnes) Analysis by Application , 2018 to 2033

Figure 50: North America Value Share (%) and BPS Analysis by Application , 2023 to 2033

Figure 51: North America Y-o-Y Growth (%) Projections by Application , 2023 to 2033

Figure 52: North America Value (US$ Million) Analysis by End User, 2018 to 2033

Figure 53: North America Volume (Tonnes) Analysis by End User, 2018 to 2033

Figure 54: North America Value Share (%) and BPS Analysis by End User, 2023 to 2033

Figure 55: North America Y-o-Y Growth (%) Projections by End User, 2023 to 2033

Figure 56: North America Attractiveness by Material, 2023 to 2033

Figure 57: North America Attractiveness by Capacity, 2023 to 2033

Figure 58: North America Attractiveness by Application , 2023 to 2033

Figure 59: North America Attractiveness by End User, 2023 to 2033

Figure 60: North America Attractiveness by Country, 2023 to 2033

Figure 61: Latin America Value (US$ Million) by Material, 2023 to 2033

Figure 62: Latin America Value (US$ Million) by Capacity, 2023 to 2033

Figure 63: Latin America Value (US$ Million) by Application , 2023 to 2033

Figure 64: Latin America Value (US$ Million) by End User, 2023 to 2033

Figure 65: Latin America Value (US$ Million) by Country, 2023 to 2033

Figure 66: Latin America Value (US$ Million) Analysis by Country, 2018 to 2033

Figure 67: Latin America Volume (Tonnes) Analysis by Country, 2018 to 2033

Figure 68: Latin America Value Share (%) and BPS Analysis by Country, 2023 to 2033

Figure 69: Latin America Y-o-Y Growth (%) Projections by Country, 2023 to 2033

Figure 70: Latin America Value (US$ Million) Analysis by Material, 2018 to 2033

Figure 71: Latin America Volume (Tonnes) Analysis by Material, 2018 to 2033

Figure 72: Latin America Value Share (%) and BPS Analysis by Material, 2023 to 2033

Figure 73: Latin America Y-o-Y Growth (%) Projections by Material, 2023 to 2033

Figure 74: Latin America Value (US$ Million) Analysis by Capacity, 2018 to 2033

Figure 75: Latin America Volume (Tonnes) Analysis by Capacity, 2018 to 2033

Figure 76: Latin America Value Share (%) and BPS Analysis by Capacity, 2023 to 2033

Figure 77: Latin America Y-o-Y Growth (%) Projections by Capacity, 2023 to 2033

Figure 78: Latin America Value (US$ Million) Analysis by Application , 2018 to 2033

Figure 79: Latin America Volume (Tonnes) Analysis by Application , 2018 to 2033

Figure 80: Latin America Value Share (%) and BPS Analysis by Application , 2023 to 2033

Figure 81: Latin America Y-o-Y Growth (%) Projections by Application , 2023 to 2033

Figure 82: Latin America Value (US$ Million) Analysis by End User, 2018 to 2033

Figure 83: Latin America Volume (Tonnes) Analysis by End User, 2018 to 2033

Figure 84: Latin America Value Share (%) and BPS Analysis by End User, 2023 to 2033

Figure 85: Latin America Y-o-Y Growth (%) Projections by End User, 2023 to 2033

Figure 86: Latin America Attractiveness by Material, 2023 to 2033

Figure 87: Latin America Attractiveness by Capacity, 2023 to 2033

Figure 88: Latin America Attractiveness by Application , 2023 to 2033

Figure 89: Latin America Attractiveness by End User, 2023 to 2033

Figure 90: Latin America Attractiveness by Country, 2023 to 2033

Figure 91: Europe Value (US$ Million) by Material, 2023 to 2033

Figure 92: Europe Value (US$ Million) by Capacity, 2023 to 2033

Figure 93: Europe Value (US$ Million) by Application , 2023 to 2033

Figure 94: Europe Value (US$ Million) by End User, 2023 to 2033

Figure 95: Europe Value (US$ Million) by Country, 2023 to 2033

Figure 96: Europe Value (US$ Million) Analysis by Country, 2018 to 2033

Figure 97: Europe Volume (Tonnes) Analysis by Country, 2018 to 2033

Figure 98: Europe Value Share (%) and BPS Analysis by Country, 2023 to 2033

Figure 99: Europe Y-o-Y Growth (%) Projections by Country, 2023 to 2033

Figure 100: Europe Value (US$ Million) Analysis by Material, 2018 to 2033

Figure 101: Europe Volume (Tonnes) Analysis by Material, 2018 to 2033

Figure 102: Europe Value Share (%) and BPS Analysis by Material, 2023 to 2033

Figure 103: Europe Y-o-Y Growth (%) Projections by Material, 2023 to 2033

Figure 104: Europe Value (US$ Million) Analysis by Capacity, 2018 to 2033

Figure 105: Europe Volume (Tonnes) Analysis by Capacity, 2018 to 2033

Figure 106: Europe Value Share (%) and BPS Analysis by Capacity, 2023 to 2033

Figure 107: Europe Y-o-Y Growth (%) Projections by Capacity, 2023 to 2033

Figure 108: Europe Value (US$ Million) Analysis by Application , 2018 to 2033

Figure 109: Europe Volume (Tonnes) Analysis by Application , 2018 to 2033

Figure 110: Europe Value Share (%) and BPS Analysis by Application , 2023 to 2033

Figure 111: Europe Y-o-Y Growth (%) Projections by Application , 2023 to 2033

Figure 112: Europe Value (US$ Million) Analysis by End User, 2018 to 2033

Figure 113: Europe Volume (Tonnes) Analysis by End User, 2018 to 2033

Figure 114: Europe Value Share (%) and BPS Analysis by End User, 2023 to 2033

Figure 115: Europe Y-o-Y Growth (%) Projections by End User, 2023 to 2033

Figure 116: Europe Attractiveness by Material, 2023 to 2033

Figure 117: Europe Attractiveness by Capacity, 2023 to 2033

Figure 118: Europe Attractiveness by Application , 2023 to 2033

Figure 119: Europe Attractiveness by End User, 2023 to 2033

Figure 120: Europe Attractiveness by Country, 2023 to 2033

Figure 121: East Asia Value (US$ Million) by Material, 2023 to 2033

Figure 122: East Asia Value (US$ Million) by Capacity, 2023 to 2033

Figure 123: East Asia Value (US$ Million) by Application , 2023 to 2033

Figure 124: East Asia Value (US$ Million) by End User, 2023 to 2033

Figure 125: East Asia Value (US$ Million) by Country, 2023 to 2033

Figure 126: East Asia Value (US$ Million) Analysis by Country, 2018 to 2033

Figure 127: East Asia Volume (Tonnes) Analysis by Country, 2018 to 2033

Figure 128: East Asia Value Share (%) and BPS Analysis by Country, 2023 to 2033

Figure 129: East Asia Y-o-Y Growth (%) Projections by Country, 2023 to 2033

Figure 130: East Asia Value (US$ Million) Analysis by Material, 2018 to 2033

Figure 131: East Asia Volume (Tonnes) Analysis by Material, 2018 to 2033

Figure 132: East Asia Value Share (%) and BPS Analysis by Material, 2023 to 2033

Figure 133: East Asia Y-o-Y Growth (%) Projections by Material, 2023 to 2033

Figure 134: East Asia Value (US$ Million) Analysis by Capacity, 2018 to 2033

Figure 135: East Asia Volume (Tonnes) Analysis by Capacity, 2018 to 2033

Figure 136: East Asia Value Share (%) and BPS Analysis by Capacity, 2023 to 2033

Figure 137: East Asia Y-o-Y Growth (%) Projections by Capacity, 2023 to 2033

Figure 138: East Asia Value (US$ Million) Analysis by Application , 2018 to 2033

Figure 139: East Asia Volume (Tonnes) Analysis by Application , 2018 to 2033

Figure 140: East Asia Value Share (%) and BPS Analysis by Application , 2023 to 2033

Figure 141: East Asia Y-o-Y Growth (%) Projections by Application , 2023 to 2033

Figure 142: East Asia Value (US$ Million) Analysis by End User, 2018 to 2033

Figure 143: East Asia Volume (Tonnes) Analysis by End User, 2018 to 2033

Figure 144: East Asia Value Share (%) and BPS Analysis by End User, 2023 to 2033

Figure 145: East Asia Y-o-Y Growth (%) Projections by End User, 2023 to 2033

Figure 146: East Asia Attractiveness by Material, 2023 to 2033

Figure 147: East Asia Attractiveness by Capacity, 2023 to 2033

Figure 148: East Asia Attractiveness by Application , 2023 to 2033

Figure 149: East Asia Attractiveness by End User, 2023 to 2033

Figure 150: East Asia Attractiveness by Country, 2023 to 2033

Figure 151: South Asia Value (US$ Million) by Material, 2023 to 2033

Figure 152: South Asia Value (US$ Million) by Capacity, 2023 to 2033

Figure 153: South Asia Value (US$ Million) by Application , 2023 to 2033

Figure 154: South Asia Value (US$ Million) by End User, 2023 to 2033

Figure 155: South Asia Value (US$ Million) by Country, 2023 to 2033

Figure 156: South Asia Value (US$ Million) Analysis by Country, 2018 to 2033

Figure 157: South Asia Volume (Tonnes) Analysis by Country, 2018 to 2033

Figure 158: South Asia Value Share (%) and BPS Analysis by Country, 2023 to 2033

Figure 159: South Asia Y-o-Y Growth (%) Projections by Country, 2023 to 2033

Figure 160: South Asia Value (US$ Million) Analysis by Material, 2018 to 2033

Figure 161: South Asia Volume (Tonnes) Analysis by Material, 2018 to 2033

Figure 162: South Asia Value Share (%) and BPS Analysis by Material, 2023 to 2033

Figure 163: South Asia Y-o-Y Growth (%) Projections by Material, 2023 to 2033

Figure 164: South Asia Value (US$ Million) Analysis by Capacity, 2018 to 2033

Figure 165: South Asia Volume (Tonnes) Analysis by Capacity, 2018 to 2033

Figure 166: South Asia Value Share (%) and BPS Analysis by Capacity, 2023 to 2033

Figure 167: South Asia Y-o-Y Growth (%) Projections by Capacity, 2023 to 2033

Figure 168: South Asia Value (US$ Million) Analysis by Application , 2018 to 2033

Figure 169: South Asia Volume (Tonnes) Analysis by Application , 2018 to 2033

Figure 170: South Asia Value Share (%) and BPS Analysis by Application , 2023 to 2033

Figure 171: South Asia Y-o-Y Growth (%) Projections by Application , 2023 to 2033

Figure 172: South Asia Value (US$ Million) Analysis by End User, 2018 to 2033

Figure 173: South Asia Volume (Tonnes) Analysis by End User, 2018 to 2033

Figure 174: South Asia Value Share (%) and BPS Analysis by End User, 2023 to 2033

Figure 175: South Asia Y-o-Y Growth (%) Projections by End User, 2023 to 2033

Figure 176: South Asia Attractiveness by Material, 2023 to 2033

Figure 177: South Asia Attractiveness by Capacity, 2023 to 2033

Figure 178: South Asia Attractiveness by Application , 2023 to 2033

Figure 179: South Asia Attractiveness by End User, 2023 to 2033

Figure 180: South Asia Attractiveness by Country, 2023 to 2033

Figure 181: Oceania Value (US$ Million) by Material, 2023 to 2033

Figure 182: Oceania Value (US$ Million) by Capacity, 2023 to 2033

Figure 183: Oceania Value (US$ Million) by Application , 2023 to 2033

Figure 184: Oceania Value (US$ Million) by End User, 2023 to 2033

Figure 185: Oceania Value (US$ Million) by Country, 2023 to 2033

Figure 186: Oceania Value (US$ Million) Analysis by Country, 2018 to 2033

Figure 187: Oceania Volume (Tonnes) Analysis by Country, 2018 to 2033

Figure 188: Oceania Value Share (%) and BPS Analysis by Country, 2023 to 2033

Figure 189: Oceania Y-o-Y Growth (%) Projections by Country, 2023 to 2033

Figure 190: Oceania Value (US$ Million) Analysis by Material, 2018 to 2033

Figure 191: Oceania Volume (Tonnes) Analysis by Material, 2018 to 2033

Figure 192: Oceania Value Share (%) and BPS Analysis by Material, 2023 to 2033

Figure 193: Oceania Y-o-Y Growth (%) Projections by Material, 2023 to 2033

Figure 194: Oceania Value (US$ Million) Analysis by Capacity, 2018 to 2033

Figure 195: Oceania Volume (Tonnes) Analysis by Capacity, 2018 to 2033

Figure 196: Oceania Value Share (%) and BPS Analysis by Capacity, 2023 to 2033

Figure 197: Oceania Y-o-Y Growth (%) Projections by Capacity, 2023 to 2033

Figure 198: Oceania Value (US$ Million) Analysis by Application , 2018 to 2033

Figure 199: Oceania Volume (Tonnes) Analysis by Application , 2018 to 2033

Figure 200: Oceania Value Share (%) and BPS Analysis by Application , 2023 to 2033

Figure 201: Oceania Y-o-Y Growth (%) Projections by Application , 2023 to 2033

Figure 202: Oceania Value (US$ Million) Analysis by End User, 2018 to 2033

Figure 203: Oceania Volume (Tonnes) Analysis by End User, 2018 to 2033

Figure 204: Oceania Value Share (%) and BPS Analysis by End User, 2023 to 2033

Figure 205: Oceania Y-o-Y Growth (%) Projections by End User, 2023 to 2033

Figure 206: Oceania Attractiveness by Material, 2023 to 2033

Figure 207: Oceania Attractiveness by Capacity, 2023 to 2033

Figure 208: Oceania Attractiveness by Application , 2023 to 2033

Figure 209: Oceania Attractiveness by End User, 2023 to 2033

Figure 210: Oceania Attractiveness by Country, 2023 to 2033

Figure 211: MEA Value (US$ Million) by Material, 2023 to 2033

Figure 212: MEA Value (US$ Million) by Capacity, 2023 to 2033

Figure 213: MEA Value (US$ Million) by Application , 2023 to 2033

Figure 214: MEA Value (US$ Million) by End User, 2023 to 2033

Figure 215: MEA Value (US$ Million) by Country, 2023 to 2033

Figure 216: MEA Value (US$ Million) Analysis by Country, 2018 to 2033

Figure 217: MEA Volume (Tonnes) Analysis by Country, 2018 to 2033

Figure 218: MEA Value Share (%) and BPS Analysis by Country, 2023 to 2033

Figure 219: MEA Y-o-Y Growth (%) Projections by Country, 2023 to 2033

Figure 220: MEA Value (US$ Million) Analysis by Material, 2018 to 2033

Figure 221: MEA Volume (Tonnes) Analysis by Material, 2018 to 2033

Figure 222: MEA Value Share (%) and BPS Analysis by Material, 2023 to 2033

Figure 223: MEA Y-o-Y Growth (%) Projections by Material, 2023 to 2033

Figure 224: MEA Value (US$ Million) Analysis by Capacity, 2018 to 2033

Figure 225: MEA Volume (Tonnes) Analysis by Capacity, 2018 to 2033

Figure 226: MEA Value Share (%) and BPS Analysis by Capacity, 2023 to 2033

Figure 227: MEA Y-o-Y Growth (%) Projections by Capacity, 2023 to 2033

Figure 228: MEA Value (US$ Million) Analysis by Application , 2018 to 2033

Figure 229: MEA Volume (Tonnes) Analysis by Application , 2018 to 2033

Figure 230: MEA Value Share (%) and BPS Analysis by Application , 2023 to 2033

Figure 231: MEA Y-o-Y Growth (%) Projections by Application , 2023 to 2033

Figure 232: MEA Value (US$ Million) Analysis by End User, 2018 to 2033

Figure 233: MEA Volume (Tonnes) Analysis by End User, 2018 to 2033

Figure 234: MEA Value Share (%) and BPS Analysis by End User, 2023 to 2033

Figure 235: MEA Y-o-Y Growth (%) Projections by End User, 2023 to 2033

Figure 236: MEA Attractiveness by Material, 2023 to 2033

Figure 237: MEA Attractiveness by Capacity, 2023 to 2033

Figure 238: MEA Attractiveness by Application , 2023 to 2033

Figure 239: MEA Attractiveness by End User, 2023 to 2033

Figure 240: MEA Attractiveness by Country, 2023 to 2033

Recommendations

Packaging

Recyclable Cups Market

Published : September 2022

Explore Packaging Insights

View Reports