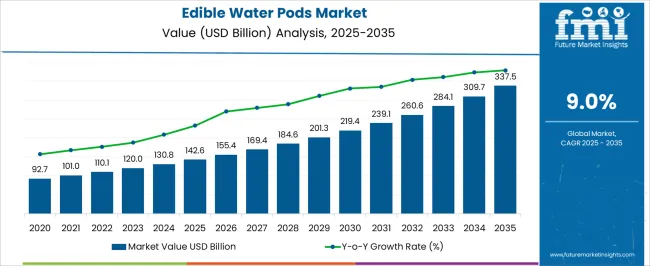
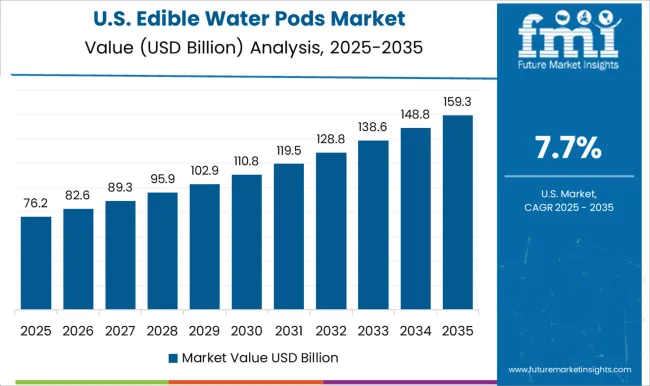
The Edible Water Pods Market size is projected to be worth USD 120 million in 2023. The market is likely to surpass USD 284 million by 2033 at a CAGR of 9% during the forecast period. Edible water pods, also known as water balls or water capsules, have gained popularity as an effective alternative to traditional plastic water bottles.
According to Plastic Oceans International, more than half of the world's plastic manufacturing, which totaled 335 million metric tonnes in 2017, was used for single-use purposes.
In today's world, where sustainability is becoming increasingly important, innovative alternatives to single-use plastic products are emerging. Edible water pods have quickly gained recognition as a promising solution, revolutionizing the way we hydrate. These small, encapsulated water servings offer convenience, environmental friendliness, and a refreshing hydration experience.
Drivers Propelling the Demand for Edible Water Pods Include:
Challenges for Companies /Manufacturers in the Market:
Opportunities in the Edible Water Pods Industry:
Trends in the Edible Water Pods Industry:
Attributes | Details |
---|---|
Edible Water Pods Market Size (2023) | USD 120 million |
Edible Water Pods Market Projected Size (2033) | USD 284 million |
Value CAGR (2023 to 2033) | 9.0% |
Historically, edible pods have showcased a significant increase in consumer interest and adoption. Edible pods, with their convenient and eco-friendly attributes, have gained popularity among consumers seeking alternative packaging options. The past demand trends indicate a growing consumer preference for edible pods as a sustainable and convenient way to consume various products.
The future sales outlook for the edible pods market is optimistic, driven by several factors.
The versatility of edible pods presents opportunities for expansion into different product categories. While edible water pods have gained significant traction, there is potential for edible pods to be used for other consumable products. Such as condiments, supplements, and personal care items. This diversification of product offerings is likely to contribute to the future sales growth of the edible pods market.
Collaborations and partnerships between edible pod manufacturers and food and beverage companies can open up new distribution channels and drive sales. Edible pods can be integrated into existing product lines or offered as complementary add-ons, increasing their accessibility to a broader consumer base.
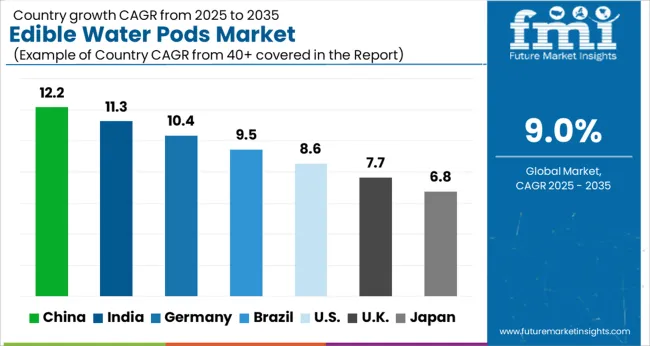
The market share of the United States in the edible water pods market is substantial. Reflecting the growing demand and adoption of these eco-friendly alternatives to traditional plastic bottles. The country's focus on environmental sustainability, coupled with consumer awareness and preference for sustainable products, has contributed to the strong presence and market share of edible water pods in the United States.
As a country known for its focus on sustainability and environmental consciousness, the United Kingdom has embraced innovative solutions like edible water pods to reduce plastic waste. The market share of the United Kingdom in the edible water pods market is notable, indicating the increasing demand and adoption of these eco-friendly alternatives. The British population's growing awareness of environmental issues has contributed to its strong presence. Moreover, their willingness to support sustainable products drives the market share of edible water pods in the United Kingdom.
China has recognized the necessity of sustainable alternatives due to its enormous population and growing concerns about plastic waste. China's market position in the edible water pods market indicates the country's growing desire for environmentally friendly packaging options.
Consumption of edible water pods is being driven by Chinese customers' active pursuit of innovative and sustainable products. Furthermore, the Chinese government's measures to enhance environmental protection and prevent plastic pollution have spurred the rise of the edible water pod industry in China.
The country's strong emphasis on sustainability and eco-friendly practices has contributed to the increasing demand for innovative packaging solutions like edible water pods. South Korean consumers are increasingly conscious of the environmental impact of single-use plastics, leading them to seek alternative options. As a result, the market share of South Korea in the edible water pods market has witnessed significant growth. The government's initiatives to promote sustainable practices and reduce plastic waste have further boosted the adoption of edible water pods in the country.
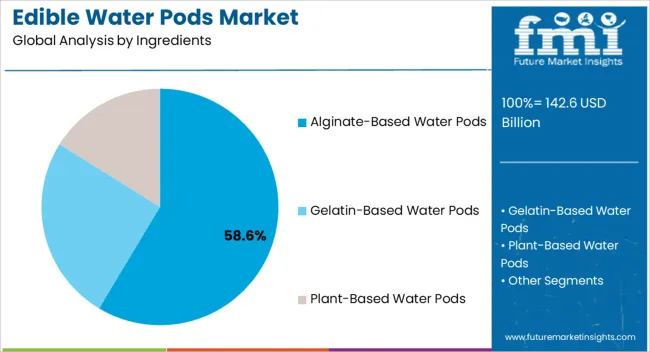
Alginate-based water pods are a popular choice due to their natural and sustainable properties. It offers a gel-like texture that can hold water and other liquids, making it an ideal ingredient for creating edible water pods. Alginate-based water pods are often biodegradable and can provide a convenient and eco-friendly alternative to traditional plastic water bottles. Additionally, seaweed extract is rich in minerals and nutrients, adding to the appeal of these edible water pods from a health perspective.
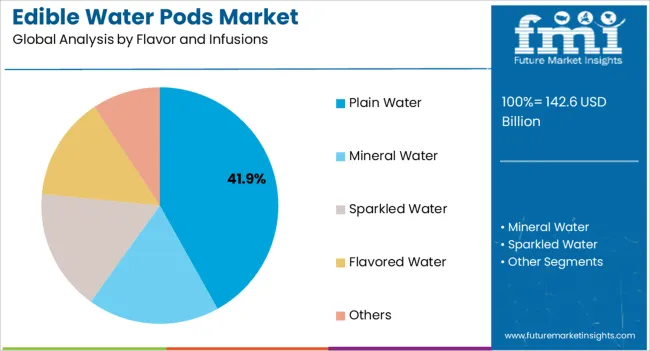
Citrus-flavored edible water pods are trending among consumer-base. The refreshing and tangy taste of citrus fruits, such as lemon, lime, and orange, makes them a popular choice for consumers. Citrus flavors are known for their invigorating and thirst-quenching properties, making them an excellent fit for edible water pods.
The bright and zesty flavor profile of citrus fruits adds a delightful twist to the drinking experience, making it more enjoyable and satisfying. Additionally, citrus fruits are often associated with freshness and vitality, which further enhances the appeal of flavored edible water pods.
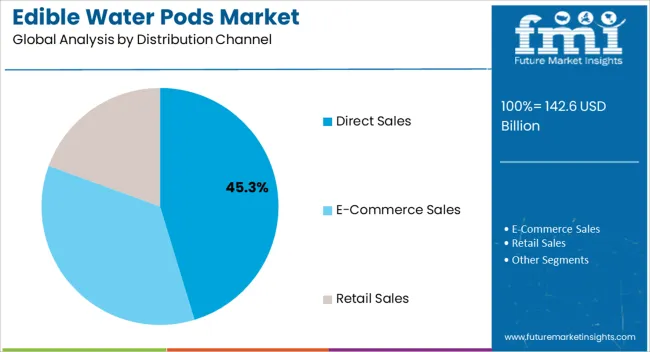
Retail stores, including supermarkets, convenience stores, and specialty beverage retailers, play a crucial role in making edible water pods easily accessible to consumers.
These distribution channels have established networks, widespread reach, and a strong customer base, allowing them to capture a significant portion of the market share. Retailers provide a convenient and reliable platform for consumers to discover, purchase, and replenish their edible water pods. With attractive product displays, promotional activities, and strategic positioning within the store, retail distribution channels effectively cater to the demands of consumers seeking innovative and sustainable beverage options like edible water pods.
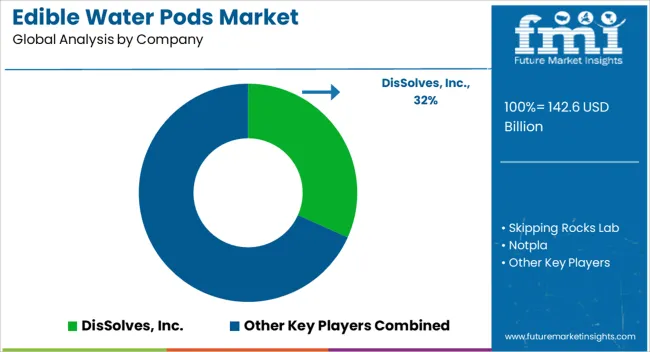
The competitive landscape in the market is characterized by several key players vying for market share. Moreover, striving to differentiate itself in terms of product offerings, innovation, and marketing strategies.
The market is relatively nascent but growing rapidly, attracting both established companies and emerging startups. Some prominent players in the market include:
Ooho: Ooho is a well-known brand that pioneered the concept of edible water pods. They have gained recognition for their innovative biodegradable and edible packaging made from seaweed extract.
Skipping Rocks Lab: Skipping Rocks Lab is another key player in the edible water pods market. They have developed edible packaging solutions, including their notable product, the Ooho edible water bottle.
Notpla: Notpla is a company dedicated to creating sustainable packaging solutions, including edible water pods. They use natural and biodegradable materials, such as seaweed, to produce their edible packaging.
BluCon BioTech: BluCon BioTech is an emerging player in the edible water pods market. They specialize in creating edible and biodegradable packaging solutions for beverages, including water pods.
Water Wand: The company offers edible water pods designed for on-the-go hydration. Their products are made from plant-based materials and are intended to be consumed along with water, eliminating the need for plastic bottles or cups.
Table 1: Global Value (US$ Million) Forecast by Region, 2018 to 2033
Table 2: Global Volume (Tonnes) Forecast by Region, 2018 to 2033
Table 3: Global Value (US$ Million) Forecast by Material, 2018 to 2033
Table 4: Global Volume (Tonnes) Forecast by Material, 2018 to 2033
Table 5: Global Value (US$ Million) Forecast by Packaging Type, 2018 to 2033
Table 6: Global Volume (Tonnes) Forecast by Packaging Type, 2018 to 2033
Table 7: Global Value (US$ Million) Forecast by Distribution Channel, 2018 to 2033
Table 8: Global Volume (Tonnes) Forecast by Distribution Channel, 2018 to 2033
Table 9: Global Value (US$ Million) Forecast by End User, 2018 to 2033
Table 10: Global Volume (Tonnes) Forecast by End User, 2018 to 2033
Table 11: North America Value (US$ Million) Forecast by Country, 2018 to 2033
Table 12: North America Volume (Tonnes) Forecast by Country, 2018 to 2033
Table 13: North America Value (US$ Million) Forecast by Material, 2018 to 2033
Table 14: North America Volume (Tonnes) Forecast by Material, 2018 to 2033
Table 15: North America Value (US$ Million) Forecast by Packaging Type, 2018 to 2033
Table 16: North America Volume (Tonnes) Forecast by Packaging Type, 2018 to 2033
Table 17: North America Value (US$ Million) Forecast by Distribution Channel, 2018 to 2033
Table 18: North America Volume (Tonnes) Forecast by Distribution Channel, 2018 to 2033
Table 19: North America Value (US$ Million) Forecast by End User, 2018 to 2033
Table 20: North America Volume (Tonnes) Forecast by End User, 2018 to 2033
Table 21: Latin America Value (US$ Million) Forecast by Country, 2018 to 2033
Table 22: Latin America Volume (Tonnes) Forecast by Country, 2018 to 2033
Table 23: Latin America Value (US$ Million) Forecast by Material, 2018 to 2033
Table 24: Latin America Volume (Tonnes) Forecast by Material, 2018 to 2033
Table 25: Latin America Value (US$ Million) Forecast by Packaging Type, 2018 to 2033
Table 26: Latin America Volume (Tonnes) Forecast by Packaging Type, 2018 to 2033
Table 27: Latin America Value (US$ Million) Forecast by Distribution Channel, 2018 to 2033
Table 28: Latin America Volume (Tonnes) Forecast by Distribution Channel, 2018 to 2033
Table 29: Latin America Value (US$ Million) Forecast by End User, 2018 to 2033
Table 30: Latin America Volume (Tonnes) Forecast by End User, 2018 to 2033
Table 31: Europe Value (US$ Million) Forecast by Country, 2018 to 2033
Table 32: Europe Volume (Tonnes) Forecast by Country, 2018 to 2033
Table 33: Europe Value (US$ Million) Forecast by Material, 2018 to 2033
Table 34: Europe Volume (Tonnes) Forecast by Material, 2018 to 2033
Table 35: Europe Value (US$ Million) Forecast by Packaging Type, 2018 to 2033
Table 36: Europe Volume (Tonnes) Forecast by Packaging Type, 2018 to 2033
Table 37: Europe Value (US$ Million) Forecast by Distribution Channel, 2018 to 2033
Table 38: Europe Volume (Tonnes) Forecast by Distribution Channel, 2018 to 2033
Table 39: Europe Value (US$ Million) Forecast by End User, 2018 to 2033
Table 40: Europe Volume (Tonnes) Forecast by End User, 2018 to 2033
Table 41: East Asia Value (US$ Million) Forecast by Country, 2018 to 2033
Table 42: East Asia Volume (Tonnes) Forecast by Country, 2018 to 2033
Table 43: East Asia Value (US$ Million) Forecast by Material, 2018 to 2033
Table 44: East Asia Volume (Tonnes) Forecast by Material, 2018 to 2033
Table 45: East Asia Value (US$ Million) Forecast by Packaging Type, 2018 to 2033
Table 46: East Asia Volume (Tonnes) Forecast by Packaging Type, 2018 to 2033
Table 47: East Asia Value (US$ Million) Forecast by Distribution Channel, 2018 to 2033
Table 48: East Asia Volume (Tonnes) Forecast by Distribution Channel, 2018 to 2033
Table 49: East Asia Value (US$ Million) Forecast by End User, 2018 to 2033
Table 50: East Asia Volume (Tonnes) Forecast by End User, 2018 to 2033
Table 51: South Asia Value (US$ Million) Forecast by Country, 2018 to 2033
Table 52: South Asia Volume (Tonnes) Forecast by Country, 2018 to 2033
Table 53: South Asia Value (US$ Million) Forecast by Material, 2018 to 2033
Table 54: South Asia Volume (Tonnes) Forecast by Material, 2018 to 2033
Table 55: South Asia Value (US$ Million) Forecast by Packaging Type, 2018 to 2033
Table 56: South Asia Volume (Tonnes) Forecast by Packaging Type, 2018 to 2033
Table 57: South Asia Value (US$ Million) Forecast by Distribution Channel, 2018 to 2033
Table 58: South Asia Volume (Tonnes) Forecast by Distribution Channel, 2018 to 2033
Table 59: South Asia Value (US$ Million) Forecast by End User, 2018 to 2033
Table 60: South Asia Volume (Tonnes) Forecast by End User, 2018 to 2033
Table 61: Oceania Value (US$ Million) Forecast by Country, 2018 to 2033
Table 62: Oceania Volume (Tonnes) Forecast by Country, 2018 to 2033
Table 63: Oceania Value (US$ Million) Forecast by Material, 2018 to 2033
Table 64: Oceania Volume (Tonnes) Forecast by Material, 2018 to 2033
Table 65: Oceania Value (US$ Million) Forecast by Packaging Type, 2018 to 2033
Table 66: Oceania Volume (Tonnes) Forecast by Packaging Type, 2018 to 2033
Table 67: Oceania Value (US$ Million) Forecast by Distribution Channel, 2018 to 2033
Table 68: Oceania Volume (Tonnes) Forecast by Distribution Channel, 2018 to 2033
Table 69: Oceania Value (US$ Million) Forecast by End User, 2018 to 2033
Table 70: Oceania Volume (Tonnes) Forecast by End User, 2018 to 2033
Table 71: MEA Value (US$ Million) Forecast by Country, 2018 to 2033
Table 72: MEA Volume (Tonnes) Forecast by Country, 2018 to 2033
Table 73: MEA Value (US$ Million) Forecast by Material, 2018 to 2033
Table 74: MEA Volume (Tonnes) Forecast by Material, 2018 to 2033
Table 75: MEA Value (US$ Million) Forecast by Packaging Type, 2018 to 2033
Table 76: MEA Volume (Tonnes) Forecast by Packaging Type, 2018 to 2033
Table 77: MEA Value (US$ Million) Forecast by Distribution Channel, 2018 to 2033
Table 78: MEA Volume (Tonnes) Forecast by Distribution Channel, 2018 to 2033
Table 79: MEA Value (US$ Million) Forecast by End User, 2018 to 2033
Table 80: MEA Volume (Tonnes) Forecast by End User, 2018 to 2033
Figure 1: Global Value (US$ Million) by Material, 2023 to 2033
Figure 2: Global Value (US$ Million) by Packaging Type, 2023 to 2033
Figure 3: Global Value (US$ Million) by Distribution Channel, 2023 to 2033
Figure 4: Global Value (US$ Million) by End User, 2023 to 2033
Figure 5: Global Value (US$ Million) by Region, 2023 to 2033
Figure 6: Global Value (US$ Million) Analysis by Region, 2018 to 2033
Figure 7: Global Volume (Tonnes) Analysis by Region, 2018 to 2033
Figure 8: Global Value Share (%) and BPS Analysis by Region, 2023 to 2033
Figure 9: Global Y-o-Y Growth (%) Projections by Region, 2023 to 2033
Figure 10: Global Value (US$ Million) Analysis by Material, 2018 to 2033
Figure 11: Global Volume (Tonnes) Analysis by Material, 2018 to 2033
Figure 12: Global Value Share (%) and BPS Analysis by Material, 2023 to 2033
Figure 13: Global Y-o-Y Growth (%) Projections by Material, 2023 to 2033
Figure 14: Global Value (US$ Million) Analysis by Packaging Type, 2018 to 2033
Figure 15: Global Volume (Tonnes) Analysis by Packaging Type, 2018 to 2033
Figure 16: Global Value Share (%) and BPS Analysis by Packaging Type, 2023 to 2033
Figure 17: Global Y-o-Y Growth (%) Projections by Packaging Type, 2023 to 2033
Figure 18: Global Value (US$ Million) Analysis by Distribution Channel, 2018 to 2033
Figure 19: Global Volume (Tonnes) Analysis by Distribution Channel, 2018 to 2033
Figure 20: Global Value Share (%) and BPS Analysis by Distribution Channel, 2023 to 2033
Figure 21: Global Y-o-Y Growth (%) Projections by Distribution Channel, 2023 to 2033
Figure 22: Global Value (US$ Million) Analysis by End User, 2018 to 2033
Figure 23: Global Volume (Tonnes) Analysis by End User, 2018 to 2033
Figure 24: Global Value Share (%) and BPS Analysis by End User, 2023 to 2033
Figure 25: Global Y-o-Y Growth (%) Projections by End User, 2023 to 2033
Figure 26: Global Attractiveness by Material, 2023 to 2033
Figure 27: Global Attractiveness by Packaging Type, 2023 to 2033
Figure 28: Global Attractiveness by Distribution Channel, 2023 to 2033
Figure 29: Global Attractiveness by End User, 2023 to 2033
Figure 30: Global Attractiveness by Region, 2023 to 2033
Figure 31: North America Value (US$ Million) by Material, 2023 to 2033
Figure 32: North America Value (US$ Million) by Packaging Type, 2023 to 2033
Figure 33: North America Value (US$ Million) by Distribution Channel, 2023 to 2033
Figure 34: North America Value (US$ Million) by End User, 2023 to 2033
Figure 35: North America Value (US$ Million) by Country, 2023 to 2033
Figure 36: North America Value (US$ Million) Analysis by Country, 2018 to 2033
Figure 37: North America Volume (Tonnes) Analysis by Country, 2018 to 2033
Figure 38: North America Value Share (%) and BPS Analysis by Country, 2023 to 2033
Figure 39: North America Y-o-Y Growth (%) Projections by Country, 2023 to 2033
Figure 40: North America Value (US$ Million) Analysis by Material, 2018 to 2033
Figure 41: North America Volume (Tonnes) Analysis by Material, 2018 to 2033
Figure 42: North America Value Share (%) and BPS Analysis by Material, 2023 to 2033
Figure 43: North America Y-o-Y Growth (%) Projections by Material, 2023 to 2033
Figure 44: North America Value (US$ Million) Analysis by Packaging Type, 2018 to 2033
Figure 45: North America Volume (Tonnes) Analysis by Packaging Type, 2018 to 2033
Figure 46: North America Value Share (%) and BPS Analysis by Packaging Type, 2023 to 2033
Figure 47: North America Y-o-Y Growth (%) Projections by Packaging Type, 2023 to 2033
Figure 48: North America Value (US$ Million) Analysis by Distribution Channel, 2018 to 2033
Figure 49: North America Volume (Tonnes) Analysis by Distribution Channel, 2018 to 2033
Figure 50: North America Value Share (%) and BPS Analysis by Distribution Channel, 2023 to 2033
Figure 51: North America Y-o-Y Growth (%) Projections by Distribution Channel, 2023 to 2033
Figure 52: North America Value (US$ Million) Analysis by End User, 2018 to 2033
Figure 53: North America Volume (Tonnes) Analysis by End User, 2018 to 2033
Figure 54: North America Value Share (%) and BPS Analysis by End User, 2023 to 2033
Figure 55: North America Y-o-Y Growth (%) Projections by End User, 2023 to 2033
Figure 56: North America Attractiveness by Material, 2023 to 2033
Figure 57: North America Attractiveness by Packaging Type, 2023 to 2033
Figure 58: North America Attractiveness by Distribution Channel, 2023 to 2033
Figure 59: North America Attractiveness by End User, 2023 to 2033
Figure 60: North America Attractiveness by Country, 2023 to 2033
Figure 61: Latin America Value (US$ Million) by Material, 2023 to 2033
Figure 62: Latin America Value (US$ Million) by Packaging Type, 2023 to 2033
Figure 63: Latin America Value (US$ Million) by Distribution Channel, 2023 to 2033
Figure 64: Latin America Value (US$ Million) by End User, 2023 to 2033
Figure 65: Latin America Value (US$ Million) by Country, 2023 to 2033
Figure 66: Latin America Value (US$ Million) Analysis by Country, 2018 to 2033
Figure 67: Latin America Volume (Tonnes) Analysis by Country, 2018 to 2033
Figure 68: Latin America Value Share (%) and BPS Analysis by Country, 2023 to 2033
Figure 69: Latin America Y-o-Y Growth (%) Projections by Country, 2023 to 2033
Figure 70: Latin America Value (US$ Million) Analysis by Material, 2018 to 2033
Figure 71: Latin America Volume (Tonnes) Analysis by Material, 2018 to 2033
Figure 72: Latin America Value Share (%) and BPS Analysis by Material, 2023 to 2033
Figure 73: Latin America Y-o-Y Growth (%) Projections by Material, 2023 to 2033
Figure 74: Latin America Value (US$ Million) Analysis by Packaging Type, 2018 to 2033
Figure 75: Latin America Volume (Tonnes) Analysis by Packaging Type, 2018 to 2033
Figure 76: Latin America Value Share (%) and BPS Analysis by Packaging Type, 2023 to 2033
Figure 77: Latin America Y-o-Y Growth (%) Projections by Packaging Type, 2023 to 2033
Figure 78: Latin America Value (US$ Million) Analysis by Distribution Channel, 2018 to 2033
Figure 79: Latin America Volume (Tonnes) Analysis by Distribution Channel, 2018 to 2033
Figure 80: Latin America Value Share (%) and BPS Analysis by Distribution Channel, 2023 to 2033
Figure 81: Latin America Y-o-Y Growth (%) Projections by Distribution Channel, 2023 to 2033
Figure 82: Latin America Value (US$ Million) Analysis by End User, 2018 to 2033
Figure 83: Latin America Volume (Tonnes) Analysis by End User, 2018 to 2033
Figure 84: Latin America Value Share (%) and BPS Analysis by End User, 2023 to 2033
Figure 85: Latin America Y-o-Y Growth (%) Projections by End User, 2023 to 2033
Figure 86: Latin America Attractiveness by Material, 2023 to 2033
Figure 87: Latin America Attractiveness by Packaging Type, 2023 to 2033
Figure 88: Latin America Attractiveness by Distribution Channel, 2023 to 2033
Figure 89: Latin America Attractiveness by End User, 2023 to 2033
Figure 90: Latin America Attractiveness by Country, 2023 to 2033
Figure 91: Europe Value (US$ Million) by Material, 2023 to 2033
Figure 92: Europe Value (US$ Million) by Packaging Type, 2023 to 2033
Figure 93: Europe Value (US$ Million) by Distribution Channel, 2023 to 2033
Figure 94: Europe Value (US$ Million) by End User, 2023 to 2033
Figure 95: Europe Value (US$ Million) by Country, 2023 to 2033
Figure 96: Europe Value (US$ Million) Analysis by Country, 2018 to 2033
Figure 97: Europe Volume (Tonnes) Analysis by Country, 2018 to 2033
Figure 98: Europe Value Share (%) and BPS Analysis by Country, 2023 to 2033
Figure 99: Europe Y-o-Y Growth (%) Projections by Country, 2023 to 2033
Figure 100: Europe Value (US$ Million) Analysis by Material, 2018 to 2033
Figure 101: Europe Volume (Tonnes) Analysis by Material, 2018 to 2033
Figure 102: Europe Value Share (%) and BPS Analysis by Material, 2023 to 2033
Figure 103: Europe Y-o-Y Growth (%) Projections by Material, 2023 to 2033
Figure 104: Europe Value (US$ Million) Analysis by Packaging Type, 2018 to 2033
Figure 105: Europe Volume (Tonnes) Analysis by Packaging Type, 2018 to 2033
Figure 106: Europe Value Share (%) and BPS Analysis by Packaging Type, 2023 to 2033
Figure 107: Europe Y-o-Y Growth (%) Projections by Packaging Type, 2023 to 2033
Figure 108: Europe Value (US$ Million) Analysis by Distribution Channel, 2018 to 2033
Figure 109: Europe Volume (Tonnes) Analysis by Distribution Channel, 2018 to 2033
Figure 110: Europe Value Share (%) and BPS Analysis by Distribution Channel, 2023 to 2033
Figure 111: Europe Y-o-Y Growth (%) Projections by Distribution Channel, 2023 to 2033
Figure 112: Europe Value (US$ Million) Analysis by End User, 2018 to 2033
Figure 113: Europe Volume (Tonnes) Analysis by End User, 2018 to 2033
Figure 114: Europe Value Share (%) and BPS Analysis by End User, 2023 to 2033
Figure 115: Europe Y-o-Y Growth (%) Projections by End User, 2023 to 2033
Figure 116: Europe Attractiveness by Material, 2023 to 2033
Figure 117: Europe Attractiveness by Packaging Type, 2023 to 2033
Figure 118: Europe Attractiveness by Distribution Channel, 2023 to 2033
Figure 119: Europe Attractiveness by End User, 2023 to 2033
Figure 120: Europe Attractiveness by Country, 2023 to 2033
Figure 121: East Asia Value (US$ Million) by Material, 2023 to 2033
Figure 122: East Asia Value (US$ Million) by Packaging Type, 2023 to 2033
Figure 123: East Asia Value (US$ Million) by Distribution Channel, 2023 to 2033
Figure 124: East Asia Value (US$ Million) by End User, 2023 to 2033
Figure 125: East Asia Value (US$ Million) by Country, 2023 to 2033
Figure 126: East Asia Value (US$ Million) Analysis by Country, 2018 to 2033
Figure 127: East Asia Volume (Tonnes) Analysis by Country, 2018 to 2033
Figure 128: East Asia Value Share (%) and BPS Analysis by Country, 2023 to 2033
Figure 129: East Asia Y-o-Y Growth (%) Projections by Country, 2023 to 2033
Figure 130: East Asia Value (US$ Million) Analysis by Material, 2018 to 2033
Figure 131: East Asia Volume (Tonnes) Analysis by Material, 2018 to 2033
Figure 132: East Asia Value Share (%) and BPS Analysis by Material, 2023 to 2033
Figure 133: East Asia Y-o-Y Growth (%) Projections by Material, 2023 to 2033
Figure 134: East Asia Value (US$ Million) Analysis by Packaging Type, 2018 to 2033
Figure 135: East Asia Volume (Tonnes) Analysis by Packaging Type, 2018 to 2033
Figure 136: East Asia Value Share (%) and BPS Analysis by Packaging Type, 2023 to 2033
Figure 137: East Asia Y-o-Y Growth (%) Projections by Packaging Type, 2023 to 2033
Figure 138: East Asia Value (US$ Million) Analysis by Distribution Channel, 2018 to 2033
Figure 139: East Asia Volume (Tonnes) Analysis by Distribution Channel, 2018 to 2033
Figure 140: East Asia Value Share (%) and BPS Analysis by Distribution Channel, 2023 to 2033
Figure 141: East Asia Y-o-Y Growth (%) Projections by Distribution Channel, 2023 to 2033
Figure 142: East Asia Value (US$ Million) Analysis by End User, 2018 to 2033
Figure 143: East Asia Volume (Tonnes) Analysis by End User, 2018 to 2033
Figure 144: East Asia Value Share (%) and BPS Analysis by End User, 2023 to 2033
Figure 145: East Asia Y-o-Y Growth (%) Projections by End User, 2023 to 2033
Figure 146: East Asia Attractiveness by Material, 2023 to 2033
Figure 147: East Asia Attractiveness by Packaging Type, 2023 to 2033
Figure 148: East Asia Attractiveness by Distribution Channel, 2023 to 2033
Figure 149: East Asia Attractiveness by End User, 2023 to 2033
Figure 150: East Asia Attractiveness by Country, 2023 to 2033
Figure 151: South Asia Value (US$ Million) by Material, 2023 to 2033
Figure 152: South Asia Value (US$ Million) by Packaging Type, 2023 to 2033
Figure 153: South Asia Value (US$ Million) by Distribution Channel, 2023 to 2033
Figure 154: South Asia Value (US$ Million) by End User, 2023 to 2033
Figure 155: South Asia Value (US$ Million) by Country, 2023 to 2033
Figure 156: South Asia Value (US$ Million) Analysis by Country, 2018 to 2033
Figure 157: South Asia Volume (Tonnes) Analysis by Country, 2018 to 2033
Figure 158: South Asia Value Share (%) and BPS Analysis by Country, 2023 to 2033
Figure 159: South Asia Y-o-Y Growth (%) Projections by Country, 2023 to 2033
Figure 160: South Asia Value (US$ Million) Analysis by Material, 2018 to 2033
Figure 161: South Asia Volume (Tonnes) Analysis by Material, 2018 to 2033
Figure 162: South Asia Value Share (%) and BPS Analysis by Material, 2023 to 2033
Figure 163: South Asia Y-o-Y Growth (%) Projections by Material, 2023 to 2033
Figure 164: South Asia Value (US$ Million) Analysis by Packaging Type, 2018 to 2033
Figure 165: South Asia Volume (Tonnes) Analysis by Packaging Type, 2018 to 2033
Figure 166: South Asia Value Share (%) and BPS Analysis by Packaging Type, 2023 to 2033
Figure 167: South Asia Y-o-Y Growth (%) Projections by Packaging Type, 2023 to 2033
Figure 168: South Asia Value (US$ Million) Analysis by Distribution Channel, 2018 to 2033
Figure 169: South Asia Volume (Tonnes) Analysis by Distribution Channel, 2018 to 2033
Figure 170: South Asia Value Share (%) and BPS Analysis by Distribution Channel, 2023 to 2033
Figure 171: South Asia Y-o-Y Growth (%) Projections by Distribution Channel, 2023 to 2033
Figure 172: South Asia Value (US$ Million) Analysis by End User, 2018 to 2033
Figure 173: South Asia Volume (Tonnes) Analysis by End User, 2018 to 2033
Figure 174: South Asia Value Share (%) and BPS Analysis by End User, 2023 to 2033
Figure 175: South Asia Y-o-Y Growth (%) Projections by End User, 2023 to 2033
Figure 176: South Asia Attractiveness by Material, 2023 to 2033
Figure 177: South Asia Attractiveness by Packaging Type, 2023 to 2033
Figure 178: South Asia Attractiveness by Distribution Channel, 2023 to 2033
Figure 179: South Asia Attractiveness by End User, 2023 to 2033
Figure 180: South Asia Attractiveness by Country, 2023 to 2033
Figure 181: Oceania Value (US$ Million) by Material, 2023 to 2033
Figure 182: Oceania Value (US$ Million) by Packaging Type, 2023 to 2033
Figure 183: Oceania Value (US$ Million) by Distribution Channel, 2023 to 2033
Figure 184: Oceania Value (US$ Million) by End User, 2023 to 2033
Figure 185: Oceania Value (US$ Million) by Country, 2023 to 2033
Figure 186: Oceania Value (US$ Million) Analysis by Country, 2018 to 2033
Figure 187: Oceania Volume (Tonnes) Analysis by Country, 2018 to 2033
Figure 188: Oceania Value Share (%) and BPS Analysis by Country, 2023 to 2033
Figure 189: Oceania Y-o-Y Growth (%) Projections by Country, 2023 to 2033
Figure 190: Oceania Value (US$ Million) Analysis by Material, 2018 to 2033
Figure 191: Oceania Volume (Tonnes) Analysis by Material, 2018 to 2033
Figure 192: Oceania Value Share (%) and BPS Analysis by Material, 2023 to 2033
Figure 193: Oceania Y-o-Y Growth (%) Projections by Material, 2023 to 2033
Figure 194: Oceania Value (US$ Million) Analysis by Packaging Type, 2018 to 2033
Figure 195: Oceania Volume (Tonnes) Analysis by Packaging Type, 2018 to 2033
Figure 196: Oceania Value Share (%) and BPS Analysis by Packaging Type, 2023 to 2033
Figure 197: Oceania Y-o-Y Growth (%) Projections by Packaging Type, 2023 to 2033
Figure 198: Oceania Value (US$ Million) Analysis by Distribution Channel, 2018 to 2033
Figure 199: Oceania Volume (Tonnes) Analysis by Distribution Channel, 2018 to 2033
Figure 200: Oceania Value Share (%) and BPS Analysis by Distribution Channel, 2023 to 2033
Figure 201: Oceania Y-o-Y Growth (%) Projections by Distribution Channel, 2023 to 2033
Figure 202: Oceania Value (US$ Million) Analysis by End User, 2018 to 2033
Figure 203: Oceania Volume (Tonnes) Analysis by End User, 2018 to 2033
Figure 204: Oceania Value Share (%) and BPS Analysis by End User, 2023 to 2033
Figure 205: Oceania Y-o-Y Growth (%) Projections by End User, 2023 to 2033
Figure 206: Oceania Attractiveness by Material, 2023 to 2033
Figure 207: Oceania Attractiveness by Packaging Type, 2023 to 2033
Figure 208: Oceania Attractiveness by Distribution Channel, 2023 to 2033
Figure 209: Oceania Attractiveness by End User, 2023 to 2033
Figure 210: Oceania Attractiveness by Country, 2023 to 2033
Figure 211: MEA Value (US$ Million) by Material, 2023 to 2033
Figure 212: MEA Value (US$ Million) by Packaging Type, 2023 to 2033
Figure 213: MEA Value (US$ Million) by Distribution Channel, 2023 to 2033
Figure 214: MEA Value (US$ Million) by End User, 2023 to 2033
Figure 215: MEA Value (US$ Million) by Country, 2023 to 2033
Figure 216: MEA Value (US$ Million) Analysis by Country, 2018 to 2033
Figure 217: MEA Volume (Tonnes) Analysis by Country, 2018 to 2033
Figure 218: MEA Value Share (%) and BPS Analysis by Country, 2023 to 2033
Figure 219: MEA Y-o-Y Growth (%) Projections by Country, 2023 to 2033
Figure 220: MEA Value (US$ Million) Analysis by Material, 2018 to 2033
Figure 221: MEA Volume (Tonnes) Analysis by Material, 2018 to 2033
Figure 222: MEA Value Share (%) and BPS Analysis by Material, 2023 to 2033
Figure 223: MEA Y-o-Y Growth (%) Projections by Material, 2023 to 2033
Figure 224: MEA Value (US$ Million) Analysis by Packaging Type, 2018 to 2033
Figure 225: MEA Volume (Tonnes) Analysis by Packaging Type, 2018 to 2033
Figure 226: MEA Value Share (%) and BPS Analysis by Packaging Type, 2023 to 2033
Figure 227: MEA Y-o-Y Growth (%) Projections by Packaging Type, 2023 to 2033
Figure 228: MEA Value (US$ Million) Analysis by Distribution Channel, 2018 to 2033
Figure 229: MEA Volume (Tonnes) Analysis by Distribution Channel, 2018 to 2033
Figure 230: MEA Value Share (%) and BPS Analysis by Distribution Channel, 2023 to 2033
Figure 231: MEA Y-o-Y Growth (%) Projections by Distribution Channel, 2023 to 2033
Figure 232: MEA Value (US$ Million) Analysis by End User, 2018 to 2033
Figure 233: MEA Volume (Tonnes) Analysis by End User, 2018 to 2033
Figure 234: MEA Value Share (%) and BPS Analysis by End User, 2023 to 2033
Figure 235: MEA Y-o-Y Growth (%) Projections by End User, 2023 to 2033
Figure 236: MEA Attractiveness by Material, 2023 to 2033
Figure 237: MEA Attractiveness by Packaging Type, 2023 to 2033
Figure 238: MEA Attractiveness by Distribution Channel, 2023 to 2033
Figure 239: MEA Attractiveness by End User, 2023 to 2033
Figure 240: MEA Attractiveness by Country, 2023 to 2033
The market is estimated to secure a valuation of USD 120 million in 2023.
The global market size to reach USD 284 million by 2033.
Growing emphasis on expanding flavor options and personalization is a growing trend.
Ensuring consistent quality and production scalability and building awareness and acceptance can be a challenge.
Ooho, Notpla, and Water Wand are the key players.
Explore Similar Insights
Thank you!
You will receive an email from our Business Development Manager. Please be sure to check your SPAM/JUNK folder too.