Edible Seaweed Market Size, Share, and Forecast Outlook 2025 to 2035

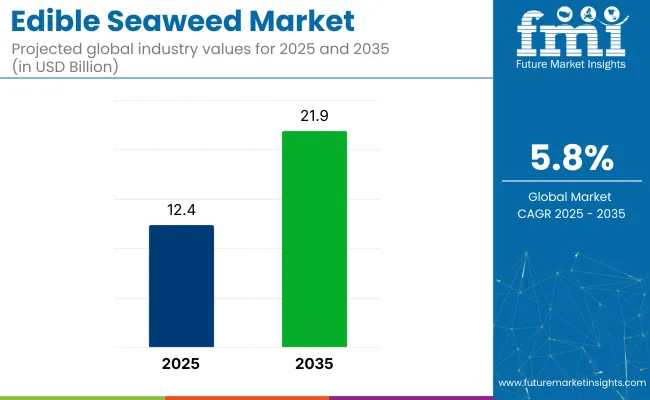
The global edible seaweed market is set to be valued at USD 12.4 billion in 2025 and a projected reach of USD 21.9 billion by 2035. For manufacturers, this reflects a shift from niche food adoption to broader functional applications in plant-based nutrition and health products. In volume terms, dried seaweed retains over 75% share in 2025, led by production clusters in China, South Korea, and Indonesia.
Quick Stats of Edible Seaweed Market

  • Market Value (2025): USD 12.4 billion
  • Forecast Value (2035): USD 21.9 billion
  • Forecast CAGR (2025 to 2035): 5.8%
  • Leading Segment in 2025: Dried form (75% share)
  • Key Growth Region: North America (The USA is the fastest growing market with 6.8% CAGR)
  • Key Players: Gelymar, Tasmanian Seafood Seduction, PhycoHealth, Sea Forest, Australian Seaweed Institute, Marinova, Great Southern Ocean, The Seaweed Company, Acadian Seaplants, Qingdao Gather Great Ocean Algae Industry Group

Edible Seaweed Market

Metric Value
Industry Size (2025E) USD 12.4 billion
Industry Value (2035F) USD 21.9 billion
CAGR (2025 to 2035) 5.8%

Manufacturers aiming to optimize cost-to-nutrient ratios are shifting focus toward semi-refined carrageenan and alginate fractions, where extraction margins can exceed 18% with minimal raw material waste. In Australia and North America, a wave of biotech-enabled cultivation has emerged, particularly for red seaweeds rich in protein and omega-3 analogues. These strains show potential to outperform traditional nori in both aquaculture feed and snack formulations.

On the demand side, North America, especially the United States, is growing fastest at 6.8% CAGR. Food processors and supplement brands are sourcing organic-certified seaweed inputs for gut health, immunity, and thyroid support applications. Manufacturers supplying to this segment are developing fermentation-free drying techniques to preserve iodine and antioxidant levels.

Compliance remains key. Harmonization of CODEX-aligned quality standards in ASEAN and the EU is reducing trade barriers. Japan’s Food Sanitation Law amendments have catalyzed functional food certifications for brown seaweed extracts. In Europe, high-fiber kelp variants have gained EFSA backing for prebiotic claims, driving formulators to seek suppliers that meet strict traceability metrics. Seaweed’s penetration in protein markets is still low. It is estimated under 3% but lipid and polysaccharide profiles offer novel value propositions outside traditional protein markets.

The industry registers a relatively small share within the broader markets it belongs to, but it is steadily growing due to increasing consumer demand for healthy, sustainable, and plant-based food options. In the legumes and pulses market, edible seaweed would likely represent less than 5%, as this market is dominated by crops like lentils and chickpeas.

In the plant-based protein market, seaweed's share is also modest, likely under 3%, given its niche compared to other protein-rich sources like soy or pea protein. In the functional foods market, seaweed's share is growing but may still be less than 10%. However, in the organic food market, edible seaweed has a more significant presence, especially in coastal regions, accounting for around 5-7% of the market.

Analysis of Edible Seaweed Market by Top Investment Segments

The industry is segmented by product type into brown algae, red algae, and green algae; by end use application into food and beverage processing, pharmaceuticals, dietary supplements and nutraceuticals, personal care and cosmetics, animal feed, aqua feed, pet food, and retail; by extraction method into conventional and current method; and by form into dried and liquid. The regional analysis spans North America, Western Europe, East Asia, and South Asia.

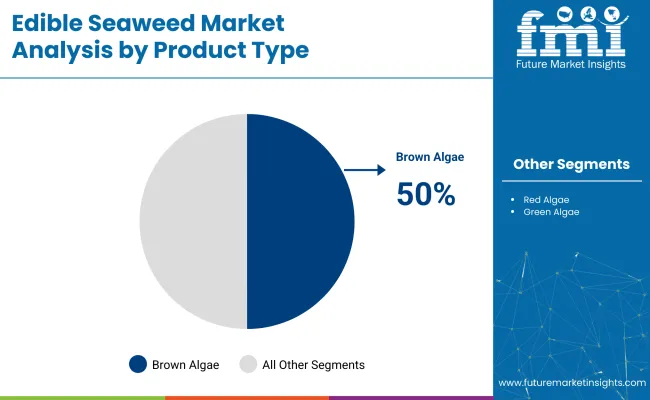
Brown Algae is Expected to dominate the Product Type with an 50% Market Share in 2025

Brown algae is expected to hold the largest share of the market, accounting for 50% of the market in 2025. This is driven by its widespread use in culinary applications (such as kombu and wakame in soups and salads), as well as its growing role in health supplements due to its rich nutrient profile, including iodine, calcium, and magnesium.
  • Beyond culinary uses, it is also valued for its antioxidant properties, which promote l health.
  • The increasing trend toward plant-based, sustainable, and functional foods has amplified demand for brown algae, especially in the food and beverage industry, where it is used as a natural thickening agent or as an ingredient in ready-to-eat meals, snacks, and functional drinks.

Edible Seaweed Market Analysis By Product Type

Food & Beverage Is Projected to Lead End Use Applications with a 45% Share in 2025

The food & beverage processing segment is expected to hold the largest share of the market, accounting for around 45% in 2025. This dominance is driven by the increasing incorporation of seaweed into a wide range of food products, from soups and salads to snacks, beverages, and even plant-based alternatives.

  • Seaweed, especially brown algae, is highly valued for its nutritional benefits and natural thickening properties, making it a sought-after ingredient in both processed and convenience foods.
  • The growing trend of clean-label, plant-based, and functional foods, alongside rising consumer awareness about the health benefits of seaweed (such as its antioxidant, mineral, and fiber content), further fuels demand.

Conventional Extraction Is Expected to Lead Extraction Method with 60% Share

The conventional extraction method is expected to hold the largest share of the market, accounting for 60% share in 2025. This method remains dominant due to its long-established use and familiarity in seaweed harvesting and processing.

  • Conventional extraction methods, such as manual harvesting and basic drying or steaming processes, are well-suited to large-scale production and are cost-effective, particularly in regions where seaweed farming is a traditional practice.
  • While current extraction methods, like advanced enzymatic or mechanical techniques, are gaining traction for their ability to preserve nutrients and improve yield, conventional methods still lead due to their widespread adoption and lower initial investment costs.

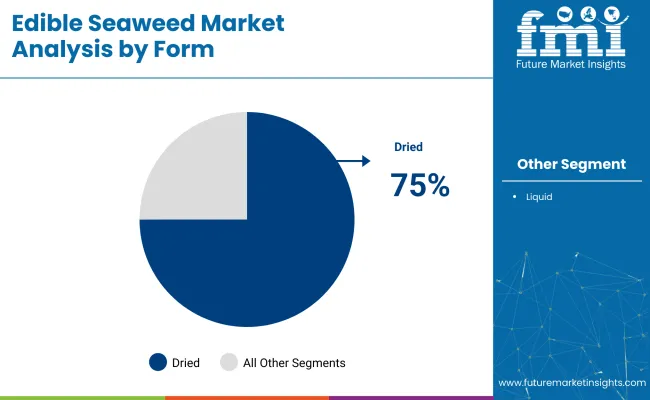
By Form, Dried Segment Accounts for Over 75% Share

The dried form of edible seaweed is expected to hold the largest share of the market, accounting for 75% in 2025. Dried seaweed is highly favored due to its long shelf life, ease of storage, and versatility in both culinary and industrial applications. It is commonly used in snacks, soups, salads, and as an ingredient in processed foods.
  • The drying process helps preserve the seaweed's nutritional content, making it a convenient and cost-effective option for both consumers and manufacturers
  • Dried seaweed is preferred in many regions due to its widespread availability and familiarity in traditional recipes.
  • The liquid form, while growing in popularity for use in food supplements, sauces, and functional beverages, still represents a smaller segment because it requires more specialized processing and has a shorter shelf life compared to dried seaweed.

Edible Seaweed Market Analysis By Form

Top Edible Seaweed Market Dynamics

Edible seaweed is gaining traction as both a nutrient-dense input and a monetizable crop. Its use in clean-label fortification and alignment with blue-carbon credit frameworks is attracting food brands and coastal producers alike. These twin revenue levers are reshaping supply dynamics across food, supplements, and marine agronomy sectors.

Micronutrient Fortification Contracts Reshaping End-Use Economics

Mandatory sodium-reduction targets in North America and Europe have pushed bakery and cereal makers to secure natural iodine and potassium sources. Food-grade kelp powders now command long-term supply agreements covering 14 kt through 2028, equal to 3.2% of global dried output. Calcium-rich red algae is being blended into oat beverages at 1.1% inclusion, allowing “source of calcium” label claims without mineral salts.

  • Product reformulations linked to 30% sodium cut pledges under EU Farm-to-Fork commitments
  • Infant cereal brands contracting 600 t of fine-milled kelp for iodine enrichment
  • Shelf-stable powders improve pallet density by 42% versus wet purées, lowering freight cost per nutrient unit

Blue-Carbon Credit Monetization Unlocks Dual Revenue Streams

Macroalgae farms in South Korea and Norway have begun registering sequestration projects under Verra’s VM0043 methodology. Issuance of 0.8 Mt CO₂-eq credits is projected by 2026, enabling growers to hedge biomass-price swings. Forward credit prices averaged USD 19.4 per tonne in Q2 2025, covering up to 17% of cultivation opex for rope-grown kelp. Ingredient processors are layering carbon-neutral claims onto seaweed extract SKUs, securing premium positioning in cosmetics and nutraceutical channels.
  • Eight commercial farms enrolled, representing 1 300 ha of cultivation ropes
  • Financial models show EBITDA uplift of 5-7% when credit revenue is recognized
  • Downstream brands require blockchain-verified farm coordinates and nutrient profiles before offtake

Analysis of Top Countries Producing and Supplying Edible Seaweed Globally

Edible Seaweed Market Country Wise Analysis

Country CAGR (2025 to 2035)
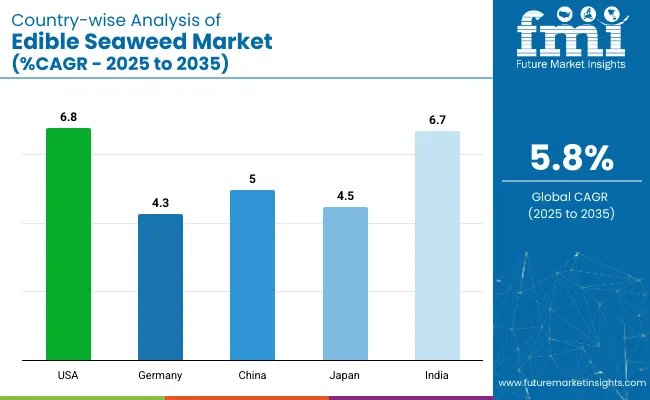
United States 6.8%
Germany 4.3%
Japan 4.5%
China 5.0%
India 6.7%

The edible seaweed market, expected to grow globally at a CAGR of 5.8% from 2025 to 2035, shows varied performance across key countries. The United States, a member of the OECD, is leading with a 6.8% CAGR, driven by strong demand for plant-based, sustainable food options and the rise of vegan and health-conscious diets. India, a member of the BRICS group, is also experiencing growth, with a 6.7% CAGR, fueled by increasing health awareness, plant-based food adoption, and opportunities for local seaweed cultivation.

Moderate growth is being recorded in Japan (OECD), with a 4.5% CAGR, as the traditional consumption of seaweed merges with the rising demand for functional foods and health supplements among the aging population. China, also part of BRICS, is expected to grow at a 5.0% CAGR, driven by its rich culinary history with seaweed and increasing middle-class demand for health-focused products. Slower growth is seen in Germany, an OECD member, with a 4.3% CAGR, reflecting steady but moderate adoption of seaweed as part of the growing organic and sustainable food trend.

The report covers a detailed analysis of 40+ countries, with the top five countries shared as a reference for market trends.

In-depth Analysis of the United States Edible Seaweed Market

Demand for edible seaweed in the United States is likely to grow at a 6.8% CAGR during the forecast period. The increasing demand for plant-based and sustainable food options has significantly contributed to this growth. As consumers become more health-conscious, seaweed is gaining popularity due to its rich nutrient profile, including high levels of vitamins, minerals, and antioxidants.

The rise of vegan and vegetarian diets, especially among younger generations, has driven the demand for natural, plant-based protein sources like seaweed. eaweed’s minimal environmental impact makes it an attractive alternative to traditional crops, aligning with the growing preference for eco-friendly food choices.

  • Growing demand for plant-based, nutrient-rich foods
  • Increased popularity of vegan and vegetarian diets
  • Strong consumer interest in sustainable food options

Analysis of Sales of Edible Seaweed Systems in Germany

Sales of edible seaweed in Germany is projected to grow at a 4.3% CAGR during the forecast period. Germany has witnessed a rising trend toward health-conscious eating, with consumers increasingly opting for nutrient-dense, functional foods. As one of Europe’s leading markets for organic and plant-based food products, Germany’s demand for seaweed is driven by its high nutritional value and versatility in various food applications.

The German food industry has embraced seaweed as an alternative to traditional ingredients, using it in plant-based products, snacks, and even in non-dairy beverages. The growing awareness of seaweed's potential health benefits, such as supporting immune function and gut health, has further expanded its appeal. .

  • Rising consumer demand for health-focused, functional foods
  • Strong market for organic and plant-based food products
  • Growing preference for sustainable and eco-friendly food choices

Detailed Outlook on the Future of Edible Seaweed Market in China

The edible seaweed market in China is anticipated to grow at a 5% CAGR during the forecast period. China has a long tradition of incorporating seaweed into its cuisine, particularly in dishes like soups, salads, and sushi. The growing middle-class population, along with increasing disposable incomes, has driven demand for both traditional and new seaweed-based food products.

As the country grapples with increasing health concerns, such as obesity and lifestyle diseases, there is a shift toward more nutritious, plant-based diets. The rich antioxidant, vitamin, and mineral content of seaweed makes it an attractive alternative to processed foods. The Chinese government’s focus on sustainable agricultural practices and the growing interest in eco-friendly food sources have contributed to the increased adoption of seaweed farming, further boosting market growth.

  • Long-standing culinary tradition incorporating seaweed
  • Rising consumer demand for nutritious and plant-based foods
  • Government support for sustainable agricultural practices

Growth Analysis and Forecast for Japan Edible Seaweed Market

The edible seaweed market in Japan is projected to grow at a 4.5% CAGR from 2025 to 2035. Seaweed is an essential part of Japanese cuisine, with products like nori, wakame, and kombu being integral ingredients in traditional dishes such as sushi, soups, and salads. Japan’s long-standing appreciation for the nutritional and health benefits of seaweed continues to drive its consumption.

As the Japanese population increasingly focuses on healthy aging, seaweed’s antioxidant, anti-inflammatory, and immune-boosting properties are gaining traction. Tis rising consumer awareness about sustainable food practices, and seaweed’s minimal environmental impact has made it a favorable choice. The growing popularity of functional foods and health supplements has also contributed to a steady rise in seaweed-based products, which are now being incorporated into snacks, beverages, and wellness products.

  • Deep-rooted cultural and culinary tradition with seaweed
  • Strong demand for functional foods and health supplements
  • Growing interest in sustainable and eco-friendly food sources

Demand Forecast Analysis for Edible Seaweed Market in India

The India edible seaweed market is estimated to grow at a 6.7% CAGR between 2025 and 2035. India’s expanding health-conscious population is increasingly seeking alternative, nutrient-rich foods to improve well-being. Seaweed, known for its high fiber content, vitamins, and minerals, is being recognized as a superfood and is gaining popularity in various health supplements and functional foods.

The rising adoption of vegan and plant-based diets in India has fueled demand for plant-based proteins, with seaweed becoming an attractive protein source. India’s coastline offers significant opportunities for seaweed cultivation, aligning with the government's focus on promoting sustainable aquaculture practices.

  • Rising health consciousness and demand for nutrient-rich foods
  • Increasing popularity of plant-based and vegan diets
  • Government support for sustainable aquaculture and seaweed cultivation

Leading Edible Seaweed Suppliers

Key players like Gelymar and Tasmanian seafood seduction dominate the market with their advanced sustainable harvesting techniques. Gelymar specializes in producing high-quality seaweed-based ingredients for the food and beverage industry, while Tasmanian Seafood Seduction offers premium seaweed products with a strong focus on clean, sustainable sourcing.

Other significant players like PhycoHealth and Sea Forest are innovating with seaweed-based health supplements and sustainable aquaculture solutions. Emerging players like the seaweed company and Marinova are focusing on advanced extraction methods for bioactive compounds, contributing to the growing demand for functional foods and supplements.

Recent Edible Seaweed Industry News

  • In 2024 and 2025, Gelymar continued its strategic partnership with Algaia to expand sustainable algae extract offerings in North America, focusing on food and nutraceutical applications; however, no new capacity expansions or acquisitions were publicly announced during this period.

Leading Players

  • Gelymar
  • Tasmanian Seafood Seduction
  • PhycoHealth
  • Sea Forest
  • Australian Seaweed Institute
  • Marinova
  • Great Southern Ocean
  • The Seaweed Company
  • Acadian Seaplants
  • Qingdao Gather Great Ocean Algae Industry Group

Report Coverage and Scope Summary

Report Attributes Details
Market Size (2025) USD 12.4 billion
Projected Market Size (2035) USD 21.9 billion
CAGR (2025 to 2035) 5.8%
Base Year for Estimation 2024
Historical Period 2020 to 2024
Projections Period 2025 to 2035
Quantitative Units USD billion for value and volume in metric tons
Product Type Analyzed (Segment 1) Brown Algae, Red Algae, And Green Algae.
End Use Application Analyzed (Segment 2) Food & Beverage Processing, Pharmaceuticals, Dietary Supplements And Nutraceuticals, Personal Care And Cosmetics, Animal Feed, Aqua Feed, Pet Food, And Retail.
Extraction Method Analyzed (Segment 3) Conventional And Current Method.
Form Analyzed (Segment 4) Dried And Liquid.
Regions Covered North America, Europe, Asia Pacific, Middle East & Africa, Latin America
Countries Covered United States, Canada, Germany, United Kingdom, France, Italy, Spain, China, Japan, South Korea, India, Australia, Brazil, Mexico, Argentina, Saudi Arabia, UAE, South Africa
Key Players Gelymar, Tasmanian Seafood Seduction, PhycoHealth, Sea Forest, Australian Seaweed Institute, Marinova, Great Southern Ocean, The Seaweed Company, Acadian Seaplants, Qingdao Gather Great Ocean Algae Industry Group
Additional Attributes Dollar sales, market share by product type and region, growth trends, competitive landscape, consumer preferences, regulatory challenges, and forecasts for future demand in key applications.

Key Segments

By Product Type:

The industry is segmented into brown algae, red algae, and green algae.

By End Use Application:

The industry covers food & beverage processing, pharmaceuticals, dietary supplements and nutraceuticals, personal care and cosmetics, animal feed, aqua feed, pet food, and retail.

By Extraction Method:

The industry is categorized into conventional and current method.

By Form:

The industry is segmented into dried and liquid.

By Region:

The market spans North America, Western Europe, East Asia, and South Asia.

Table of Content

  1. Executive Summary
  2. Industry Introduction, including Taxonomy and Market Definition
  3. Trends and Success Factors, including Macro-economic Factors, Market Dynamics, and Recent Industry Developments
  4. Global Market Demand Analysis 2020 to 2024 and Forecast 2025 to 2035, including Historical Analysis and Future Projections
  5. Pricing Analysis
  6. Global Market Analysis 2020 to 2024 and Forecast 2025 to 2035
    • Product Type
    • End Use Application
    • Extraction Method
    • Form
  7. By Product Type
    • Brown Algae
    • Green Algae
    • Red Algae
  8. By End Use Application
    • Food & Beverage Processing
    • Pharmaceuticals
    • Dietary Supplements and Nutraceuticals
    • Personal Care and Cosmetics
    • Animal Feed
    • Aqua Feed
    • Pet Food
    • Retail
  9. By Extraction Method
    • Conventional
    • Current Method
  10. By Form
    • Dried
    • Liquid
  11. By Region
    • North America
    • Latin America
    • Western Europe
    • Eastern Europe
    • East Asia
    • South Asia & Pacific
    • Central Asia
    • Russia and Belarus
    • Balkan & Baltic Countries
    • Middle East and Africa
  12. North America Sales Analysis 2020 to 2024 and Forecast 2025 to 2035, by Key Segments and Countries
  13. Latin America Sales Analysis 2020 to 2024 and Forecast 2025 to 2035, by Key Segments and Countries
  14. Western Europe Sales Analysis 2020 to 2024 and Forecast 2025 to 2035, by Key Segments and Countries
  15. Eastern Europe Sales Analysis 2020 to 2024 and Forecast 2025 to 2035, by Key Segments and Countries
  16. East Asia Sales Analysis 2020 to 2024 and Forecast 2025 to 2035, by Key Segments and Countries
  17. South Asia & Pacific Sales Analysis 2020 to 2024 and Forecast 2025 to 2035, by Key Segments and Countries
  18. Central Asia Sales Analysis 2020 to 2024 and Forecast 2025 to 2035, by Key Segments and Countries
  19. Russia and Belarus Sales Analysis 2020 to 2024 and Forecast 2025 to 2035, by Key Segments and Countries
  20. Balkan & Baltic Countries Sales Analysis 2020 to 2024 and Forecast 2025 to 2035, by Key Segments and Countries
  21. Middle East and Africa Sales Analysis 2020 to 2024 and Forecast 2025 to 2035, by Key Segments and Countries
  22. Sales Forecast to 2035 by Product Type, End Use Application, Extraction Method, and Form for 30 Countries
  23. Competitive Assessment, Company Share Analysis by Key Players, and Competition Dashboard
  24. Company Profile
    • Gelymar
    • Tasmanian Seafood Seduction
    • PhycoHealth
    • Sea Forest
    • Australian Seaweed Institute
    • Marinova
    • Great Southern Ocean
    • The Seaweed Company
    • Acadian Seaplants
    • Qingdao Gather Great Ocean Algae Industry Group
    • Other Prominent Market Player

List of Tables

  • Table 1: Global Market Value (USD Billion) & Volume (MT) Forecast by Region, 2020-2035
  • Table 2: Global Market Value (USD Billion) & Volume (MT) Forecast by Product Type, 2020-2035
  • Table 3: Global Market Value (USD Billion) & Volume (MT) Forecast by End Use Application, 2020-2035
  • Table 4: Global Market Value (USD Billion) & Volume (MT) Forecast by Extraction Method, 2020-2035
  • Table 5: Global Market Value (USD Billion) & Volume (MT) Forecast by Form, 2020-2035
  • Table 6: North America Market Value (USD Billion) & Volume (MT) Forecast by Country, 2020-2035
  • Table 7: North America Market Value (USD Billion) & Volume (MT) Forecast by Product Type, 2020-2035
  • Table 8: North America Market Value (USD Billion) & Volume (MT) Forecast by End Use Application, 2020-2035
  • Table 9: North America Market Value (USD Billion) & Volume (MT) Forecast by Extraction Method, 2020-2035
  • Table 10: North America Market Value (USD Billion) & Volume (MT) Forecast by Form, 2020-2035
  • Table 11: Latin America Market Value (USD Billion) & Volume (MT) Forecast by Country, 2020-2035
  • Table 12: Latin America Market Value (USD Billion) & Volume (MT) Forecast by Product Type, 2020-2035
  • Table 13: Latin America Market Value (USD Billion) & Volume (MT) Forecast by End Use Application, 2020-2035
  • Table 14: Latin America Market Value (USD Billion) & Volume (MT) Forecast by Extraction Method, 2020-2035
  • Table 15: Latin America Market Value (USD Billion) & Volume (MT) Forecast by Form, 2020-2035
  • Table 16: Western Europe Market Value (USD Billion) & Volume (MT) Forecast by Country, 2020-2035
  • Table 17: Western Europe Market Value (USD Billion) & Volume (MT) Forecast by Product Type, 2020-2035
  • Table 18: Western Europe Market Value (USD Billion) & Volume (MT) Forecast by End Use Application, 2020-2035
  • Table 19: Western Europe Market Value (USD Billion) & Volume (MT) Forecast by Extraction Method, 2020-2035
  • Table 20: Western Europe Market Value (USD Billion) & Volume (MT) Forecast by Form, 2020-2035
  • Table 21: Eastern Europe Market Value (USD Billion) & Volume (MT) Forecast by Country, 2020-2035
  • Table 22: Eastern Europe Market Value (USD Billion) & Volume (MT) Forecast by Product Type, 2020-2035
  • Table 23: Eastern Europe Market Value (USD Billion) & Volume (MT) Forecast by End Use Application, 2020-2035
  • Table 24: Eastern Europe Market Value (USD Billion) & Volume (MT) Forecast by Extraction Method, 2020-2035
  • Table 25: Eastern Europe Market Value (USD Billion) & Volume (MT) Forecast by Form, 2020-2035
  • Table 26: East Asia Market Value (USD Billion) & Volume (MT) Forecast by Country, 2020-2035
  • Table 27: East Asia Market Value (USD Billion) & Volume (MT) Forecast by Product Type, 2020-2035
  • Table 28: East Asia Market Value (USD Billion) & Volume (MT) Forecast by End Use Application, 2020-2035
  • Table 29: East Asia Market Value (USD Billion) & Volume (MT) Forecast by Extraction Method, 2020-2035
  • Table 30: East Asia Market Value (USD Billion) & Volume (MT) Forecast by Form, 2020-2035
  • Table 31: South Asia & Pacific Market Value (USD Billion) & Volume (MT) Forecast by Country, 2020-2035
  • Table 32: South Asia & Pacific Market Value (USD Billion) & Volume (MT) Forecast by Product Type, 2020-2035
  • Table 33: South Asia & Pacific Market Value (USD Billion) & Volume (MT) Forecast by End Use Application, 2020-2035
  • Table 34: South Asia & Pacific Market Value (USD Billion) & Volume (MT) Forecast by Extraction Method, 2020-2035
  • Table 35: South Asia & Pacific Market Value (USD Billion) & Volume (MT) Forecast by Form, 2020-2035
  • Table 36: Central Asia Market Value (USD Billion) & Volume (MT) Forecast by Country, 2020-2035
  • Table 37: Central Asia Market Value (USD Billion) & Volume (MT) Forecast by Product Type, 2020-2035
  • Table 38: Central Asia Market Value (USD Billion) & Volume (MT) Forecast by End Use Application, 2020-2035
  • Table 39: Central Asia Market Value (USD Billion) & Volume (MT) Forecast by Extraction Method, 2020-2035
  • Table 40: Central Asia Market Value (USD Billion) & Volume (MT) Forecast by Form, 2020-2035
  • Table 41: Russia and Belarus Market Value (USD Billion) & Volume (MT) Forecast by Country, 2020-2035
  • Table 42: Russia and Belarus Market Value (USD Billion) & Volume (MT) Forecast by Product Type, 2020-2035
  • Table 43: Russia and Belarus Market Value (USD Billion) & Volume (MT) Forecast by End Use Application, 2020-2035
  • Table 44: Russia and Belarus Market Value (USD Billion) & Volume (MT) Forecast by Extraction Method, 2020-2035
  • Table 45: Russia and Belarus Market Value (USD Billion) & Volume (MT) Forecast by Form, 2020-2035
  • Table 46: Balkan & Baltic Countries Market Value (USD Billion) & Volume (MT) Forecast by Country, 2020-2035
  • Table 47: Balkan & Baltic Countries Market Value (USD Billion) & Volume (MT) Forecast by Product Type, 2020-2035
  • Table 48: Balkan & Baltic Countries Market Value (USD Billion) & Volume (MT) Forecast by End Use Application, 2020-2035
  • Table 49: Balkan & Baltic Countries Market Value (USD Billion) & Volume (MT) Forecast by Extraction Method, 2020-2035
  • Table 50: Balkan & Baltic Countries Market Value (USD Billion) & Volume (MT) Forecast by Form, 2020-2035
  • Table 51: Middle East and Africa Market Value (USD Billion) & Volume (MT) Forecast by Country, 2020-2035
  • Table 52: Middle East and Africa Market Value (USD Billion) & Volume (MT) Forecast by Product Type, 2020-2035
  • Table 53: Middle East and Africa Market Value (USD Billion) & Volume (MT) Forecast by End Use Application, 2020-2035
  • Table 54: Middle East and Africa Market Value (USD Billion) & Volume (MT) Forecast by Extraction Method, 2020-2035
  • Table 55: Middle East and Africa Market Value (USD Billion) & Volume (MT) Forecast by Form, 2020-2035

List of Figures

  • Figure 1: Global Market Value Share (%), Growth Rate (Y-o-Y), and Value (USD Billion) & Volume (MT) Projection by Product Type, 2020-2035
  • Figure 2: Global Market Value Share (%), Growth Rate (Y-o-Y), and Value (USD Billion) & Volume (MT) Projection by End Use Application, 2020-2035
  • Figure 3: Global Market Value Share (%), Growth Rate (Y-o-Y), and Value (USD Billion) & Volume (MT) Projection by Extraction Method, 2020-2035
  • Figure 4: Global Market Value Share (%), Growth Rate (Y-o-Y), and Value (USD Billion) & Volume (MT) Projection by Form, 2020-2035
  • Figure 5: Global Market Value Share (%), Growth Rate (Y-o-Y), and Value (USD Billion) & Volume (MT) Projection by Region, 2020-2035
  • Figure 6: North America Market Value Share (%), Growth Rate (Y-o-Y), and Value (USD Billion) & Volume (MT) Projection by Product Type, 2020-2035
  • Figure 7: North America Market Value Share (%), Growth Rate (Y-o-Y), and Value (USD Billion) & Volume (MT) Projection by End Use Application, 2020-2035
  • Figure 8: North America Market Value Share (%), Growth Rate (Y-o-Y), and Value (USD Billion) & Volume (MT) Projection by Extraction Method, 2020-2035
  • Figure 9: North America Market Value Share (%), Growth Rate (Y-o-Y), and Value (USD Billion) & Volume (MT) Projection by Form, 2020-2035
  • Figure 10: North America Market Value Share (%), Growth Rate (Y-o-Y), and Value (USD Billion) & Volume (MT) Projection by Country, 2020-2035
  • Figure 11: Latin America Market Value Share (%), Growth Rate (Y-o-Y), and Value (USD Billion) & Volume (MT) Projection by Product Type, 2020-2035
  • Figure 12: Latin America Market Value Share (%), Growth Rate (Y-o-Y), and Value (USD Billion) & Volume (MT) Projection by End Use Application, 2020-2035
  • Figure 13: Latin America Market Value Share (%), Growth Rate (Y-o-Y), and Value (USD Billion) & Volume (MT) Projection by Extraction Method, 2020-2035
  • Figure 14: Latin America Market Value Share (%), Growth Rate (Y-o-Y), and Value (USD Billion) & Volume (MT) Projection by Form, 2020-2035
  • Figure 15: Latin America Market Value Share (%), Growth Rate (Y-o-Y), and Value (USD Billion) & Volume (MT) Projection by Country, 2020-2035
  • Figure 16: Western Europe Market Value Share (%), Growth Rate (Y-o-Y), and Value (USD Billion) & Volume (MT) Projection by Product Type, 2020-2035
  • Figure 17: Western Europe Market Value Share (%), Growth Rate (Y-o-Y), and Value (USD Billion) & Volume (MT) Projection by End Use Application, 2020-2035
  • Figure 18: Western Europe Market Value Share (%), Growth Rate (Y-o-Y), and Value (USD Billion) & Volume (MT) Projection by Extraction Method, 2020-2035
  • Figure 19: Western Europe Market Value Share (%), Growth Rate (Y-o-Y), and Value (USD Billion) & Volume (MT) Projection by Form, 2020-2035
  • Figure 20: Western Europe Market Value Share (%), Growth Rate (Y-o-Y), and Value (USD Billion) & Volume (MT) Projection by Country, 2020-2035
  • Figure 21: Eastern Europe Market Value Share (%), Growth Rate (Y-o-Y), and Value (USD Billion) & Volume (MT) Projection by Product Type, 2020-2035
  • Figure 22: Eastern Europe Market Value Share (%), Growth Rate (Y-o-Y), and Value (USD Billion) & Volume (MT) Projection by End Use Application, 2020-2035
  • Figure 23: Eastern Europe Market Value Share (%), Growth Rate (Y-o-Y), and Value (USD Billion) & Volume (MT) Projection by Extraction Method, 2020-2035
  • Figure 24: Eastern Europe Market Value Share (%), Growth Rate (Y-o-Y), and Value (USD Billion) & Volume (MT) Projection by Form, 2020-2035
  • Figure 25: Eastern Europe Market Value Share (%), Growth Rate (Y-o-Y), and Value (USD Billion) & Volume (MT) Projection by Country, 2020-2035
  • Figure 26: East Asia Market Value Share (%), Growth Rate (Y-o-Y), and Value (USD Billion) & Volume (MT) Projection by Product Type, 2020-2035
  • Figure 27: East Asia Market Value Share (%), Growth Rate (Y-o-Y), and Value (USD Billion) & Volume (MT) Projection by End Use Application, 2020-2035
  • Figure 28: East Asia Market Value Share (%), Growth Rate (Y-o-Y), and Value (USD Billion) & Volume (MT) Projection by Extraction Method, 2020-2035
  • Figure 29: East Asia Market Value Share (%), Growth Rate (Y-o-Y), and Value (USD Billion) & Volume (MT) Projection by Form, 2020-2035
  • Figure 30: East Asia Market Value Share (%), Growth Rate (Y-o-Y), and Value (USD Billion) & Volume (MT) Projection by Country, 2020-2035
  • Figure 31: South Asia & Pacific Market Value Share (%), Growth Rate (Y-o-Y), and Value (USD Billion) & Volume (MT) Projection by Product Type, 2020-2035
  • Figure 32: South Asia & Pacific Market Value Share (%), Growth Rate (Y-o-Y), and Value (USD Billion) & Volume (MT) Projection by End Use Application, 2020-2035
  • Figure 33: South Asia & Pacific Market Value Share (%), Growth Rate (Y-o-Y), and Value (USD Billion) & Volume (MT) Projection by Extraction Method, 2020-2035
  • Figure 34: South Asia & Pacific Market Value Share (%), Growth Rate (Y-o-Y), and Value (USD Billion) & Volume (MT) Projection by Form, 2020-2035
  • Figure 35: South Asia & Pacific Market Value Share (%), Growth Rate (Y-o-Y), and Value (USD Billion) & Volume (MT) Projection by Country, 2020-2035
  • Figure 36: Central Asia Market Value Share (%), Growth Rate (Y-o-Y), and Value (USD Billion) & Volume (MT) Projection by Product Type, 2020-2035
  • Figure 37: Central Asia Market Value Share (%), Growth Rate (Y-o-Y), and Value (USD Billion) & Volume (MT) Projection by End Use Application, 2020-2035
  • Figure 38: Central Asia Market Value Share (%), Growth Rate (Y-o-Y), and Value (USD Billion) & Volume (MT) Projection by Extraction Method, 2020-2035
  • Figure 39: Central Asia Market Value Share (%), Growth Rate (Y-o-Y), and Value (USD Billion) & Volume (MT) Projection by Form, 2020-2035
  • Figure 40: Central Asia Market Value Share (%), Growth Rate (Y-o-Y), and Value (USD Billion) & Volume (MT) Projection by Country, 2020-2035
  • Figure 41: Russia and Belarus Market Value Share (%), Growth Rate (Y-o-Y), and Value (USD Billion) & Volume (MT) Projection by Product Type, 2020-2035
  • Figure 42: Russia and Belarus Market Value Share (%), Growth Rate (Y-o-Y), and Value (USD Billion) & Volume (MT) Projection by End Use Application, 2020-2035
  • Figure 43: Russia and Belarus Market Value Share (%), Growth Rate (Y-o-Y), and Value (USD Billion) & Volume (MT) Projection by Extraction Method, 2020-2035
  • Figure 44: Russia and Belarus Market Value Share (%), Growth Rate (Y-o-Y), and Value (USD Billion) & Volume (MT) Projection by Form, 2020-2035
  • Figure 45: Russia and Belarus Market Value Share (%), Growth Rate (Y-o-Y), and Value (USD Billion) & Volume (MT) Projection by Country, 2020-2035
  • Figure 46: Balkan & Baltic Countries Market Value Share (%), Growth Rate (Y-o-Y), and Value (USD Billion) & Volume (MT) Projection by Product Type, 2020-2035
  • Figure 47: Balkan & Baltic Countries Market Value Share (%), Growth Rate (Y-o-Y), and Value (USD Billion) & Volume (MT) Projection by End Use Application, 2020-2035
  • Figure 48: Balkan & Baltic Countries Market Value Share (%), Growth Rate (Y-o-Y), and Value (USD Billion) & Volume (MT) Projection by Extraction Method, 2020-2035
  • Figure 49: Balkan & Baltic Countries Market Value Share (%), Growth Rate (Y-o-Y), and Value (USD Billion) & Volume (MT) Projection by Form, 2020-2035
  • Figure 50: Balkan & Baltic Countries Market Value Share (%), Growth Rate (Y-o-Y), and Value (USD Billion) & Volume (MT) Projection by Country, 2020-2035
  • Figure 51: Middle East and Africa Market Value Share (%), Growth Rate (Y-o-Y), and Value (USD Billion) & Volume (MT) Projection by Product Type, 2020-2035
  • Figure 52: Middle East and Africa Market Value Share (%), Growth Rate (Y-o-Y), and Value (USD Billion) & Volume (MT) Projection by End Use Application, 2020-2035
  • Figure 53: Middle East and Africa Market Value Share (%), Growth Rate (Y-o-Y), and Value (USD Billion) & Volume (MT) Projection by Extraction Method, 2020-2035
  • Figure 54: Middle East and Africa Market Value Share (%), Growth Rate (Y-o-Y), and Value (USD Billion) & Volume (MT) Projection by Form, 2020-2035
  • Figure 55: Middle East and Africa Market Value Share (%), Growth Rate (Y-o-Y), and Value (USD Billion) & Volume (MT) Projection by Country, 2020-2035

Frequently Asked Questions

What is the estimated market size of the edible seaweed industry in 2025?

The industry is valued at USD 12.4 billion in 2025.

What is the projected industry size of the edible seaweed industry by 2035?

It is forecasted to reach USD 21.9 billion by 2035.

What is the expected CAGR for the edible seaweed industry between 2025 and 2035?

The industry is anticipated to grow at a CAGR of 5.8% during this period.

Which segment is expected to lead the edible seaweed market in 2025?

Dried form is projected to lead the market with a 75% share in 2025.

Which region is expected to witness the highest growth in the edible seaweed market?

North America, particularly the United States, is expected to be the key growth region with a projected growth rate of 6.8%.

Explore Similar Insights

Future Market Insights

Edible Seaweed Market