Reports

- Global Locations -

Headquarters

Future Market Insights, Inc.

Christiana Corporate, 200
Continental Drive, Suite 401,
Newark, Delaware - 19713,
United States

T: +1-845-579-5705

Americas

Future Market Insights, Inc.

616 Corporate Way, Suite 2-9018,
Valley Cottage, NY 10989, United States

T: +1-347-918-3531

MEA

Future Market Insights

1602-6 Jumeirah Bay X2 Tower, Plot No: JLT-PH2-X2A,
Jumeirah Lakes Towers, Dubai,
United Arab Emirates

Europe

Future Market Insights

3rd Floor, 207 Regent Street,
W1B 3HH London
United Kingdom

T: + 44 (0) 20 8123 9659
D: +44 (0) 20 3287 4268

Asia Pacific

Future Market Insights

IndiaLand Global Tech Park, Unit UG-1, Behind Grand HighStreet, Phase 1, Hinjawadi, MH, Pune – 411057, India

Seaweed Protein Market Outlook (2022-2032)

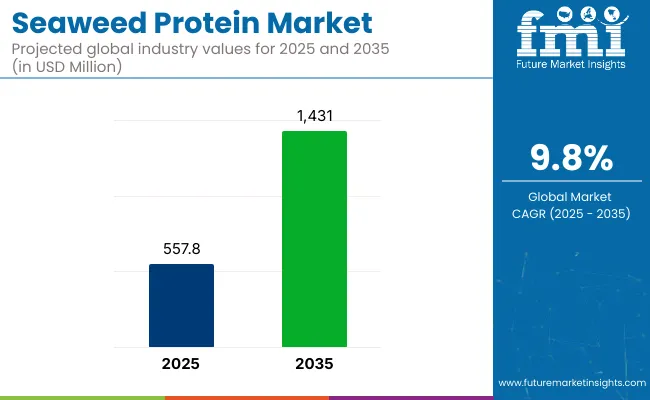
[250 Pages Report] The global seaweed protein market size is valued at USD 456.2 Mn in 2022 and it is expected to grow at a compound annual growth rate (CAGR) of 11.3% from 2022 to 2032. Global seaweed protein sales are likely to account for ~8.2% of the demand in the global seaweed market, valued at USD 5.5 Bn in 2022.

Attribute Details
Global Seaweed Protein Market Size (2022E) USD 456.2 Million
Global Seaweed Protein Market Projected Size (2032F) USD 971.7 Million
Value CAGR (2022-2032) 11.3%
Top 3 Countries Market Share 42.1%

Don't pay for what you don't need

Customize your report by selecting specific countries or regions and save 30%!

How Does the Global Seaweed Protein Market Compare in the Historic and Future Outlook?

The surge in demand for vegetarian/vegan alternative proteins is largely responsible for the enormous expansion of the seaweed protein market. Seaweed, Nuts, tofu, seeds, quinoa, and tempeh are just a few of the vegan alternative proteins available.

Additionally, rising consumer health awareness about the intake of dairy and animal products is raising public knowledge about seaweeds. In addition, expanding seaweed protein feed-related applications for animals are expected to drive the worldwide seaweed market in the forecasted years. Furthermore, the increasing use of seaweed proteins in weight loss may have a significant effect on market growth. People increasingly desire a healthier lifestyle that includes high-nutrient, low-fat, and low-sugar foods, which drives the need for seaweed protein.

Red seaweed has a global supply chain that produces approximately 18 million tons per year. The majority of the current crop is farmed to extract agar and carrageenan, which are used to improve the gel strength of processed foods. You may have absorbed seaweed-derived minerals if you washed your teeth this morning or ate ice cream the night before.

Red seaweed polysaccharides (carbohydrates) are often found in toothpaste and ice cream, and are utilised to thicken various meals and cosmetics. Agar is also used extensively in biological studies. As the base liner in a Petri dish, it is a preferred microorganism growth medium.

Nori is the next largest seaweed category in terms of volume. Nori is a red seaweed with the greatest protein content of any seaweed I've ever seen (up to 47 percent). Nori is used in soups, salads, and as a wrap for sushi rolls in Japanese cuisine.

Seaweed Protein Market

What is the impact of COVID-19 on the Global Seaweed Protein market?

The coronavirus (Covid-19) pandemic impacted negatively on a variety of businesses, including the seaweed protein industry. Many firms are facing difficulties such as lower consumption and interrupted supply chains as a result of global lockdowns and trade rules. The COVID-19 pandemic also had an impact on seaweed farming, as many farmers saw their seaweed prices drop. For example, the United Nations Industrial Development Organization reported in February 2020 that due to the Chinese trade embargo, the price of Cottonii seaweed (a type of red seaweed) has dropped by 50% in Indonesia.

Cottonii seaweed is utilized as a thickening and gelling agent in the food sector. Furthermore, many vendors, farmers, and manufacturers are losing money as a result of lower seaweed prices. As a result, the seaweed protein industry grew slowly during COVID-19. 

The seaweed protein market is projected to grow in 2022 as a result of the promising benefits of seaweed in treating coronavirus. Thus, positive development in the seaweed protein market in 2021 is mostly due to rising demand for seaweed and algal protein-based products, which may provide an early indicator of potential remedies to this global health crisis and maybe protect us against future pandemics.

Nandini Roy Choudhury

Principal Consultant

Talk to Analyst

Find your sweet spots for generating winning opportunities in this market.

Country-wise Insights

Why is Demand for Seaweed Protein increasing in U.S?

North America is predicted to remain an important market, accounting for the majority of market share in 2021. The United States holds more than 74.3% market share in the North American seaweed protein market, which is predicted to increase at a CAGR of around 6.8% over the forecast period. The growing emphasis on preventative healthcare is driving up up demand for nutritional supplements and nutraceutical products, which in turn is driving up demand for seaweed protein. Spirulina and chlorella are two microalgae proteins that are commonly employed in the production of nutraceutical products. The presence of important spirulina manufacturers in the United States, as well as high consumption of health supplements and strong rules against the use of synthetic food color, will encourage market expansion.

Professional athletes and fitness-conscious people in the region are requesting nutritional health supplements to preserve their overall health. Because blue-green algae, such as spirulina and chlorella, are high in vitamin, amino acid, protein, and other nutrients, they are commonly employed in the production of nutritional supplements. 

Seaweed and algal protein demand should be fueled by consistent investments in R&D for product advancements in this area, as well as rising consumer awareness about health and fitness, propelling regional business growth.

Which Determinants are Stimulating the United Kingdom Market for Seaweed Protein?

According to FMI, U.K is estimated to hold more than 19.0% share in the Europe seaweed protein market in 2022 and it is estimated to grow with a CAGR of around 6.2% in the forecast period.

The European population's life expectancy is likewise rising, and people are looking for new ways to keep healthy as they grow older. They may invest in high-quality nutraceutical items since they have a lot of spare income. As a result, nutraceuticals are becoming more common among consumers. Consumption of extremely nutritious microalgae like spirulina and chlorella are likely to increase as demand for health and wellness products rises. Exporters of spirulina and chlorella should take advantage of the European market's desire for high-quality edible seaweeds. Many importers are having quality concerns with inexpensive Chinese spirulina and chlorella. Because of the strict EU laws and consumer demand for high-quality products, European importers place a high value on quality. This factor's influence is predicted to rise in the coming years.

Why is China and India Expected to be the Fastest-Growing Market for Seaweed Protein?

China is dominating the East Asia seaweed protein market holding significant market share of more than 37.2% and it is expected to grow with CAGR of around 4.6% in the forecast period. While in the South Asia food extrusion market India is driving the growth owing to the rapid urbanization and increased per capita income of the consumers.

Food and beverage demand will be boosted as a result of increased demand for processed foods as a result of rapid urbanization and an increasing working population, significantly impacting the seaweed protein market dynamics. Consumer demand for these proteins will grow as people change to healthier diets that are low in calories, low in sugar, and high in protein. The food & beverage business is being driven by increased demand for organic food products and a high need for high protein beverages, which will boost demand for algal proteins during the forecasted time frame.

Category-wise Insights

Why Red Seaweeds are Predominant in of Seaweed Protein?

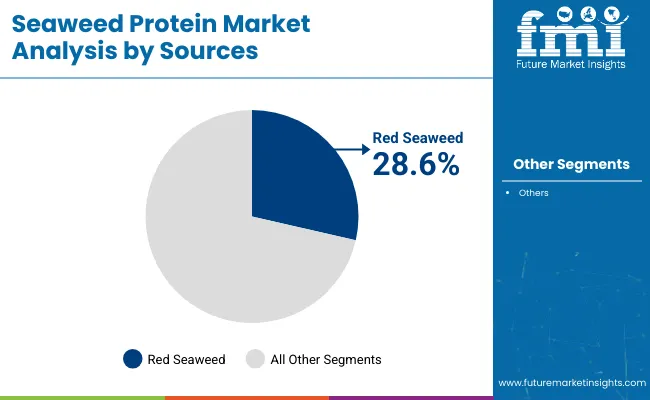
The red seaweed segment is expected to dominate the source segment holding more than 52.7% of the market share in 2022 and it is expected to grow with CAGR of around 8.9% over the forecast period.

For thousands of years, red seaweed has been used as a food source and to cure medical ailments. It is high in vitamins, minerals, and antioxidants that your body can easily absorb. Because it is abundant in dietary fiber, red seaweed can boost healthy circulation in the body, control blood sugar levels, and lower harmful cholesterol levels. It's also high in calcium and magnesium, which helps with bone health, and it's high in antioxidants, which boost the immune system and nourish your skin.

Red seaweed is simple to incorporate into the daily diet by eating vegan sushi rolls or miso soup; sushi is one of the easiest ways to acquire the benefits of red seaweed because it is created with Nori sheets. Here are a few fun facts about Nori: it's the Japanese word for "edible seaweed," and it has the highest protein content of any seaweed at approximately 50%. Nori is also high in B12, which is essential for all of us plant-based green monsters! Dulse is a type of red algae that grows in Canada, Ireland, and Eastern Europe and is used in soups, salads, and stir-fries.

Which Extraction Method is holding maximum share in the Global Seaweed Protein Market?

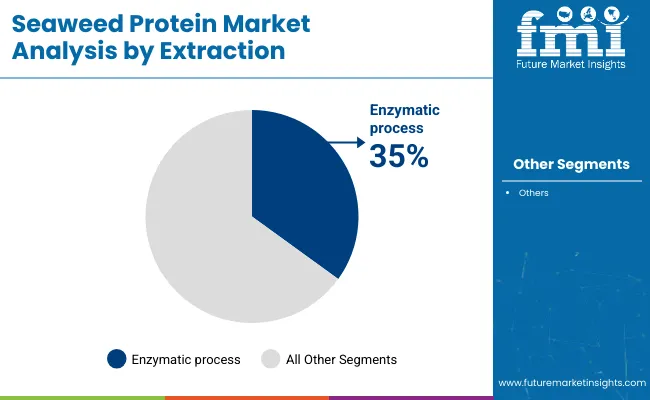
Among the extraction method segment conventional method is expected to dominate the market holding more than 43.5% share in year 2022 and it is expected to grow with significant CAGR of around 8.6% over the forecast period.

Since seaweed has a low protein level in its unprocessed and raw state, researchers have focused on finding better methods for extracting algal proteins to increase bioavailability. In comparison to proteins from other crops, algal proteins and their extraction have received little attention. alkaline, acidic, and aqueous procedures are used to extract algal proteins, which are then centrifuged many times and recovered via precipitation, chromatography, or ultrafiltration. For extracting proteins from A. nodosum, L. digitata, and Ulva spp. chemical extraction procedures such as alkali treatments and two-phase acid have been particularly effective.

Which Application will is Dominate Global Seaweed Protein Market?

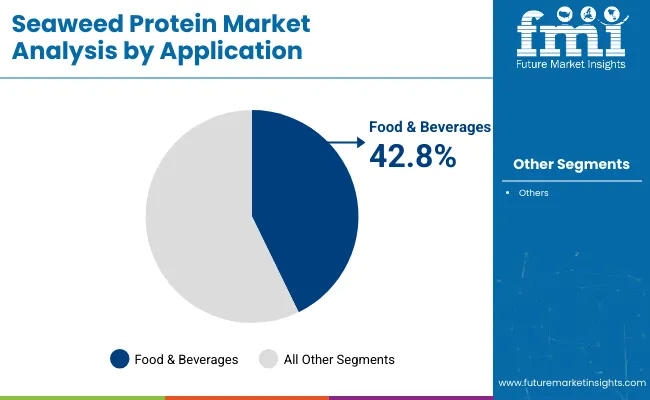
Among the application segment food & beverage is expected to dominate the market holding more than 42.1% share in year 2022 and it is expected to grow with significant CAGR of around 6.9% over the forecast period.

Protein is an essential ingredient in athletes' diets because it aids in the repair and reconstruction of muscle tissue that has been broken down during exercise. Protein intake should be between 1.2 and 1.7 grammes per kilogramme of body weight, according to the American College of Sports Medicine. Microalgae and seaweed are high in protein and contain all of the essential amino acids in varying amounts. Seaweed could thus be a great resource for athletes who require a lot of protein, especially vegan athletes who may not be able to consume eggs or dairy whey protein.

Get the data you need at a Fraction of the cost

Personalize your report by choosing insights you need
and save 40%!

Competitive Landscape     

The market has been fragmented for a long time due to the presence of various mid-sized and small competitors. Mergers and acquisitions, product innovation, and product capacity expansion are all priority for major players. In addition to this, the high competition in the market is promoting high product innovation in terms of types, rapid testing kits, marketing etc.

For instance –                  

6 May 2021, Schiedam - Last year, The Seaweed Company began a pilot project off the coast of the Netherlands at the Offshore Test Site. The goal of the pilot is to put the 'Cultivator's seaweed infrastructure to the test in the severe conditions of the North Sea. The Seaweed Company, one of the pilot's partners, is overjoyed to report that the installation exceeded expectations during the storm in March.

Scope of the Report

Attribute Details
Forecast Period 2022 to 2032
Historical Data Available for 2017 to 2021
Market Analysis USD Million for Value and MT for Volume
Key Regions Covered North America, Latin America, Europe, East Asia, South Asia, Oceania, and the Middle East & Africa
Key Countries Covered USA, Canada,  Brazil, Mexico, Chile, Peru, Argentina,  Germany, Italy, France, UK, Spain, BENELUX, Nordic, Russia, Poland,  China, Japan, South Korea,  India, Thailand, Indonesia, Malaysia, Singapore,  Australia, New  Zealand,  GCC Countries, Turkey, South Africa, North Africa, and Central Africa
Key Segments Covered Extruder Type, Product Type, Process and Region
  Key Companies Profiled
  • The Seaweed Company
  • Gelymar
  • Acadian Seaplants
  • Qingdao Gather Great Ocean Algae Industry Group
  • Roquette Klotze GmbH
  • Cargill, Incorporated
  • Acadian Seaplants
  • Qingdao Seawin Biotech Group Co. Ltd.
  • CP Kelco U.S., Inc.
  • AquAgri Processing Pvt. Ltd
Report Coverage Market Forecast, Company Share Analysis, Competition Intelligence, DROT Analysis, Market Dynamics and Challenges, and Strategic Growth Initiatives
Customization & Pricing Available upon Request

Global Seaweed Protein Market by Category

By Source, Global Seaweed Protein Market is segmented as:

  • Red Seaweed
  • Green Seaweed
  • Brown Seaweed

By Extraction Method, Global Seaweed Protein Market is segmented as:

  • Conventional
    • Physical Process
    • Enzymatic Process
    • Chemical Process
  • Current Method
    • Ultrasound Assisted Extraction (UAE)
    • Pulsed Electric Field
    • Microwave Assisted Extraction (MAE)

By Application, Global Seaweed Protein Market is segmented as:

  • Food & Beverages
  • Industrial Application
  • Animal Feed
  • Aquaculture
  • Cosmetics and Personal Care

By Region, Global Seaweed Protein Market is segmented as:

  • North America
  • Latin America
  • Europe
  • East Asia
  • South Asia
  • Oceania
  • Middle East and Africa

Frequently Asked Questions

How much is Global Seaweed Protein Market worth?

The global seaweed protein market is expected to be valued nearly USD 456.2 Mn in 2022.

What is the North America Seaweed Protein Market?

The North America seaweed protein market is valued at USD 102.2 Mn in 2022 and it is expected to grow with CAGR of 6.8% over the forecast period 2032.

Who are the key players involved in the Global Seaweed Protein market?

The key manufacturers of global seaweed protein are Gelymar., Roquette Klotze GmbH, CP Kelco U.S., Inc. and Qingdao Seawin Biotech Group Co. Ltd.

How Much Does Seaweed Protein Industry contribute to the Global Seaweed Market?

Seaweed protein industry accounted for 8.2% of sales in the global seaweed protein market.

At What Rate Will Global Seaweed Protein Demand Grow in China?

The China seaweed protein market will grow at 4.6% CAGR between 2022 and 2032.

Table of Content

1. Executive Summary

    1.1. Global Market Outlook

    1.2. Demand-side Trends

    1.3. Supply-side Trends

    1.4. Technology Roadmap Analysis

    1.5. Analysis and Recommendations

2. Market Overview

    2.1. Market Coverage / Taxonomy

    2.2. Market Definition / Scope / Limitations

3. Market Background

    3.1. Market Dynamics

        3.1.1. Drivers

        3.1.2. Restraints

        3.1.3. Opportunity 

        3.1.4. Trends

    3.2. Scenario Forecast

        3.2.1. Demand in Optimistic Scenario

        3.2.2. Demand in Likely Scenario

        3.2.3. Demand in Conservative Scenario

    3.3. Product launches & Recent Developments

    3.4. Product Life Cycle Analysis

    3.5. Value Chain Analysis

        3.5.1. Supply Side Participants and their Roles

            3.5.1.1. Producers

            3.5.1.2. Mid-Level Participants (Traders/ Agents/ Brokers)

            3.5.1.3. Wholesalers and Distributors

        3.5.2. % of Operating Margin Analysis

        3.5.3. List of Raw Material Suppliers

        3.5.4. List of Existing and Potential Buyer’s

    3.6. Global Market - Pricing Analysis

        3.6.1. Price Point Assessment by Region

        3.6.2. Price Point Assessment by Source

        3.6.3. Price Forecast till 2032

        3.6.4. Factors affecting pricing

    3.7. Forecast Factors - Relevance & Impact

    3.8. Regulatory Landscape

        3.8.1. Packaging & Labelling Regulations

        3.8.2. Certifications and Certifying Agency Overview

        3.8.3. Import/Export Policies

    3.9. Regional Parent Market Outlook

    3.10. Production and Consumption Statistics

    3.11. Import and Export Statistics

    3.12. Consumers Survey Analysis

    3.13. Macro-Economic Factors

    3.14. Product Claims & Nutritional Information Scan by Buyers

4. Global Market Analysis 2017-2021 and Forecast, 2022-2032

    4.1. Historical Market Size Value (US$ Mn) & Volume (MT) Analysis, 2017-2021

    4.2. Current and Future Market Size Value (US$ Mn) & Volume (MT) Projections, 2022-2032

        4.2.1. Y-o-Y Growth Trend Analysis

        4.2.2. Absolute $ Opportunity Analysis

5. Global Market Analysis 2017-2021 and Forecast 2022-2032, By Source

    5.1. Introduction / Key Findings

    5.2. Historical Market Size Value (US$ Mn) & Volume (MT) Analysis By Source, 2017-2021

    5.3. Current and Future Market Size Value (US$ Mn) & Volume (MT) Analysis and Forecast By Source, 2022-2032

        5.3.1. Red Seaweed

        5.3.2. Green Seaweed

        5.3.3. Brown Seaweed

    5.4. Y-o-Y Growth Trend Analysis By Source, 2017-2021

    5.5. Absolute $ Opportunity Analysis By Source, 2022-2032

6. Global Market Analysis 2017-2021 and Forecast 2022-2032, By Extraction Method

    6.1. Introduction / Key Findings

    6.2. Historical Market Size Value (US$ Mn) & Volume (MT) Analysis By Extraction Method, 2017-2021

    6.3. Current and Future Market Size Value (US$ Mn) & Volume (MT) Analysis and Forecast By Extraction Method, 2022-2032

        6.3.1. Conventional

            6.3.1.1. Physical Process

            6.3.1.2. Enzymatic Process

            6.3.1.3. Chemical Process

        6.3.2. Current Method

            6.3.2.1. Ultrasound Assisted Extraction (UAE)

            6.3.2.2. Pulsed Electric Field

            6.3.2.3. Microwave Assisted Extraction (MAE)

    6.4. Y-o-Y Growth Trend Analysis By Extraction Method, 2017-2021

    6.5. Absolute $ Opportunity Analysis By Extraction Method, 2022-2032

7. Global Market Analysis 2017-2021 and Forecast 2022-2032, By Application

    7.1. Introduction / Key Findings

    7.2. Historical Market Size Value (US$ Mn) & Volume (MT) Analysis By Application, 2017-2021

    7.3. Current and Future Market Size Value (US$ Mn) & Volume (MT) Analysis and Forecast By Application, 2022-2032

        7.3.1. Food & Beverages

        7.3.2. Industrial Application

        7.3.3. Animal Feed

        7.3.4. Aquaculture

        7.3.5. Cosmetics & Personal Care

    7.4. Y-o-Y Growth Trend Analysis By Application, 2017-2021

    7.5. Absolute $ Opportunity Analysis By Application, 2022-2032

8. Global Market Analysis 2017-2021 and Forecast 2022-2032, By Region

    8.1. Introduction

    8.2. Historical Market Size Value (US$ Mn) & Volume (MT) Analysis By Region, 2017-2021

    8.3. Current Market Size Value (US$ Mn) & Volume (MT) Analysis and Forecast By Region, 2022-2032

        8.3.1. North America

        8.3.2. Latin America

        8.3.3. Europe

        8.3.4. East Asia

        8.3.5. South Asia

        8.3.6. Oceania

        8.3.7. MEA

    8.4. Market Attractiveness Analysis By Region

9. North America Market Analysis 2017-2021 and Forecast 2022-2032, By Country

    9.1. Historical Market Size Value (US$ Mn) & Volume (MT) Trend Analysis By Market Taxonomy, 2017-2021

    9.2. Market Size Value (US$ Mn) & Volume (MT) Forecast By Market Taxonomy, 2022-2032

        9.2.1. By Country

            9.2.1.1. U.S.

            9.2.1.2. Canada

        9.2.2. By Source

        9.2.3. By Extraction Method

        9.2.4. By Application

    9.3. Market Attractiveness Analysis

        9.3.1. By Country

        9.3.2. By Source

        9.3.3. By Extraction Method

        9.3.4. By Application

    9.4. Key Takeaways

10. Latin America Market Analysis 2017-2021 and Forecast 2022-2032, By Country

    10.1. Historical Market Size Value (US$ Mn) & Volume (MT) Trend Analysis By Market Taxonomy, 2017-2021

    10.2. Market Size Value (US$ Mn) & Volume (MT) Forecast By Market Taxonomy, 2022-2032

        10.2.1. By Country

            10.2.1.1. Brazil

            10.2.1.2. Mexico

            10.2.1.3. Argentina

            10.2.1.4. Chile

            10.2.1.5. Peru

            10.2.1.6. Rest of Latin America

        10.2.2. By Source

        10.2.3. By Extraction Method

        10.2.4. By Application

    10.3. Market Attractiveness Analysis

        10.3.1. By Country

        10.3.2. By Source

        10.3.3. By Extraction Method

        10.3.4. By Application

    10.4. Key Takeaways

11. Europe Market Analysis 2017-2021 and Forecast 2022-2032, By Country

    11.1. Historical Market Size Value (US$ Mn) & Volume (MT) Trend Analysis By Market Taxonomy, 2017-2021

    11.2. Market Size Value (US$ Mn) & Volume (MT) Forecast By Market Taxonomy, 2022-2032

        11.2.1. By Country

            11.2.1.1. Germany

            11.2.1.2. Italy

            11.2.1.3. France

            11.2.1.4. U.K.

            11.2.1.5. Spain

            11.2.1.6. Russia

            11.2.1.7. BENELUX

            11.2.1.8. Poland

            11.2.1.9. Nordic Countries

            11.2.1.10. Rest of Europe

        11.2.2. By Source

        11.2.3. By Extraction Method

        11.2.4. By Application

    11.3. Market Attractiveness Analysis

        11.3.1. By Country

        11.3.2. By Source

        11.3.3. By Extraction Method

        11.3.4. By Application

    11.4. Key Takeaways

12. East Asia Market Analysis 2017-2021 and Forecast 2022-2032, By Country

    12.1. Historical Market Size Value (US$ Mn) & Volume (MT) Trend Analysis By Market Taxonomy, 2017-2021

    12.2. Market Size Value (US$ Mn) & Volume (MT) Forecast By Market Taxonomy, 2022-2032

        12.2.1. By Country

            12.2.1.1. China

            12.2.1.2. Japan

            12.2.1.3. South Korea

        12.2.2. By Source

        12.2.3. By Extraction Method

        12.2.4. By Application

    12.3. Market Attractiveness Analysis

        12.3.1. By Country

        12.3.2. By Source

        12.3.3. By Extraction Method

        12.3.4. By Application

    12.4. Key Takeaways

13. South Asia Market Analysis 2017-2021 and Forecast 2022-2032, By Country

    13.1. Historical Market Size Value (US$ Mn) & Volume (MT) Trend Analysis By Market Taxonomy, 2017-2021

    13.2. Market Size Value (US$ Mn) & Volume (MT) Forecast By Market Taxonomy, 2022-2032

        13.2.1. By Country

            13.2.1.1. India

            13.2.1.2. Thailand

            13.2.1.3. Malaysia

            13.2.1.4. Indonesia

            13.2.1.5. Singapore

            13.2.1.6. Rest of South Asia

        13.2.2. By Source

        13.2.3. By Extraction Method

        13.2.4. By Application

    13.3. Market Attractiveness Analysis

        13.3.1. By Country

        13.3.2. By Source

        13.3.3. By Extraction Method

        13.3.4. By Application

    13.4. Key Takeaways

14. Oceania Market Analysis 2017-2021 and Forecast 2022-2032, By Country

    14.1. Historical Market Size Value (US$ Mn) & Volume (MT) Trend Analysis By Market Taxonomy, 2017-2021

    14.2. Market Size Value (US$ Mn) & Volume (MT) Forecast By Market Taxonomy, 2022-2032

        14.2.1. By Country

            14.2.1.1. Australia

            14.2.1.2. New Zealand

        14.2.2. By Source

        14.2.3. By Extraction Method

        14.2.4. By Application

    14.3. Market Attractiveness Analysis

        14.3.1. By Country

        14.3.2. By Source

        14.3.3. By Extraction Method

        14.3.4. By Application

    14.4. Key Takeaways

15. MEA Market Analysis 2017-2021 and Forecast 2022-2032, By Country

    15.1. Historical Market Size Value (US$ Mn) & Volume (MT) Trend Analysis By Market Taxonomy, 2017-2021

    15.2. Market Size Value (US$ Mn) & Volume (MT) Forecast By Market Taxonomy, 2022-2032

        15.2.1. By Country

            15.2.1.1. GCC Countries

            15.2.1.2. South Africa

            15.2.1.3. Central Africa

            15.2.1.4. North Africa

        15.2.2. By Source

        15.2.3. By Extraction Method

        15.2.4. By Application

    15.3. Market Attractiveness Analysis

        15.3.1. By Country

        15.3.2. By Source

        15.3.3. By Extraction Method

        15.3.4. By Application

    15.4. Key Takeaways

16. Key Countries Market Analysis

    16.1. U.S.

        16.1.1. Pricing Analysis

        16.1.2. Market Share Analysis, 2021

            16.1.2.1. By Source

            16.1.2.2. By Extraction Method

            16.1.2.3. By Application

    16.2. Canada

        16.2.1. Pricing Analysis

        16.2.2. Market Share Analysis, 2021

            16.2.2.1. By Source

            16.2.2.2. By Extraction Method

            16.2.2.3. By Application

    16.3. Brazil

        16.3.1. Pricing Analysis

        16.3.2. Market Share Analysis, 2021

            16.3.2.1. By Source

            16.3.2.2. By Extraction Method

            16.3.2.3. By Application

    16.4. Mexico

        16.4.1. Pricing Analysis

        16.4.2. Market Share Analysis, 2021

            16.4.2.1. By Source

            16.4.2.2. By Extraction Method

            16.4.2.3. By Application

    16.5. Argentina

        16.5.1. Pricing Analysis

        16.5.2. Market Share Analysis, 2021

            16.5.2.1. By Source

            16.5.2.2. By Extraction Method

            16.5.2.3. By Application

    16.6. Chile

        16.6.1. Pricing Analysis

        16.6.2. Market Share Analysis, 2021

            16.6.2.1. By Source

            16.6.2.2. By Extraction Method

            16.6.2.3. By Application

    16.7. Peru

        16.7.1. Pricing Analysis

        16.7.2. Market Share Analysis, 2021

            16.7.2.1. By Source

            16.7.2.2. By Extraction Method

            16.7.2.3. By Application

    16.8. Germany

        16.8.1. Pricing Analysis

        16.8.2. Market Share Analysis, 2021

            16.8.2.1. By Source

            16.8.2.2. By Extraction Method

            16.8.2.3. By Application

    16.9. Italy

        16.9.1. Pricing Analysis

        16.9.2. Market Share Analysis, 2021

            16.9.2.1. By Source

            16.9.2.2. By Extraction Method

            16.9.2.3. By Application

    16.10. France

        16.10.1. Pricing Analysis

        16.10.2. Market Share Analysis, 2021

            16.10.2.1. By Source

            16.10.2.2. By Extraction Method

            16.10.2.3. By Application

    16.11. Spain

        16.11.1. Pricing Analysis

        16.11.2. Market Share Analysis, 2021

            16.11.2.1. By Source

            16.11.2.2. By Extraction Method

            16.11.2.3. By Application

    16.12. U.K.

        16.12.1. Pricing Analysis

        16.12.2. Market Share Analysis, 2021

            16.12.2.1. By Source

            16.12.2.2. By Extraction Method

            16.12.2.3. By Application

    16.13. Russia

        16.13.1. Pricing Analysis

        16.13.2. Market Share Analysis, 2021

            16.13.2.1. By Source

            16.13.2.2. By Extraction Method

            16.13.2.3. By Application

    16.14. Poland

        16.14.1. Pricing Analysis

        16.14.2. Market Share Analysis, 2021

            16.14.2.1. By Source

            16.14.2.2. By Extraction Method

            16.14.2.3. By Application

    16.15. BENELUX

        16.15.1. Pricing Analysis

        16.15.2. Market Share Analysis, 2021

            16.15.2.1. By Source

            16.15.2.2. By Extraction Method

            16.15.2.3. By Application

    16.16. Nordic Countries

        16.16.1. Pricing Analysis

        16.16.2. Market Share Analysis, 2021

            16.16.2.1. By Source

            16.16.2.2. By Extraction Method

            16.16.2.3. By Application

    16.17. China

        16.17.1. Pricing Analysis

        16.17.2. Market Share Analysis, 2021

            16.17.2.1. By Source

            16.17.2.2. By Extraction Method

            16.17.2.3. By Application

    16.18. Japan

        16.18.1. Pricing Analysis

        16.18.2. Market Share Analysis, 2021

            16.18.2.1. By Source

            16.18.2.2. By Extraction Method

            16.18.2.3. By Application

    16.19. South Korea

        16.19.1. Pricing Analysis

        16.19.2. Market Share Analysis, 2021

            16.19.2.1. By Source

            16.19.2.2. By Extraction Method

            16.19.2.3. By Application

    16.20. India

        16.20.1. Pricing Analysis

        16.20.2. Market Share Analysis, 2021

            16.20.2.1. By Source

            16.20.2.2. By Extraction Method

            16.20.2.3. By Application

    16.21. Thailand

        16.21.1. Pricing Analysis

        16.21.2. Market Share Analysis, 2021

            16.21.2.1. By Source

            16.21.2.2. By Extraction Method

            16.21.2.3. By Application

    16.22. Indonesia

        16.22.1. Pricing Analysis

        16.22.2. Market Share Analysis, 2021

            16.22.2.1. By Source

            16.22.2.2. By Extraction Method

            16.22.2.3. By Application

    16.23. Malaysia

        16.23.1. Pricing Analysis

        16.23.2. Market Share Analysis, 2021

            16.23.2.1. By Source

            16.23.2.2. By Extraction Method

            16.23.2.3. By Application

    16.24. Singapore

        16.24.1. Pricing Analysis

        16.24.2. Market Share Analysis, 2021

            16.24.2.1. By Source

            16.24.2.2. By Extraction Method

            16.24.2.3. By Application

    16.25. Australia

        16.25.1. Pricing Analysis

        16.25.2. Market Share Analysis, 2021

            16.25.2.1. By Source

            16.25.2.2. By Extraction Method

            16.25.2.3. By Application

    16.26. New Zealand

        16.26.1. Pricing Analysis

        16.26.2. Market Share Analysis, 2021

            16.26.2.1. By Source

            16.26.2.2. By Extraction Method

            16.26.2.3. By Application

    16.27. GCC Countries

        16.27.1. Pricing Analysis

        16.27.2. Market Share Analysis, 2021

            16.27.2.1. By Source

            16.27.2.2. By Extraction Method

            16.27.2.3. By Application

    16.28. South Africa

        16.28.1. Pricing Analysis

        16.28.2. Market Share Analysis, 2021

            16.28.2.1. By Source

            16.28.2.2. By Extraction Method

            16.28.2.3. By Application

    16.29. North Africa

        16.29.1. Pricing Analysis

        16.29.2. Market Share Analysis, 2021

            16.29.2.1. By Source

            16.29.2.2. By Extraction Method

            16.29.2.3. By Application

    16.30. Central Africa

        16.30.1. Pricing Analysis

        16.30.2. Market Share Analysis, 2021

            16.30.2.1. By Source

            16.30.2.2. By Extraction Method

            16.30.2.3. By Application

17. Market Structure Analysis

    17.1. Competition Dashboard

    17.2. Competition Benchmarking

    17.3. Market Share Analysis of Top Players

        17.3.1. By Regional

        17.3.2. By Source

        17.3.3. By Extraction Method

        17.3.4. By Application

18. Competition Analysis

    18.1. Competition Deep Dive

        18.1.1. The Seaweed Company

            18.1.1.1. Overview

            18.1.1.2. Product Portfolio

            18.1.1.3. Profitability by Market Segments (Extraction Method/Application/Source/Region)

            18.1.1.4. Sales Footprint

            18.1.1.5. Strategy Overview

                18.1.1.5.1. Marketing Strategy

                18.1.1.5.2. Product Strategy

                18.1.1.5.3. Channel Strategy

        18.1.2. Gelymar

            18.1.2.1. Overview

            18.1.2.2. Product Portfolio

            18.1.2.3. Profitability by Market Segments (Extraction Method/Application/Source/Region)

            18.1.2.4. Sales Footprint

            18.1.2.5. Strategy Overview

                18.1.2.5.1. Marketing Strategy

                18.1.2.5.2. Product Strategy

                18.1.2.5.3. Channel Strategy

        18.1.3. Acadian Seaplants

            18.1.3.1. Overview

            18.1.3.2. Product Portfolio

            18.1.3.3. Profitability by Market Segments (Extraction Method/Application/Source/Region)

            18.1.3.4. Sales Footprint

            18.1.3.5. Strategy Overview

                18.1.3.5.1. Marketing Strategy

                18.1.3.5.2. Product Strategy

                18.1.3.5.3. Channel Strategy

        18.1.4. Qingdao Gather Great Ocean Algae Industry Group

            18.1.4.1. Overview

            18.1.4.2. Product Portfolio

            18.1.4.3. Profitability by Market Segments (Extraction Method/Application/Source/Region)

            18.1.4.4. Sales Footprint

            18.1.4.5. Strategy Overview

                18.1.4.5.1. Marketing Strategy

                18.1.4.5.2. Product Strategy

                18.1.4.5.3. Channel Strategy

        18.1.5. Roquette Klotze GmbH

            18.1.5.1. Overview

            18.1.5.2. Product Portfolio

            18.1.5.3. Profitability by Market Segments (Extraction Method/Application/Source/Region)

            18.1.5.4. Sales Footprint

            18.1.5.5. Strategy Overview

                18.1.5.5.1. Marketing Strategy

                18.1.5.5.2. Product Strategy

                18.1.5.5.3. Channel Strategy

        18.1.6. Cargill, Incorporated

            18.1.6.1. Overview

            18.1.6.2. Product Portfolio

            18.1.6.3. Profitability by Market Segments (Extraction Method/Application/Source/Region)

            18.1.6.4. Sales Footprint

            18.1.6.5. Strategy Overview

                18.1.6.5.1. Marketing Strategy

                18.1.6.5.2. Product Strategy

                18.1.6.5.3. Channel Strategy

        18.1.7. Acadian Seaplants

            18.1.7.1. Overview

            18.1.7.2. Product Portfolio

            18.1.7.3. Profitability by Market Segments (Extraction Method/Application/Source/Region)

            18.1.7.4. Sales Footprint

            18.1.7.5. Strategy Overview

                18.1.7.5.1. Marketing Strategy

                18.1.7.5.2. Product Strategy

                18.1.7.5.3. Channel Strategy

        18.1.8. Qingdao Seawin Biotech Group Co. Ltd.

            18.1.8.1. Overview

            18.1.8.2. Product Portfolio

            18.1.8.3. Profitability by Market Segments (Extraction Method/Application/Source/Region)

            18.1.8.4. Sales Footprint

            18.1.8.5. Strategy Overview

                18.1.8.5.1. Marketing Strategy

                18.1.8.5.2. Product Strategy

                18.1.8.5.3. Channel Strategy

        18.1.9. CP Kelco U.S., Inc.

            18.1.9.1. Overview

            18.1.9.2. Product Portfolio

            18.1.9.3. Profitability by Market Segments (Extraction Method/Application/Source/Region)

            18.1.9.4. Sales Footprint

            18.1.9.5. Strategy Overview

                18.1.9.5.1. Marketing Strategy

                18.1.9.5.2. Product Strategy

                18.1.9.5.3. Channel Strategy

        18.1.10. AquAgri Processing Pvt. Ltd

            18.1.10.1. Overview

            18.1.10.2. Product Portfolio

            18.1.10.3. Profitability by Market Segments (Extraction Method/Application/Source/Region)

            18.1.10.4. Sales Footprint

            18.1.10.5. Strategy Overview

                18.1.10.5.1. Marketing Strategy

                18.1.10.5.2. Product Strategy

                18.1.10.5.3. Channel Strategy

        18.1.11. Others on Additional Request

            18.1.11.1. Overview

            18.1.11.2. Product Portfolio

            18.1.11.3. Profitability by Market Segments (Extraction Method/Application/Source/Region)

            18.1.11.4. Sales Footprint

            18.1.11.5. Strategy Overview

                18.1.11.5.1. Marketing Strategy

                18.1.11.5.2. Product Strategy

                18.1.11.5.3. Channel Strategy

19. Assumptions & Acronyms Used

20. Research Methodology    

Don't pay for what you don't need

Customize your report by selecting specific countries or regions and save 30%!

List of Tables

Table 1: Global Market Value (US$ Mn) Forecast by Region, 2017-2032

Table 2: Global Market Volume (MT) Forecast by Region, 2017-2032

Table 3: Global Market Value (US$ Mn) Forecast by Source, 2017-2032

Table 4: Global Market Volume (MT) Forecast by Source, 2017-2032

Table 5: Global Market Value (US$ Mn) Forecast by Extraction Method, 2017-2032

Table 6: Global Market Volume (MT) Forecast by Extraction Method, 2017-2032

Table 7: Global Market Value (US$ Mn) Forecast by Application, 2017-2032

Table 8: Global Market Volume (MT) Forecast by Application, 2017-2032

Table 9: North America Market Value (US$ Mn) Forecast by Country, 2017-2032

Table 10: North America Market Volume (MT) Forecast by Country, 2017-2032

Table 11: North America Market Value (US$ Mn) Forecast by Source, 2017-2032

Table 12: North America Market Volume (MT) Forecast by Source, 2017-2032

Table 13: North America Market Value (US$ Mn) Forecast by Extraction Method, 2017-2032

Table 14: North America Market Volume (MT) Forecast by Extraction Method, 2017-2032

Table 15: North America Market Value (US$ Mn) Forecast by Application, 2017-2032

Table 16: North America Market Volume (MT) Forecast by Application, 2017-2032

Table 17: Latin America Market Value (US$ Mn) Forecast by Country, 2017-2032

Table 18: Latin America Market Volume (MT) Forecast by Country, 2017-2032

Table 19: Latin America Market Value (US$ Mn) Forecast by Source, 2017-2032

Table 20: Latin America Market Volume (MT) Forecast by Source, 2017-2032

Table 21: Latin America Market Value (US$ Mn) Forecast by Extraction Method, 2017-2032

Table 22: Latin America Market Volume (MT) Forecast by Extraction Method, 2017-2032

Table 23: Latin America Market Value (US$ Mn) Forecast by Application, 2017-2032

Table 24: Latin America Market Volume (MT) Forecast by Application, 2017-2032

Table 25: Europe Market Value (US$ Mn) Forecast by Country, 2017-2032

Table 26: Europe Market Volume (MT) Forecast by Country, 2017-2032

Table 27: Europe Market Value (US$ Mn) Forecast by Source, 2017-2032

Table 28: Europe Market Volume (MT) Forecast by Source, 2017-2032

Table 29: Europe Market Value (US$ Mn) Forecast by Extraction Method, 2017-2032

Table 30: Europe Market Volume (MT) Forecast by Extraction Method, 2017-2032

Table 31: Europe Market Value (US$ Mn) Forecast by Application, 2017-2032

Table 32: Europe Market Volume (MT) Forecast by Application, 2017-2032

Table 33: East Asia Market Value (US$ Mn) Forecast by Country, 2017-2032

Table 34: East Asia Market Volume (MT) Forecast by Country, 2017-2032

Table 35: East Asia Market Value (US$ Mn) Forecast by Source, 2017-2032

Table 36: East Asia Market Volume (MT) Forecast by Source, 2017-2032

Table 37: East Asia Market Value (US$ Mn) Forecast by Extraction Method, 2017-2032

Table 38: East Asia Market Volume (MT) Forecast by Extraction Method, 2017-2032

Table 39: East Asia Market Value (US$ Mn) Forecast by Application, 2017-2032

Table 40: East Asia Market Volume (MT) Forecast by Application, 2017-2032

Table 41: South Asia Market Value (US$ Mn) Forecast by Country, 2017-2032

Table 42: South Asia Market Volume (MT) Forecast by Country, 2017-2032

Table 43: South Asia Market Value (US$ Mn) Forecast by Source, 2017-2032

Table 44: South Asia Market Volume (MT) Forecast by Source, 2017-2032

Table 45: South Asia Market Value (US$ Mn) Forecast by Extraction Method, 2017-2032

Table 46: South Asia Market Volume (MT) Forecast by Extraction Method, 2017-2032

Table 47: South Asia Market Value (US$ Mn) Forecast by Application, 2017-2032

Table 48: South Asia Market Volume (MT) Forecast by Application, 2017-2032

Table 49: Oceania Market Value (US$ Mn) Forecast by Country, 2017-2032

Table 50: Oceania Market Volume (MT) Forecast by Country, 2017-2032

Table 51: Oceania Market Value (US$ Mn) Forecast by Source, 2017-2032

Table 52: Oceania Market Volume (MT) Forecast by Source, 2017-2032

Table 53: Oceania Market Value (US$ Mn) Forecast by Extraction Method, 2017-2032

Table 54: Oceania Market Volume (MT) Forecast by Extraction Method, 2017-2032

Table 55: Oceania Market Value (US$ Mn) Forecast by Application, 2017-2032

Table 56: Oceania Market Volume (MT) Forecast by Application, 2017-2032

Table 57: MEA Market Value (US$ Mn) Forecast by Country, 2017-2032

Table 58: MEA Market Volume (MT) Forecast by Country, 2017-2032

Table 59: MEA Market Value (US$ Mn) Forecast by Source, 2017-2032

Table 60: MEA Market Volume (MT) Forecast by Source, 2017-2032

Table 61: MEA Market Value (US$ Mn) Forecast by Extraction Method, 2017-2032

Table 62: MEA Market Volume (MT) Forecast by Extraction Method, 2017-2032

Table 63: MEA Market Value (US$ Mn) Forecast by Application, 2017-2032

Table 64: MEA Market Volume (MT) Forecast by Application, 2017-2032
Nandini Roy Choudhury

Principal Consultant

Talk to Analyst

Find your sweet spots for generating winning opportunities in this market.

List of Charts

Figure 1: Global Market Value (US$ Mn) by Source, 2022-2032

Figure 2: Global Market Value (US$ Mn) by Extraction Method, 2022-2032

Figure 3: Global Market Value (US$ Mn) by Application, 2022-2032

Figure 4: Global Market Value (US$ Mn) by Region, 2022-2032

Figure 5: Global Market Value (US$ Mn) Analysis by Region, 2017-2032

Figure 6: Global Market Volume (MT) Analysis by Region, 2017-2032

Figure 7: Global Market Value Share (%) and BPS Analysis by Region, 2022-2032

Figure 8: Global Market Y-o-Y Growth (%) Projections by Region, 2022-2032

Figure 9: Global Market Value (US$ Mn) Analysis by Source, 2017-2032

Figure 10: Global Market Volume (MT) Analysis by Source, 2017-2032

Figure 11: Global Market Value Share (%) and BPS Analysis by Source, 2022-2032

Figure 12: Global Market Y-o-Y Growth (%) Projections by Source, 2022-2032

Figure 13: Global Market Value (US$ Mn) Analysis by Extraction Method, 2017-2032

Figure 14: Global Market Volume (MT) Analysis by Extraction Method, 2017-2032

Figure 15: Global Market Value Share (%) and BPS Analysis by Extraction Method, 2022-2032

Figure 16: Global Market Y-o-Y Growth (%) Projections by Extraction Method, 2022-2032

Figure 17: Global Market Value (US$ Mn) Analysis by Application, 2017-2032

Figure 18: Global Market Volume (MT) Analysis by Application, 2017-2032

Figure 19: Global Market Value Share (%) and BPS Analysis by Application, 2022-2032

Figure 20: Global Market Y-o-Y Growth (%) Projections by Application, 2022-2032

Figure 21: Global Market Attractiveness by Source, 2022-2032

Figure 22: Global Market Attractiveness by Extraction Method, 2022-2032

Figure 23: Global Market Attractiveness by Application, 2022-2032

Figure 24: Global Market Attractiveness by Region, 2022-2032

Figure 25: North America Market Value (US$ Mn) by Source, 2022-2032

Figure 26: North America Market Value (US$ Mn) by Extraction Method, 2022-2032

Figure 27: North America Market Value (US$ Mn) by Application, 2022-2032

Figure 28: North America Market Value (US$ Mn) by Country, 2022-2032

Figure 29: North America Market Value (US$ Mn) Analysis by Country, 2017-2032

Figure 30: North America Market Volume (MT) Analysis by Country, 2017-2032

Figure 31: North America Market Value Share (%) and BPS Analysis by Country, 2022-2032

Figure 32: North America Market Y-o-Y Growth (%) Projections by Country, 2022-2032

Figure 33: North America Market Value (US$ Mn) Analysis by Source, 2017-2032

Figure 34: North America Market Volume (MT) Analysis by Source, 2017-2032

Figure 35: North America Market Value Share (%) and BPS Analysis by Source, 2022-2032

Figure 36: North America Market Y-o-Y Growth (%) Projections by Source, 2022-2032

Figure 37: North America Market Value (US$ Mn) Analysis by Extraction Method, 2017-2032

Figure 38: North America Market Volume (MT) Analysis by Extraction Method, 2017-2032

Figure 39: North America Market Value Share (%) and BPS Analysis by Extraction Method, 2022-2032

Figure 40: North America Market Y-o-Y Growth (%) Projections by Extraction Method, 2022-2032

Figure 41: North America Market Value (US$ Mn) Analysis by Application, 2017-2032

Figure 42: North America Market Volume (MT) Analysis by Application, 2017-2032

Figure 43: North America Market Value Share (%) and BPS Analysis by Application, 2022-2032

Figure 44: North America Market Y-o-Y Growth (%) Projections by Application, 2022-2032

Figure 45: North America Market Attractiveness by Source, 2022-2032

Figure 46: North America Market Attractiveness by Extraction Method, 2022-2032

Figure 47: North America Market Attractiveness by Application, 2022-2032

Figure 48: North America Market Attractiveness by Country, 2022-2032

Figure 49: Latin America Market Value (US$ Mn) by Source, 2022-2032

Figure 50: Latin America Market Value (US$ Mn) by Extraction Method, 2022-2032

Figure 51: Latin America Market Value (US$ Mn) by Application, 2022-2032

Figure 52: Latin America Market Value (US$ Mn) by Country, 2022-2032

Figure 53: Latin America Market Value (US$ Mn) Analysis by Country, 2017-2032

Figure 54: Latin America Market Volume (MT) Analysis by Country, 2017-2032

Figure 55: Latin America Market Value Share (%) and BPS Analysis by Country, 2022-2032

Figure 56: Latin America Market Y-o-Y Growth (%) Projections by Country, 2022-2032

Figure 57: Latin America Market Value (US$ Mn) Analysis by Source, 2017-2032

Figure 58: Latin America Market Volume (MT) Analysis by Source, 2017-2032

Figure 59: Latin America Market Value Share (%) and BPS Analysis by Source, 2022-2032

Figure 60: Latin America Market Y-o-Y Growth (%) Projections by Source, 2022-2032

Figure 61: Latin America Market Value (US$ Mn) Analysis by Extraction Method, 2017-2032

Figure 62: Latin America Market Volume (MT) Analysis by Extraction Method, 2017-2032

Figure 63: Latin America Market Value Share (%) and BPS Analysis by Extraction Method, 2022-2032

Figure 64: Latin America Market Y-o-Y Growth (%) Projections by Extraction Method, 2022-2032

Figure 65: Latin America Market Value (US$ Mn) Analysis by Application, 2017-2032

Figure 66: Latin America Market Volume (MT) Analysis by Application, 2017-2032

Figure 67: Latin America Market Value Share (%) and BPS Analysis by Application, 2022-2032

Figure 68: Latin America Market Y-o-Y Growth (%) Projections by Application, 2022-2032

Figure 69: Latin America Market Attractiveness by Source, 2022-2032

Figure 70: Latin America Market Attractiveness by Extraction Method, 2022-2032

Figure 71: Latin America Market Attractiveness by Application, 2022-2032

Figure 72: Latin America Market Attractiveness by Country, 2022-2032

Figure 73: Europe Market Value (US$ Mn) by Source, 2022-2032

Figure 74: Europe Market Value (US$ Mn) by Extraction Method, 2022-2032

Figure 75: Europe Market Value (US$ Mn) by Application, 2022-2032

Figure 76: Europe Market Value (US$ Mn) by Country, 2022-2032

Figure 77: Europe Market Value (US$ Mn) Analysis by Country, 2017-2032

Figure 78: Europe Market Volume (MT) Analysis by Country, 2017-2032

Figure 79: Europe Market Value Share (%) and BPS Analysis by Country, 2022-2032

Figure 80: Europe Market Y-o-Y Growth (%) Projections by Country, 2022-2032

Figure 81: Europe Market Value (US$ Mn) Analysis by Source, 2017-2032

Figure 82: Europe Market Volume (MT) Analysis by Source, 2017-2032

Figure 83: Europe Market Value Share (%) and BPS Analysis by Source, 2022-2032

Figure 84: Europe Market Y-o-Y Growth (%) Projections by Source, 2022-2032

Figure 85: Europe Market Value (US$ Mn) Analysis by Extraction Method, 2017-2032

Figure 86: Europe Market Volume (MT) Analysis by Extraction Method, 2017-2032

Figure 87: Europe Market Value Share (%) and BPS Analysis by Extraction Method, 2022-2032

Figure 88: Europe Market Y-o-Y Growth (%) Projections by Extraction Method, 2022-2032

Figure 89: Europe Market Value (US$ Mn) Analysis by Application, 2017-2032

Figure 90: Europe Market Volume (MT) Analysis by Application, 2017-2032

Figure 91: Europe Market Value Share (%) and BPS Analysis by Application, 2022-2032

Figure 92: Europe Market Y-o-Y Growth (%) Projections by Application, 2022-2032

Figure 93: Europe Market Attractiveness by Source, 2022-2032

Figure 94: Europe Market Attractiveness by Extraction Method, 2022-2032

Figure 95: Europe Market Attractiveness by Application, 2022-2032

Figure 96: Europe Market Attractiveness by Country, 2022-2032

Figure 97: East Asia Market Value (US$ Mn) by Source, 2022-2032

Figure 98: East Asia Market Value (US$ Mn) by Extraction Method, 2022-2032

Figure 99: East Asia Market Value (US$ Mn) by Application, 2022-2032

Figure 100: East Asia Market Value (US$ Mn) by Country, 2022-2032

Figure 101: East Asia Market Value (US$ Mn) Analysis by Country, 2017-2032

Figure 102: East Asia Market Volume (MT) Analysis by Country, 2017-2032

Figure 103: East Asia Market Value Share (%) and BPS Analysis by Country, 2022-2032

Figure 104: East Asia Market Y-o-Y Growth (%) Projections by Country, 2022-2032

Figure 105: East Asia Market Value (US$ Mn) Analysis by Source, 2017-2032

Figure 106: East Asia Market Volume (MT) Analysis by Source, 2017-2032

Figure 107: East Asia Market Value Share (%) and BPS Analysis by Source, 2022-2032

Figure 108: East Asia Market Y-o-Y Growth (%) Projections by Source, 2022-2032

Figure 109: East Asia Market Value (US$ Mn) Analysis by Extraction Method, 2017-2032

Figure 110: East Asia Market Volume (MT) Analysis by Extraction Method, 2017-2032

Figure 111: East Asia Market Value Share (%) and BPS Analysis by Extraction Method, 2022-2032

Figure 112: East Asia Market Y-o-Y Growth (%) Projections by Extraction Method, 2022-2032

Figure 113: East Asia Market Value (US$ Mn) Analysis by Application, 2017-2032

Figure 114: East Asia Market Volume (MT) Analysis by Application, 2017-2032

Figure 115: East Asia Market Value Share (%) and BPS Analysis by Application, 2022-2032

Figure 116: East Asia Market Y-o-Y Growth (%) Projections by Application, 2022-2032

Figure 117: East Asia Market Attractiveness by Source, 2022-2032

Figure 118: East Asia Market Attractiveness by Extraction Method, 2022-2032

Figure 119: East Asia Market Attractiveness by Application, 2022-2032

Figure 120: East Asia Market Attractiveness by Country, 2022-2032

Figure 121: South Asia Market Value (US$ Mn) by Source, 2022-2032

Figure 122: South Asia Market Value (US$ Mn) by Extraction Method, 2022-2032

Figure 123: South Asia Market Value (US$ Mn) by Application, 2022-2032

Figure 124: South Asia Market Value (US$ Mn) by Country, 2022-2032

Figure 125: South Asia Market Value (US$ Mn) Analysis by Country, 2017-2032

Figure 126: South Asia Market Volume (MT) Analysis by Country, 2017-2032

Figure 127: South Asia Market Value Share (%) and BPS Analysis by Country, 2022-2032

Figure 128: South Asia Market Y-o-Y Growth (%) Projections by Country, 2022-2032

Figure 129: South Asia Market Value (US$ Mn) Analysis by Source, 2017-2032

Figure 130: South Asia Market Volume (MT) Analysis by Source, 2017-2032

Figure 131: South Asia Market Value Share (%) and BPS Analysis by Source, 2022-2032

Figure 132: South Asia Market Y-o-Y Growth (%) Projections by Source, 2022-2032

Figure 133: South Asia Market Value (US$ Mn) Analysis by Extraction Method, 2017-2032

Figure 134: South Asia Market Volume (MT) Analysis by Extraction Method, 2017-2032

Figure 135: South Asia Market Value Share (%) and BPS Analysis by Extraction Method, 2022-2032

Figure 136: South Asia Market Y-o-Y Growth (%) Projections by Extraction Method, 2022-2032

Figure 137: South Asia Market Value (US$ Mn) Analysis by Application, 2017-2032

Figure 138: South Asia Market Volume (MT) Analysis by Application, 2017-2032

Figure 139: South Asia Market Value Share (%) and BPS Analysis by Application, 2022-2032

Figure 140: South Asia Market Y-o-Y Growth (%) Projections by Application, 2022-2032

Figure 141: South Asia Market Attractiveness by Source, 2022-2032

Figure 142: South Asia Market Attractiveness by Extraction Method, 2022-2032

Figure 143: South Asia Market Attractiveness by Application, 2022-2032

Figure 144: South Asia Market Attractiveness by Country, 2022-2032

Figure 145: Oceania Market Value (US$ Mn) by Source, 2022-2032

Figure 146: Oceania Market Value (US$ Mn) by Extraction Method, 2022-2032

Figure 147: Oceania Market Value (US$ Mn) by Application, 2022-2032

Figure 148: Oceania Market Value (US$ Mn) by Country, 2022-2032

Figure 149: Oceania Market Value (US$ Mn) Analysis by Country, 2017-2032

Figure 150: Oceania Market Volume (MT) Analysis by Country, 2017-2032

Figure 151: Oceania Market Value Share (%) and BPS Analysis by Country, 2022-2032

Figure 152: Oceania Market Y-o-Y Growth (%) Projections by Country, 2022-2032

Figure 153: Oceania Market Value (US$ Mn) Analysis by Source, 2017-2032

Figure 154: Oceania Market Volume (MT) Analysis by Source, 2017-2032

Figure 155: Oceania Market Value Share (%) and BPS Analysis by Source, 2022-2032

Figure 156: Oceania Market Y-o-Y Growth (%) Projections by Source, 2022-2032

Figure 157: Oceania Market Value (US$ Mn) Analysis by Extraction Method, 2017-2032

Figure 158: Oceania Market Volume (MT) Analysis by Extraction Method, 2017-2032

Figure 159: Oceania Market Value Share (%) and BPS Analysis by Extraction Method, 2022-2032

Figure 160: Oceania Market Y-o-Y Growth (%) Projections by Extraction Method, 2022-2032

Figure 161: Oceania Market Value (US$ Mn) Analysis by Application, 2017-2032

Figure 162: Oceania Market Volume (MT) Analysis by Application, 2017-2032

Figure 163: Oceania Market Value Share (%) and BPS Analysis by Application, 2022-2032

Figure 164: Oceania Market Y-o-Y Growth (%) Projections by Application, 2022-2032

Figure 165: Oceania Market Attractiveness by Source, 2022-2032

Figure 166: Oceania Market Attractiveness by Extraction Method, 2022-2032

Figure 167: Oceania Market Attractiveness by Application, 2022-2032

Figure 168: Oceania Market Attractiveness by Country, 2022-2032

Figure 169: MEA Market Value (US$ Mn) by Source, 2022-2032

Figure 170: MEA Market Value (US$ Mn) by Extraction Method, 2022-2032

Figure 171: MEA Market Value (US$ Mn) by Application, 2022-2032

Figure 172: MEA Market Value (US$ Mn) by Country, 2022-2032

Figure 173: MEA Market Value (US$ Mn) Analysis by Country, 2017-2032

Figure 174: MEA Market Volume (MT) Analysis by Country, 2017-2032

Figure 175: MEA Market Value Share (%) and BPS Analysis by Country, 2022-2032

Figure 176: MEA Market Y-o-Y Growth (%) Projections by Country, 2022-2032

Figure 177: MEA Market Value (US$ Mn) Analysis by Source, 2017-2032

Figure 178: MEA Market Volume (MT) Analysis by Source, 2017-2032

Figure 179: MEA Market Value Share (%) and BPS Analysis by Source, 2022-2032

Figure 180: MEA Market Y-o-Y Growth (%) Projections by Source, 2022-2032

Figure 181: MEA Market Value (US$ Mn) Analysis by Extraction Method, 2017-2032

Figure 182: MEA Market Volume (MT) Analysis by Extraction Method, 2017-2032

Figure 183: MEA Market Value Share (%) and BPS Analysis by Extraction Method, 2022-2032

Figure 184: MEA Market Y-o-Y Growth (%) Projections by Extraction Method, 2022-2032

Figure 185: MEA Market Value (US$ Mn) Analysis by Application, 2017-2032

Figure 186: MEA Market Volume (MT) Analysis by Application, 2017-2032

Figure 187: MEA Market Value Share (%) and BPS Analysis by Application, 2022-2032

Figure 188: MEA Market Y-o-Y Growth (%) Projections by Application, 2022-2032

Figure 189: MEA Market Attractiveness by Source, 2022-2032

Figure 190: MEA Market Attractiveness by Extraction Method, 2022-2032

Figure 191: MEA Market Attractiveness by Application, 2022-2032

Figure 192: MEA Market Attractiveness by Country, 2022-2032

Recommendations

Food and Beverage

Pea Protein Market

Published : February 2024

Food and Beverage

Pea Protein Ingredients Market

Published : January 2023

Food and Beverage

Soy Protein Ingredient Market

Published : September 2022

Food and Beverage

Texturized Vegetable Protein Market

Published : February 2021

Explore Food and Beverage Insights

View Reports