The seaweeds market is estimated to be worth USD 9.39 billion in 2025 and is projected to reach a value of USD 23.92 billion by 2035, expanding at a CAGR of 9.8% over the assessment period of 2025 to 2035.
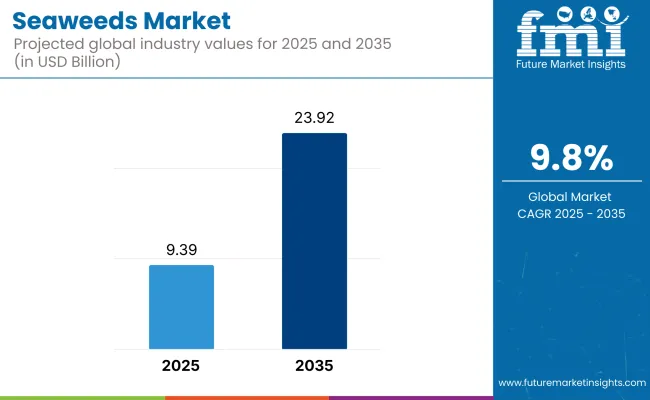
The industry enjoys an expansion surge, spurred on by the increasing need for nutrient-rich, sustainable, and multifunctional food and industrial applications. It is characterized by the high amounts of vitamins, minerals, antioxidants, and dietary fiber they contain, have a wide range of applications including but not limited to food products, pharmaceuticals, cosmetics, biofuels, and fertilizers. The increasing concentration on plant-based nutrition and environmentally friendly food sources is progressively propelling the further development of the market.
A primary drivings force behind the market is the increase in consumers' preferences for functional and health booster food products. They have been included in the list of foods that may have beneficial effects on digestion, immune system, weight, and heart. Out of this snack bars, sushi, salads, health supplements are the most popular ones. Moreover, Seaweeds hydrocolloids, such as agar, carrageenan, and alginate are the major gelling and stabilizing agents utilized in the food & beverage industry.
The scale vibrant aquaculture and type ocean farming further develop the industry, in their turn. Farming being a quick-growing biomass that neither needs freshwater nor fertilizers or herb pest is gaining ground as one of the mainstreams solutions to be i.e. people can have food and with technology enable scenario of climate change. Besides state-driven programs and inquiries into Seaweeds bioplastics and biofertilizers, such initiatives also trigger the growth of the sector.
The advancement of processes in availing, drying, and extraction methods which are a major factor in the improvement of the quality, the retention of nutrition, and the range of application of products offers a wider scope for enhanced product features. Innovations in seaweed-derived protein extraction and fermentation techniques are supporting the development of alternative proteins, catering to the rising demand for plant-based and vegan-friendly protein sources.
In spite of the adversities, there are great chances for the improvement of the market. The gradual switch to sources in the fields of nutritional supplements and the like vege substitution create room for new expansion. Also, the boosted resource funds in seaweed-centered medicines, cosmetics, and animal feed industries are the main drivers of further progress. With the ecosystem being fully explored, the industry shall maintain its long prospering term.
The industry is experiencing strong growth, driven by increasing health awareness, sustainability, and multifaceted applications in various industries. In the food and beverage sector, the consumption is increasing because of its nutritional benefits, plant protein content, and umami flavor enhancement, propelling demand for snacks, seasonings, and plant-based alternatives.
The pharma industry makes use of compounds from Seaweeds such as alginate, carrageenan, and fucoidan for their wound-healing, antiviral, and anti-inflammatory activities. In cosmetics as well, the usage is strong for Seaweeds extracts in skin-rejuvenation, hydrating, and anti-aging products.
In agriculture, bio-stimulants are picking up pace for enhancing farm soils and crop yields. The animal feed business has limited but consistent uptake, primarily for enriching livestock diets and intestinal health. Companies focusing on organic certification, sustainable harvesting practices, and novel formulations will spearhead the market growth.
Market comparison table based on difference in CAGR over six months between base year and current year (2024 and 2025). The table analyses about key performance trends, revenue changes with all types derived stocks, to access each sector movements in the market. The first half (H1) goes from January to June and the second (H2) from July to December.
| Particular | Value CAGR |
|---|---|
| H1 | 9.4% (2024 to 2034) |
| H2 | 9.8% (2024 to 2034) |
| H1 | 9.6% (2025 to 2035) |
| H2 | 10% (2025 to 2035) |
From 2024 to 2034, the market experienced a steady expansion, with CAGR patterns indicating robust demand across various applications. In the first half (H1) of the decade from 2025 to 2035, the market is expected to grow at a CAGR of 9.6%, followed by an acceleration to 10.0% in the second half (H2).
Increased demand for natural ingredients and widening uses of it in a variety of industries, such as food, agriculture, cosmetics and pharmaceuticals, is being indicated in numbers. Innovation in processing, sustainable sourcing, and diversification of use will drive growth in the market in the future.
Between the period 2020 to 2024, the sector saw explosive growth, as their nutritional value became more known, their sustainability increased, and how they could be used in diverse industries. Consumers were becoming health-conscious, so they were in search of plant minerals, plant protein, protein and fiber, and lo and behold, people wanted seaweed-based food items in large demand. Pharmaceutical and cosmetics firms also used its extracts because of their skin-revitalizer and anti-inflammatory properties.
Cultivation and harvesting of it in a friendly way became trendy, particularly in Europe and Asia-Pacific, as governments and conservation bodies promoted its cultivation for carbon sequestration and restoration of marine ecosystems. Advances in processing technology, like better drying and extraction methods, improved the scalability of the market. Yet inconsistent supply chains, high production, and regulatory challenges necessitated that companies innovate and streamline operations.
Between 2025 and 2035, the market will further grow as research opens up new uses in biotechnology, biofuels, and pharmaceuticals. Biorefinery technology and precision fermentation will optimize the production of bioactive compounds to achieve the best functional food and nutraceutical value of the seaweed. AI-driven aquaculture farming and intelligent farming techniques will maintain quality, quantity, and did not disrupt the ecological balance.
Bioplastic and seaweed-packaging products will be the standard in the market as companies shift towards minimizing the usage of petrochemical products. Legislation as frameworks for policies will back Seaweeds cultivation en masse to solve global warming issues, and the business will be regarded as a suitable technique for compensations within the carbon market.
The caloric intake will shift towards personalized diet plans like diet supplements seaweed-fortified for particular health conditions of lagging health aspects of individuals. The product will be genuine with blockchain technology supply chain genuineness and traceability technology, which pushes it to lead future-proof sustainable food, medicine, green materials.
Comparative Market Shift Analysis (2020 to 2024 vs. 2025 to 2035)
| 2020 to 2024 | 2025 to 2035 |
|---|---|
| Increased demand for it as a superfood that contains high protein, fiber, and mineral content. | Growth of precision fermentation approaches to enhance bioavailability and functional attributes of seaweed-derived nutrients. |
| Increased use of its extracts in skincare cosmetics, pharmaceuticals, and supplements. | Employment of AI-based research in targeted composition for personalized nutrition and pharmaceuticals. |
| Government and environmental initiatives in promoting sustainable farming for beach restoration. | Large-scale culture as a carbon credit offset measure in global sustainability initiatives. |
| Innovations in drying, extraction, and processing technology. | Biorefinery innovations allowing biofuels from it, bioplastics, and high-end biomaterials. |
| Scaling is restricted due to high production costs and inconsistent supply chains. | Blockchain-traceability technology guarantees quality, purity, and ethically sourced supply. |
| Increased demand by consumers for plant and alternate protein sources. | Maximized large-scale cultivation of it tailored to high-protein varieties for replacing conventional proteins. |
The industry encounters supply chain risks due to environmental and climatic problems. Ocean pollution, climate change, and natural calamities can affect the cultivation, which leads to the increase and decrease in yield and quality. To tackle this issue, businesses should adopt the idea of farming in a sustainable way and look into several different cultivation areas to be able to assure a stable supply.
Changes in consumer behavior and demand are another side of the coin in terms of risk. The consumption of the products is on the rise because of the many health benefits they have, but false information about the possibility of contaminants or allergens could affect sales. Organizations have to practice open marketing, inform consumers of product safety, and point out the nutritional benefits in order to keep the market demand unchanged.
The price market partly experiences instability due to seasonal production, labor costs, and the unbalanced supply of goods and demand. Unexpected incidents can result in cost disturbance, which in turn may lower profit. To resolve this, the company can make investments in the development of more efficient technologies for processing, improving the methods of logistics, and the setting of long-term agreements with suppliers to stabilize the prices.
Also, there are concerns about sustainability such as marine biodiversity conservation and the problem of overharvesting that influence the industry development process. Enterprises have to follow the method of harvesting that is friendly to the environment. They should also finance studies to find out about the regulation of overfishing in the future. Besides, they are required to work with other federal agencies to teach the public the importance of cultivating it the right way and keeping nature in a good state.
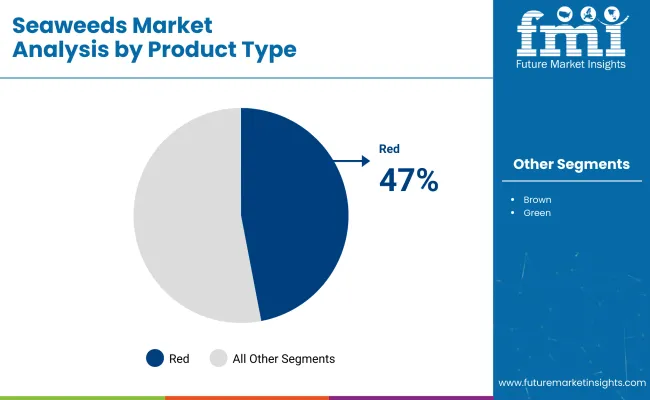
| Segment | Value Share (2025) |
|---|---|
| Red Seaweeds (By Type) | 47% |
The industry is dominated by red seaweed, with a projected market share of 47% in 2025. This dominance can be credited to its extensive use in food applications, especially in Asian culinary practices, where it is a staple of sushi making, soup creation, and salad preparation.
The commercial value of it is well known as the major source of hydrocolloids (e.g., carrageenan, agar); hydrocolloids are widely used as thickeners, stabilizers, and emulsifiers in the food and beverage industry. Leaders in this area, such as CP Kelco, DuPont (IFF), and Cargill, are using red seaweed in products, including plant-based dairy substitutes and pharmaceutical formulations.
Brown Seaweeds holds the maximum share of 35%, is the leading segment in the global industry, and is trending due to its high nutritional value and the presence of iodine, which is rich and, therefore, is used in health supplements and cosmetics.
It is the most widely used for alginate, a key ingredient in food processing, pharmaceuticals, and biodegradable packaging. Sustainable harvesting and advanced processing technologies are currently being adopted by brands such as Algaia, KIMICA, and FMC Corporation to enable the effective commercial utilization of brown seaweed-based products. Moreover, the growing consumption of it in animal feeds and biofuels is likely to contribute to its market growth.
Both are well poised for continued growth. The increasing demand for sustainable, plant-based, and functional ingredients is powered by developments in alternative proteins, dietary supplements, and sustainable packaging solutions.
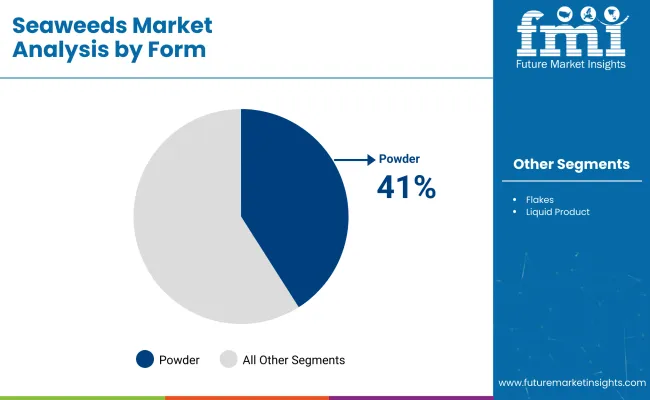
| Segment | Value Share (2025) |
|---|---|
| Powder (By Form) | 41% |
The powder segment will be the most valuable segment of the total industry in terms of market value by 2025, accounting for 41% of the total market value. Powdered form is very common in functional food products, dietary supplements, cosmetics, and pharmaceuticals due to its high nutrient density, amenability to integration into new products, and relatively high shelf stability. This edible Seaweeds ingredient is a rich source of iodine, dietary fibers, and antioxidants.
It is an important ingredient in plant protein formulations, high-nutrient blends, and marine-based cosmetic formulations. Algatech, Seakura, and Ocean Harvest Technology, among others, are cashed up and racing to meet the growing demand for seaweed-based specialty materials, particularly for nutraceuticals.
Companies with 34% of the market share are mostly used in culinary, seasonings, and direct eating. Flakes are ubiquitous in Japanese, Korean, and other Asian cuisines, where they are used as topical garnishes for rice dishes and soups and in sushi and fried snacks.
Other factors that drive the flakes market are the rising trend of a plant-based diet and alternative protein sources are increasing demand for flakes as a nutrient-dense and umami-rich seasoning. Companies like Mara Seaweed, Maine Coast Sea Vegetables, and SeaSnax have responded to health-conscious consumers’ needs for low-sodium, mineral-rich alternatives to high-sodium snacks by creating organic and sustainably sourced flakes.
As the world is focused on sustainable nutrition, functional foods, and clean-label ingredients, there will be significant market growth for powdered and flaked options, propelled by technological advancements and smart developments in applications in the health and wellness space.
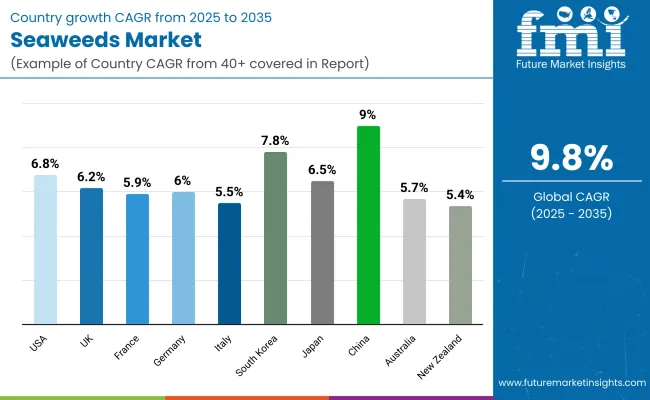
| Countries | CAGR (2025 to 2035) |
|---|---|
| USA | 6.8% |
| UK | 6.2% |
| France | 5.9% |
| Germany | 6.0% |
| Italy | 5.5% |
| South Korea | 7.8% |
| Japan | 6.5% |
| China | 9.0% |
| Australia | 5.7% |
| New Zealand | 5.4% |
The USA industry grows as consumers become increasingly aware of the health value of it and its application in food, pharmaceuticals, and biofuels. Developments in aquaculture technology and government encouragement for creating sustainable aquaculture fuel ongoing growth.
Food manufacturers seeking plant materials and natural ingredients and flavorings fuel increasing demand. With an estimated CAGR of 6.8% during 2025 to 2035, the USA market is also gaining pace with research investment, technological advancements, and greater use of it in functional foods and nutritional supplements.
The UK industry is gaining pace as consumers become increasingly focused on sustainability and nutrition-rich sources of food. The prospects for farming lie along the coastline of the country, and initiatives sponsored by the government are giving a boost to local production.
Its usage in the pharmaceutical, cosmetic, and bio-packaging sectors is increasing, as is demand. Demand for organic and green materials also stimulates market growth. The 6.2% CAGR indicates consistent growth, with technology advances and convergence in the food and cosmetics industries giving a fillip.
France has a very advanced aquaculture industry, and the cultivation is becoming the focal point of its blue economy. Its market growth is fueled by rising demand for organic and functional food products and seaweed-based agricultural biofertilizers. Start-ups and research institutions are collaborating to create value-added products like pharmaceuticals and biodegradable packaging. With a forecast CAGR of 5.9% over 2025 to 2035, the industry of France will grow with innovation, policy initiatives, and increasing consumer acceptance.
Germany's industry hopes for biotech growth and increased green farming investment. Plant proteins, biodegradables, and sustainable food packs are raising demand. German industry hopes for medicinal and personal care uses through its bioactive substance. The industry will be capable of expanding with government scheme support, firm-level sustainability practices, and mass consumer goods adoption of seaweed-based substances. Growth is forecasted in the market to be at 6.0% CAGR.
Italy's sector continues to develop consistently, with a focus on its traditional food use and new applications in cosmetics and nutraceuticals. The foods are part of the rich country's gastronomic heritage, and functional foods continue to be demanded by consumers.
Seaweeds farming off the Mediterranean coast with a focus on sustainable aquaculture is driving local culture forward. Industrial expansion is supported by collaboration between the players in the food industry and research centers. A 5.5% CAGR defines Italy's gradual but consistent growth, driven by the shift towards environment-conservation-driven eating habits.
South Korea possesses a highly developed food-grade industry, and high-quality exports are rising continuously. Aquatic culture technology and R&D of functional food are used to propel the market. Government policies in marine farming and ecological farming enhance production efficiency. With the growth in demand for high-quality products globally, South Korea's industry will grow strongly at a CAGR of 7.8% from 2025 to 2035.
Japan leads the industry, which is led by a strong cultural consumption pattern and extensive research in marine biotechnology. Japan is cultivating sustainable harvesting techniques and novel pharmaceutical, cosmetic, and new biofuel applications. Home demand for premium foods remains robust, and foreign markets remain expanding. The Japanese industry will thrive with a CAGR of 6.5%, led by innovation, sustainability as well as increasing exports.
China dominates the global production with government support and massive aquaculture estates. Demand arises from growing applications in food, drugs, cosmetics, and biomaterials. Research investment and environmental protection are enhancing production efficiency. China's industry, with a CAGR of 9.0%, reflects its dominance in value chains worldwide and strengthens growth in high-value product niches.
Australia's sector is in its early stages of rapid growth due to sustainability drives and growing demand for plant-based food. Australia's clean ocean waters offer the ideal conditions for high-quality farming. New applications in animal feed, bioplastics, and carbon capture are stimulating investments. Australia's sector will expand with a 5.7% CAGR growth rate due to technological advancements, research collaborations, and rising consumer awareness.
New Zealand is exploiting its pristine marine environment to build a high-value industry. The sector is advancing by leaps and bounds as aquaculture technology and applications in pharmaceuticals, functional foods, and green packaging expand. Industry-private sector partnerships and government funding are driving research into the economic and environmental worth of Seaweeds culture. The New Zealand industrial sector is projected to grow steadily at a CAGR of 5.4%, driven by ecological sustainability and the demand for organic ocean products.
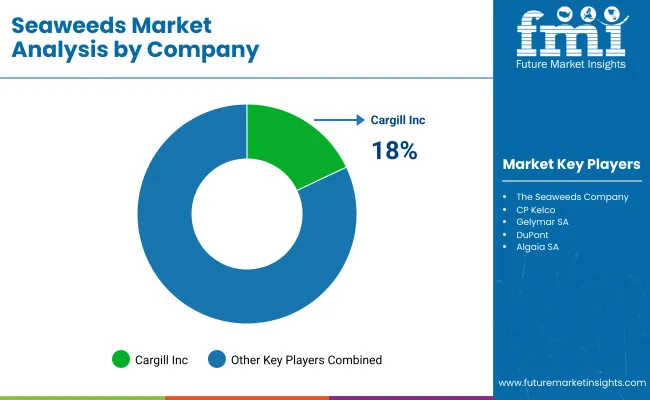
The market is expected to increase rapidly in 2024 because individuals are looking for healthy and nutritious food. Natural and health-related products are attracting consumers, and are full of vitamins, minerals, and antioxidants. Their wide use in the food, cosmetics, pharmaceutical, and agricultural industries is also fueling market growth.
Firms like Cargill Inc., The Seaweeds Company, CP Kelco, Gelymar SA, and DuPont are leading this growth through enhanced research as well as development infrastructure to launch new seaweed-derived products. They are diversifying product portfolios to cater to rising demand for plant-based, functional, and clean-label foods and building global supply chains through strategic partnerships and sustainable procurement practices.
Manufacturing of goods is necessary so that brands become identifiable while working within a competitive world. Companies are producing goods out of it so that they can meet changing food trends, i.e., vegan, gluten-free, and organic. To this, the demand for clean-label food products is added, thus pushing the big companies towards greater openness in production and sourcing so that they match the consumers' requirements for sustainability as well as ethical production.
Sustainability is a major market driver of competitiveness, particularly with environmental degradation and overhunting increasing. Businesses that utilize sustainable processing and green harvesting will be more competitive. In addition, partnerships between producers and Seaweeds producers are integrating seaweed-based ingredients into mainstream food products to make them more affordable and accessible to consumers.
Industry players expand and penetrate new markets by engaging in acquisitions and alliances. As the population increases its knowledge of the health effects, growth also targets the market in the long term as industry leaders embrace innovation and sustainability to attempt to drive market share.
Market Share Analysis by Company
| Company Name | Estimated Market Share (%) |
|---|---|
| Cargill Inc. | 18-22% |
| The Seaweeds Company | 14-18% |
| CP Kelco | 12-16% |
| Gelymar SA | 10-14% |
| DuPont | 8-12% |
| Other Key Players | 30-40% |
| Company Name | Key Offerings/Activities |
|---|---|
| Cargill Inc. | Develops seaweed-derived hydrocolloids for food applications, supporting texture enhancement and plant-based formulations. |
| The Seaweeds Company | Focuses on regenerative farming, supplying sustainable products for health, food, and agricultural applications. |
| CP Kelco | Produces high-quality carrageenan from red seaweed, used in dairy and plant-based food products for stability. |
| Gelymar SA | Specializes in sustainably sourced carrageenan for food, personal care, and pharmaceutical applications. |
| DuPont | Innovates with seaweed-based emulsifiers and texturizers for enhanced food and beverage applications. |
Key Company Insights
Cargill Inc. (18-22%)
Cargill continues to expand its seaweed-based product offerings, particularly in food stabilization and texturizing applications. The company is strengthening its sustainability initiatives by investing in responsible farming to meet increasing global demand.
The Seaweeds Company (14-18%)
This company emphasizes regenerative ocean farming practices to provide sustainable products. It has gained significant traction in the food, health, and agricultural sectors by positioning itself as a leader in eco-friendly marine cultivation.
CP Kelco (12-16%)
CP Kelco is a key player in the hydrocolloids market, focusing on carrageenan production for food and beverage applications. Its strong R&D capabilities drive innovation in plant-based and clean-label food solutions.
Gelymar SA (10-14%)
Gelymar’s commitment to sustainable harvesting has positioned it as a leading supplier of carrageenan for various industries. The company continues to expand its global reach by partnering with food and personal care brands.
DuPont (8-12%)
DuPont integrates ingredients into its food science portfolio, enhancing emulsification and texturization properties in plant-based products.
Other Key Players (30-40% Combined)
By product type, the industry is segmented into red, brown, and green seaweed.
By form, the market includes flakes, powder, and liquid products.
By end sue, the key applications are in food & beverages, agricultural fertilizers, animal feed additives, pharmaceuticals, and cosmetics & personal care.
By region, the market analysis covers North America, Latin America, Europe, Asia Pacific, and the Middle East & Africa (MEA).
The industry is expected to reach USD 9.39 billion in 2025.
The market is projected to grow to USD 23.92 billion by 2035.
The market is expected to grow at a CAGR of approximately 9.8% from 2025 to 2035.
China is expected to experience the highest growth, with a CAGR of 9.0% during the forecast period.
The Red Seaweeds segment is one of the most widely consumed categories in the market.
Leading companies include Cargill Inc., The Seaweeds Company, CP Kelco, Gelymar SA, DuPont, Algaia SA, Qingdao Gather Great Ocean Algae Industry Group Co., Ltd., Seasol International Pty Ltd, Acadian Seaplants Limited, and Irish Seaweeds.


Full Research Suite comprises of:
Market outlook & trends analysis
Interviews & case studies
Strategic recommendations
Vendor profiles & capabilities analysis
5-year forecasts
8 regions and 60+ country-level data splits
Market segment data splits
12 months of continuous data updates
DELIVERED AS:
PDF EXCEL ONLINE

Thank you!
You will receive an email from our Business Development Manager. Please be sure to check your SPAM/JUNK folder too.
Chat With
MaRIA